

Abstract
Prospective studies have shown an association between depressive symptoms and cognitive impairment among older adults. However, the neural correlates of this relationship are poorly understood. Our aim was to examine whether interactive effects of memory deficits and depressive symptoms are present in the memory-associated functional networks, in nondemented elderly subjects. Fifteen subjects with amnestic mild cognitive impairment (aMCI) and 20 age-matched normal (CN) elderly subjects participated in this cross-sectional study. Resting-state functional connectivity MRI (R-fMRI) measured the hippocampal functional connectivity (HFC) alterations between the two groups. Voxelwise linear regression analysis was performed to correlate hippocampal network strength with the Rey Auditory Verbal Learning Test delayed recall and the Geriatric Depression Scale scores, after adjusting for age and group effects. Poorer memory performance was associated with decreased positively correlated HFC connectivity in the specific frontal lobe and default mode network (DMN) structures. Poorer memory performance also was associated with decreased anticorrelated HFC connectivity in the bilateral inferior parietal and right dorsolateral prefrontal cortices. In contrast, greater depressive symptom severity was associated with increased HFC connectivity in several frontal lobes and DMN regions. Depressive symptoms and memory functions had interactive effects on the HFC, in the frontal, temporal, and PCC structures. Our findings suggest that the R-fMRI technique can be used to examine the changes in functional neural networks where memory deficits and depressive symptoms coexist in the geriatric population.
Keywords: Mild cognitive impairment, Alzheimer’s disease, late-life depressive symptoms, functional connectivity magnetic resonance imaging, hippocampus, elderly
1. Introduction
Memory deficits and depressive symptoms often coexist in late life and are of significant clinical concern, because they are associated with accelerated functional decline, poorer outcomes of comorbid medical disorders and increased risk of mortality [18, 38, 54]. The presence of comorbid cognitive impairment and depressive symptoms also increases the risk of subsequent development of Alzheimer’s disease (AD) [2, 8, 40]. For instance, patients with late-life depression (LLD) with cognitive impairment have a higher rate of conversion to AD [2]. Moreover, individuals with amnestic mild cognitive impairment (aMCI) show an increased future incidence of AD, especially when they are also depressed [8, 40]. However, the effects of cognitive impairment and depressive symptoms on the memory-associated functional brain networks among nondemented older adults are poorly understood. Furthermore, the neurophysiological mechanisms that can explain the interactive relationship of memory deficits and depressive symptoms in elderly persons are unclear.
The hippocampus, which plays an important role in regulating memory and mood [31], is one of the earliest brain regions affected by AD neuropathology [32]. Smaller hippocampal volumes are observed in individuals with aMCI, as well as in adults suffering from late-life depressive symptoms [6, 10, 17, 34, 53]. Furthermore, functional magnetic resonance imaging (fMRI) task-specific studies have demonstrated alterations in hippocampal activation in aMCI [37, 39], as well as in major depression [50, 59]. While these findings separately show hippocampus involvement in individuals with cognitive impairment and depression, we are not aware of studies that have examined the relationship of hippocampal functional activation changes with memory deficits and depressive symptoms, in a cohort of nondemented older adults. Also, it is unclear from task-induced fMRI studies as to how the hippocampus is interconnected with other functionally related brain regions.
Resting-state functional connectivity MRI (R-fMRI) is a novel technique, which measures inter-regional correlations between the spontaneous blood oxygenation level-dependent (BOLD) fluctuations in spatially separated, but functionally related brain regions at rest [11, 19, 20, 49]. This technique is employed to study the relationship between functionally connected brain regions in normal and diseased states [7, 9, 12, 13, 24, 36, 47, 48, 52, 60]. Furthermore, resting-state functional connectivity reflects structural connectivity in the default mode network (DMN) among healthy adults [25, 28]. Recently, depression-related increased resting-state functional connectivity of three distinct neural networks to the dorsal medial prefrontal cortex was reported in young adults with major depression [49]. On the other hand, diminished resting-state functional connectivity between the hippocampus and posterior cingulate cortex (PCC) of the DMN was seen in aMCI subjects relative to cognitively normal persons [52]. In addition, functional disruptions in positive and anticorrelated networks were observed in aMCI and AD [52, 58]. We chose the hippocampus as the seed region to better understand the distinct and interactive effects of depressive symptoms and memory performance on the correlated and anticorrelated hippocampal functional connectivity (HFC) networks, in older adults without dementia.
The objectives of this study were to examine if distinct HFC patterns are associated with memory impairment and depressive symptoms, and to determine whether an interactive relationship of memory deficits and depressive symptoms on the HFC networks is observed, in nondemented older adults.
2. Material and methods
2.1. Participants
A total of 36 nondemented older subjects (16 aMCI and 20 age-matched cognitively normal (CN)) were recruited through the Medical College of Wisconsin Memory Disorders Clinic, and local advertising. Written informed consent was obtained from all subjects in accordance with the Institutional Review Board of the Medical College of Wisconsin. One aMCI subject was excluded from the analyses, because of excessive motion artifact (as described below).
All CN and aMCI subjects had a reliable informant, adequate visual and auditory acuity, good health and a modified Hachinski Ischemic Scale score ≤4. The following were exclusionary: history of AD, Parkinson’s disease, multiple sclerosis, seizures, or head injury with loss of consciousness within the past five years; stroke or transient ischemic attack within the past two years; drug or alcohol abuse within the past five years. CN subjects were required to have a clinical dementia rating (CDR) score of 0 and a Mini-Mental State Examination (MMSE) score ≥24 and a Yesavage 30-item Geriatric Depression Scale (GDS) score of < 10.
Subjects were diagnosed with aMCI according to the published criteria [61]: 1) subjective memory complaint, corroborated by an informant; 2) objective evidence of impaired memory, as determined by the Rey Auditory Verbal Learning Test delayed recall (RAVLT-DR) score or the Consortium to Establish a Registry for Alzheimer’s Disease (CERAD) word list recall score ≤1 SD below the mean for age and education; 3) normal general cognitive function as identified by the following: global CDR score of 0.5 with memory box scores of 0.5 or 1; no more than two box scores other than memory rated as high as 1; no box score rated greater than 1; and an MMSE score ≥24; 4) intact activities of daily living were illustrated by Blessed Dementia Rating Scale ≤3.5; and 5) not demented, according to National Institute of Neurological and Communicative Disorders and Stroke-Alzheimer’s Disease and Related Disorders Association criteria. A neurologist with subspecialty certification in behavioral neurology and neuropsychiatry evaluated all study participants. Two neurologists with expertise in dementia reviewed the data, and consensus diagnoses were reached [62, 63].
None of the CN participants were on cholinesterase inhibitors or antidepressants at the time of the scan. One CN subject had a history of major depression 20 years ago, and he was euthymic at the time of enrollment. One aMCI subject with a normal GDS score was taking bupropion and donepezil at the time of scanning. Four aMCI subjects had GDS scores >10 and they were not outliers according to the Grubbs test [27]. These subjects did not endorse a history of depression, a depression diagnosis or treatment prior to the aMCI diagnosis. A total of 35 subjects were included in the final analyses.
2.2. MRI acquisition
Imaging was performed using a whole-body 3T Signa GE scanner (Waukesha, Wis.) with a standard transmit-receive head coil. An automated shimming protocol was used to improve the field homogeneity, and reduce image distortion. During the resting-state acquisitions, no specific cognitive tasks were performed, and the study participants were instructed to close their eyes and relax. Sagittal resting-state fMRI datasets of the whole brain were obtained in 6 minutes with a single-shot gradient echo-planar imaging (EPI) pulse sequence. The R-fMRI imaging parameters were: TE of 25 ms, TR of 2 s, flip angle of 90°; 36 slices were obtained; slice thickness was 4 mm with a matrix size of 64×64 and field of view of 24 cm × 24 cm. High-resolution SPGR 3D axial images were acquired for anatomical reference. The parameters were: TE/TR/TI of 4/10/450 ms, flip angle of 12°, number of slices of 144, slice thickness of 1 mm, matrix size of 256×192.
2.3. Data analysis
R-fMRI data analysis was carried out using AFNI software (http://afni.nimh.nih.gov/afni) and MATLAB programs (The MathWorks, Inc., Natick, Mass.).
Motion correction on the resting-state R-fMRI data was performed by volume registration (3dvolreg, AFNI) for the three translational parameters and three rotational parameters. Any subject demonstrating more than 1 mm translational movement or more than 1° rotational movement was excluded from further analysis. Based on these criteria, one aMCI subject was excluded. Out of the 180 points for each voxel time series, 173 points were kept, while the first five and the last two points were discarded to preserve steady-state data only. Then, detrending was carried out to remove Legendre polynomials (3dDetrend, AFNI). Possible contamination signals from the white matter and cerebrospinal fluid (CSF) were regressed out with averaged signals from the white matter and the ventricles. In addition, the six-motion vectors and physical noise (cardiac and respiratory signal) were regressed out from each voxel time series, and a global signal regression was performed (3dDeconvolve, AFNI) [16, 21]. A band-pass filter was applied to keep only low-frequency fluctuations within 0.015 Hz and 0.1 Hz frequency range.
2.3.1. Hippocampal functional connectivity map
For each subject, right and left hippocampal voxels were manually identified, as described previously [46]. The time courses of these hippocampal voxels were cross-correlated to the time courses of all other voxels in the brain mask, and Pearson correlation coefficients (rij) were obtained, where i is a hippocampal voxel and j is a brain voxel. The cross-correlation coefficients (rij) were converted to m scores according to Fisher’s transformation for normal distribution [64]. Because different study subjects had different numbers of hippocampal voxels, the same numbers of voxels were selected for comparison. In the present study, 30 hippocampal voxels with the highest averaged m scores from each subject were selected as the “seed” for generating the hippocampus functional connectivity (HFC) map (please see discussion in appendix A). Each HFC map was registered to the study subject’s own anatomical images, and transformed to the Talairach space (44) with 2 mm × 2 mm × 2 mm cubic interpolation (adwarp), followed by applying a 6-mm full width half maximum Gaussian kernel filter to compensate for intersubject anatomical variability for cross-subject comparison. The individual’s HFC maps (the m-score distribution) were averaged within each of the CN and aMCI groups, respectively. The group HFC map was generated by applying a voxelwise t-test within a group of subjects against a null hypothesis of no HFC connectivity; a multiple comparison analysis with AlphaSim, in AFNI software was employed, according to Monticello simulation [46] (significance level of α=0.05, the individual voxel probability threshold p<0.05 and a cluster size larger than 4,048 mm3 for generating the HFC map).
2.3.2. Correlation of HFC network with RAVLT-DR and GDS scores
We examined the relationship of GDS and RAVLT delayed recall (RAVLT-DR) scores on the HFC network by using the voxelwise multivariate linear regression model (3dRegAna, AFNI):
where mi is the average m value of ith voxel, β0 is the intercept of straight line fitting in the model; β1, β2, and β3 are the effects of GDS scores, RAVLT-DR scores, and their interactions respectively, β4 and β5 are the effects of group membership (i.e., the effects of CN and aMCI groups) and age, respectively. The above equation is fitted to the data from all subjects. When testing the effects of GDS scores, RAVLT-DR scores, and their interactions on the functional connectivity strength of the ith voxel within the HFC network, we used group membership and age as nuisance regressors in the above linear regression model. The voxelwise multivariate linear regression map was generated after multiple comparison analysis (AlphaSim, AFNI, α=0.05, p<0.05 and cluster size > 4,048 mm3) to identify the correlation maps of RAVLT and GDS scores, as well as their interaction map.
The partial correlation coefficient was further calculated as a measure of the linear dependence of the dependent variable (m) on individual independent variables (e.g., GDS, RAVLT-DR, GDS and RAVLT-DR interactions), given that the other independent variables already have been included in the model. For example, to calculate the partial correlation between m and GDS scores, we first determined the linear regression of m on the remaining independent variables (i.e., excluding GDS scores);
where madj is the residual error remaining after the above least-squares regression fit. b1,I (i=1,2,3,4,5) indicates the parameters for the constant, RAVLT-DR, GDS and RAVLT-DR interactions, group and age in the above model. Similarly, we performed linear regression of the GDS on the remaining independent variables,
where GDSadj is the residual error remaining after the above least-squares regression fit. b2,i (i=1,2,3,4,5) indicates the parameters for the constant, RAVLT-DR, GDS and RAVLT-DR interaction, group, and age in the above model.
The partial correlation between m and the GDS is then found by calculating the correlation coefficient (CC) between the m fit residual, madj, and the GDS fit residual, GDSadj:
Correspondingly, we calculated the ρm,RAVLT on the each region based on the main effects of RAVLT-DR on the HFC network, using the above approach.
3. Results
3.1. Subject characteristics
Demographic information and clinical evaluations are shown in Table 1. MMSE and RAVLT-DR scores were significantly lower in the aMCI group. GDS scores were significantly higher for aMCI subjects relative to age-matched normal participants (p< 0.01).
Table 1.
Demographics and clinical characteristics of aMCI and CN subjects.
| Characteristic | aMCI (n = 15) | CN(n = 20) | p value | ||
|---|---|---|---|---|---|
| M | SD | M | SD | ||
| Gender(female/male) | 6/9 | 9/11 | NS† | ||
| Age, years | 77.9 | 5.9 | 75.0 | 6.2 | NS |
| Education, years | 14.0 | 2.3 | 14.8 | 2.6 | NS |
| MMSE | 27.7 | 1.8 | 29.5 | 0.8 | < 0.002* |
| RAVLT delayed recall | 6.8 | 3.6 | 11.2 | 3.4 | < 0.0001* |
| GDS | 7.0 | 6.3 | 2.7 | 2.8 | < 0.01* |
Abbreviations: aMCI: amnesic mild cognitive impairment; CN: cognitively normal; M: mean; SD: Standard Deviation; MMSE: Mini-Mental State Examination; RAVLT: Rey Auditory Verbal Learning Test; GDS: Geriatric Depression Scale; NS: not significant.
p value was obtained by χ2 two-tailed test.
p values were obtained by a two-sample two-tailed t test. Unless otherwise indicated, data are presented as mean ± SD.
3.2. Correlation maps between hippocampal functional connectivity and behavioral performances
Voxelwise partial correlation analysis was performed to examine the correlations between hippocampal connectivity and RAVLT-DR scores (Figure 1). The RAVLT-DR scores correlated with the HFC in certain frontal and parietal lobe structures, and in the PCC. Poorer memory performances were associated with decreased hippocampal functional networks (both positively correlated and anticorrelated networks). The main effects of RAVLT-DR scores on the positively correlated network were found in the left medial prefrontal and superior frontal gyrus (SFG), and PCC (Figure 1A), whereas the main effects of the RAVLT-DR scores on the anticorrelated networks were seen in the bilateral inferior parietal cortices (IPC) and right dorsolateral prefrontal cortex (DLPFC) (Figure 1B).
Figure 1.

Neural correlates of the effects of memory performance on the hippocampus functional connectivity network. A: Location of the main effects of RAVLT-DR scores on the positively correlated HFC network; B: Location of the main effects of RAVLT-DR scores on the anticorrelated HFC network.
Footnote: Color bar is presented with z scores, bright red color indicates positive correlation and blue color bar indicates negative correlation.
Abbreviations: mPFC: medial prefrontal cortex; PCC: posterior cingulate cortex; L SFG: left superior frontal gyrus; R DLPFC: right dorsolateral frontal cortex; R IPC: right inferior parietal cortex; L IPC: left inferior parietal cortex; RAVLT-DR: Rey Auditory verbal learning test-delayed recall score.
In contrast, GDS scores were associated positively with the HFC strength in the bilateral ventromedial prefrontal cortex (VMPFC) and thalamus; left SFG and DLPFC, and right PCC. Primarily, positively correlated HFC networks were found in relation to depressive symptoms, and no anticorrelated networks were observed. The higher the depressive symptoms were, the greater the hippocampal functional connectivity was in these brain areas (Figure 2). The detailed information on the anatomical locations, cluster sizes, and significance levels of these maps are presented in Table 2. The GDS-RAVLT interactive effects on the HFC network were observed in the bilateral PCC, SFG and medial prefrontal cortices and in the left middle temporal gyrus (MTG) (Figure 3).
Figure 2.

Neural correlates of the effects of depressive symptoms on the hippocampus functional connectivity network.
Footnote: Color bar is presented with z scores, bright red color indicates positive correlation.
Abbreviations: VMPFC: ventromedial prefrontal cortex; PCC: posterior cingulate cortex; LSFG: left superior frontal gyrus; LDLPFC: left dorsolateral prefrontal cortex; GDS: geriatric depression scale; Tha: Thalamus.
Table 2.
The relationship of depressive symptoms and memory performance on the hippocampal functional network.
| Brain region | Side | BA | Cluster Size (mm3) | Talairach coordinates |
Z Score | ||
|---|---|---|---|---|---|---|---|
| x | y | z | |||||
| GDS Scores | |||||||
| VMPFC | L/R | 10 | 38736 | −11 | 47 | 24 | 4.08 |
| SFG | L | 8 | −20 | 38 | 43 | 3.34 | |
| DLPFC | L | 9 | −35 | 9 | 36 | 3.64 | |
| PCC | R | 30/31 | 8576 | 1 | −53 | 28 | 4.11 |
| Thalamus | L | −9 | −24 | 1 | 2.78 | ||
| Thalamus | R | 9 | −22 | 10 | 2.81 | ||
| RAVLT Delayed Recall Scores | |||||||
| Positive Correlation HFC Network | |||||||
| PCC | L | 30 | 20360 | −13 | −61 | 16 | 4.14 |
| mPFC | L | 10 | 8160 | −17 | 51 | 16 | 4.02 |
| SFG | L | 8 | 5040 | −22 | 34 | 44 | 3.51 |
| Anticorrelation HFC Network | |||||||
| DLPFC | R | 9,46 | 7040 | 39 | 35 | 30 | −3.16 |
| IPC | L | 40 | 6152 | −53 | −44 | 28 | −3.57 |
| IPC | R | 40 | 4544 | 53 | −39 | 40 | −3.05 |
Abbreviations: VMPFC: ventromedial prefrontal cortex; PCC: posterior cingulate cortex; DLPFC: dorsolateral prefrontal cortex; SFG: superior frontal gyrus; mPFC: medial prefrontal cortex; IPC: Inferior parietal cortex.
Figure 3.
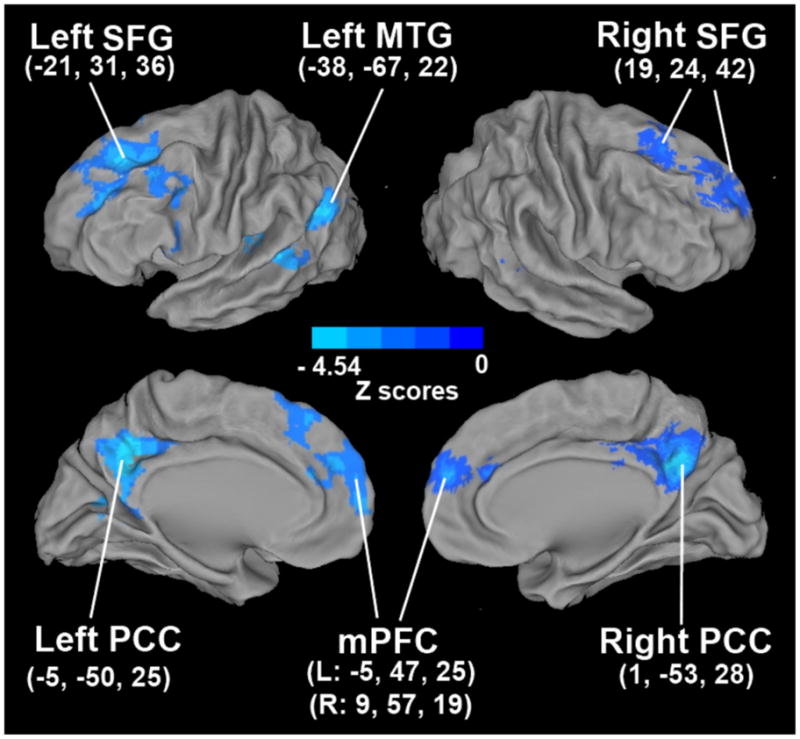
Functional correlates of the interactive effects of memory deficits and depressive symptoms on the hippocampal functional network.
Footnote: Abbreviations: SFG: superior frontal gyrus; MTG: middle temporal gyrus; PCC: posterior cingulate cortex; mPFC: medial prefrontal cortex.
4. Discussion
This is the first study to demonstrate distinct hippocampal functional networks that were associated with memory deficits and depressive symptoms in a cohort of nondemented older adults. Furthermore, we found significant interactive effects of depressive symptoms and memory deficits on the hippocampal functional connectivity in certain anterior and posterior default mode network and temporal lobe structures.
4.1. Relationship between hippocampal network connectivity and memory performance
After controlling for age, GDS scores and specific subject group effects, we found that positively correlated and anticorrelated hippocampal functional networks were significantly associated with memory performance and cognitive impairment. HFC strengths (m values) have positive (positive cross-correlation value of positively correlated network) and negative (negative cross-correlation value of anticorrelated network) signs. Better memory performance (or higher RAVLT-DR scores) was associated with higher positive m values, and stronger anticorrelation strength (more negative m value). The hippocampus plays a prominent role in the default mode system [24] and our results support previous findings that the DMN is organized through correlated and anticorrelated functional networks [19]. A decrease in the correlated and anticorrelated hippocampal functional networks with poorer memory performance, as seen in this study, is consistent with the literature. Previously, disruptions in the positive and negative hippocampal functional connectivity with several frontal, parietal and DMN structures have been reported in subjects with aMCI and AD [5, 47, 52, 60]. Our results further support a distinct role of this network in memory dysfunction, among nondemented older adults.
4.2. Relationship between hippocampal network connectivity and depressive symptom severity
In this study, the greater degree of depressive symptoms was associated with increased HFC strength in the positively correlated hippocampal network in the thalamus, frontal and posterior cingulate regions after adjusting for potential confounders. We have confirmed the previous observations of persistently increased resting-state functional connectivity in individuals with depressive symptoms [30, 49]. A recent study in LLD showed greater caudate functional connectivity to several frontal, parietal, temporal and limbic regions [30]. An increase in the dorsal nexus connectivity to various prefrontal and cingulate cortices was seen in depressed subjects [49]. Another recent study found an increase in cerebral glucose metabolism in the anterior and posterior cortical structures in LLD and the elevated regional cerebral metabolism positively correlated with the depressive symptom severity [51]. Further, stimulus-induced hyperactivity in the hippocampus and other DMN regions was previously reported in depression [50]. Interestingly, these DMN structures show decreased activity during goal-directed behaviors in normal individuals. Our findings also support the theory that the DMN is abnormally hyperactive in older adults with depressive symptoms. The pattern of amyloid plaque deposition seen in depressed aMCI patients is similar to that found in AD [14] and greater density of plaques and tangles within the hippocampus is found in depressed AD patients [44]. It is plausible that the depressive symptoms-related increased hippocampal functional connectivity seen in our study may be related to the AD neuropathology.
4.3. Interactive effects of depressive symptoms and memory performance on the hippocampal functional connectivity network
Our findings of significant RAVLT-GDS interactions within the HFC networks in the frontal (medial prefrontal and SFG bilaterally), temporal (left MTG) and the posterior DMN (bilateral PCC) regions after adjusting for potential confounding variables (age and subject groups) provide important clues as to how to explore the pathophysiological mechanisms that link depression and cognitive decline. Interestingly, these brain structures where depressive symptoms and memory deficits interact are implicated in both cognitive and mood disorders in the elderly. Previously, diminished hippocampal connectivity with the DMN regions, including the frontal and posterior cingulate cortices, has been reported in older persons with aMCI and mild AD [5, 9, 24, 52, 60], and reduced HFC-MTG connectivity is found in mild AD [5, 58]. In contrast, late-life depression is associated with enhanced resting-state functional connectivity and elevated cerebral glucose metabolism within the DMN and temporal lobe regions [30, 49]. To our knowledge, this is the first study that has demonstrated an interactive effect of memory performance and depressive symptoms on the functional neural network level.
These findings are intriguing because longitudinal studies have shown that aMCI and late-life depression separately are associated with increased future risk of developing AD [22, 41, 42, 54]. Furthermore, prevalence of comorbid depression and aMCI is common and ranges between 25% and 50% in community-based studies [1, 33]. Despite this, LLD studies often exclude individuals with cognitive impairment and vice versa [54]. This is of concern because there is ongoing debate whether depressive symptoms in the elderly is a cause or a consequence of pathological cognitive decline. A rigorously conducted meta- analytic study has suggested that a history of depression independently increases the risk of developing AD by approximately twofold, supporting a causal factor hypothesis [41]. In contrast, as the neurodegenerative changes seen in AD precede the clinical diagnosis by several years, depressive symptoms may be the earliest noncognitive manifestation of this neurodegenerative disease, supporting a reverse causality hypothesis [2, 54]. Moreover, elderly depressed patients who have persisting cognitive impairment after effective treatment of depression are at higher risk for conversion to dementia during follow-up [2, 55]. Similarly, the presence of depressive symptoms in patients with aMCI increases the future risk of developing AD relative to nondepressed aMCI subjects, although these findings are not universal [8, 40]. Our results suggest that these two commonly occurring behavioral phenotypes in elderly persons are competitively interactive, and this effect seems to be mediated through the hippocampal functional connections with MTG, and commonly described DMN structures.
Various pathophysiological mechanisms have been proposed to explain the link between depression and pathological cognitive decline. First, patients with coexisting geriatric depression and aMCI were found to have cortical amyloid accumulation comparable to AD, providing additional support to the theory that late-life depression may be the prodromal manifestation of AD, especially in individuals who present with coexisting aMCI [14]. In addition, AD subjects with depression had hypoperfusion in the frontal lobe and greater neurofibrillary tangle burden in the frontal, parietal, hippocampus and other temporal cortices when compared with AD patients without depression [35, 44]. Therefore, the presence of depressive symptoms in aMCI may be indicative of AD neuropathological changes occurring in the DMN and temporal lobe structures, and may be suggestive of a prodromal phase of AD [8, 40]. Furthermore, the frontal and temporal cortices and PCC are primary sites that are affected the earliest by amyloid plaques long before the manifestation of clinical symptoms [12]. Roughly one-quarter of cognitively healthy elderly persons show higher amyloid deposition in the frontal and temporal cortices, and the PCC/precuneus regions, which also correlate with future cognitive decline [45, 57]. Individuals with aMCI show greater neocortical amyloid deposition than normal subjects, and the increased amyloid plaque burden correlates with episodic memory impairment [43]. Therefore, the existence of an interactive effect between depressive symptoms and memory deficits in these regions is likely reflective of the effects of the underlying AD neuropathology.
Second, cognitively normal older adults who develop depression are found to have an increased risk for subsequent MCI. Interestingly, a synergistic interaction between apolipoprotein E genotype and depressive symptoms was observed in that study [23]. Finally, vascular disease that can accelerate cognitive decline in the elderly is also associated with cognitive dysfunction in geriatric depression [4, 56]. A recent diffusion tensor imaging study in LLD showed lower fractional anisotropy in multiple frontal and limbic regions, including the white matter adjacent to the hippocampus, PCC and select frontal and temporal regions [3]. There are also emerging findings showing that the presence of white matter abnormalities in older adults with depression is associated with worse cognitive outcomes and subsequent development of dementia [56]. The relationship between disruptions in the white matter integrity and altered hippocampal functional networks in the context of cognitive impairment and depression needs to be investigated.
Late-life depressive symptoms may also result in structural and functional changes within the DMN regions, and subsequently cause memory deficits. In this scenario, late-life depressive symptoms may be viewed as a risk factor for dementia [41, 54]. Therefore, if an interactive mechanism between depressive symptoms and memory deficits on a neural network level, as found in this study, is present, it may indicate an increased future risk of dementia in the elderly population.
The majority of the R-fMRI studies in normal and diseased states including ours averaged the time courses across the scan duration (about 6–8 min), assuming that the BOLD signal is dynamically stable over time. However, similar to task-based fMRI studies, dynamic variability in time and frequency across the course of a single scan was recently demonstrated in the DMN, suggesting the resting-state networks may not be temporally static [15]. Interestingly, the dynamic variability that is found in the DMN is stronger after executing a task, suggesting that the temporal variance that is observed may be a residual carryover effect of the cognitive activity during the task performance [26]. Furthermore, changes in the mood states during scanning are also shown to modulate the FC of resting-state networks in healthy subjects [29]. Regardless, future studies should address the stability and repeatability of the resting-state FC over time scanned at different time intervals (i.e., at day or night, before or after meals or tasks).
This study is not without limitations. A comprehensive clinical diagnosis of depression was not conducted. This is a cross-sectional study and future longitudinal studies that are carefully designed are essential to examine the stability of our findings and to determine the distinct and interactive effects of memory deficits and depressive symptoms on the HFC changes over time, in older adults in whom these behavioral phenotypes coexist. Our aim in this preliminary study was to examine the distinct and interactive effects of depressive symptoms and memory deficits on the memory-associated functional brain network pattern, in a cohort of nondemented older adults. Our findings further emphasize the need to pay close attention to the coexistence of cognitive deficits and depressive symptoms and their relationships to neuronal network alterations when conducting functional imaging studies in neurodegenerative and late-life mood disorders. In addition, future functional imaging studies should assess the neurophysiological mechanisms involved in clinically diagnosed depression in the context of cognitive impairment, and the latter in the context of depression [54]. Finally, our data analysis is limited to the HFC network, because our study was hypothesis driven. Conceivably, other neural networks may also be involved in linking memory deficits and depressive symptoms. A distributed, large-scale, whole-brain, network data-driven approach may be appropriate for this purpose.
5. Conclusions
Our results indicate that distinct hippocampal functional networks are related to memory deficits and depressive symptoms in nondemented older adults. This is the first study to show an interactive effect of two behavioral phenotypes (depressive symptoms and memory deficits) on the memory-associated networks in elderly persons without dementia. R-fMRI has significant advantages over task-driven fMRI in investigating the different neural networks involved in disorders such as aMCI and geriatric depression where cognitive deficits and depressive symptoms often coexist.
Acknowledgments
Dr. Shi-Jiang Li had full access to all of the data in the study and takes responsibility for the integrity of the data and the accuracy of the data analysis. Drs. Goveas and Xie, and the other coauthors had full access to all the data in the study. The authors thank Ms. Carrie O’Connor for editorial assistance, Mr. Douglas Ward for statistical analysis help and Ms. Judi Zaferos-Pylant and Mr. Yu Liu for MRI technical support.
This work was supported by National Institutes of Health grants: R01 AG20279 (Dr. Shi-Jiang Li), NIH-NCRR CTSA program grant 1UL1RR031973 (Dr. Shi-Jiang Li) the DANA Foundation, Pfizer Inc., and the Extendicare Foundation (Dr. Shi-Jiang Li).
Footnotes
Financial of conflict interest: No authors of this paper have reported any possible conflict of interests.
Publisher's Disclaimer: This is a PDF file of an unedited manuscript that has been accepted for publication. As a service to our customers we are providing this early version of the manuscript. The manuscript will undergo copyediting, typesetting, and review of the resulting proof before it is published in its final citable form. Please note that during the production process errors may be discovered which could affect the content, and all legal disclaimers that apply to the journal pertain.
References
- 1.Adler G, Chwalek K, Jajcevic A. Six-month course of mild cognitive impairment and affective symptoms in late-life depression. Eur Psychiatry. 2004;19(8):502–5. doi: 10.1016/j.eurpsy.2004.09.003. [DOI] [PubMed] [Google Scholar]
- 2.Alexopoulos GS, Meyers BS, Young RC, Mattis S, Kakuma T. The course of geriatric depression with “reversible dementia”: a controlled study. Am J Psychiatry. 1993;150(11):1693–9. doi: 10.1176/ajp.150.11.1693. [DOI] [PubMed] [Google Scholar]
- 3.Alexopoulos GS, Murphy CF, Gunning-Dixon FM, Latoussakis V, Kanellopoulos D, Klimstra S, Lim KO, Hoptman MJ. Microstructural white matter abnormalities and remission of geriatric depression. Am J Psychiatry. 2008;165(2):238–44. doi: 10.1176/appi.ajp.2007.07050744. [DOI] [PubMed] [Google Scholar]
- 4.Alexopoulos GS. Clinical and biological interactions in affective and cognitive geriatric syndromes. Am J Psychiatry. 2003;160(5):811–4. doi: 10.1176/appi.ajp.160.5.811. [DOI] [PubMed] [Google Scholar]
- 5.Allen G, Barnard H, McColl R, Hester AL, Fields JA, Weiner MF, Ringe WK, Lipton AM, Brooker M, McDonald E, Rubin CD, Cullum CM. Reduced hippocampal functional connectivity in Alzheimer disease. Arch Neurol. 2007;64(10):1482–7. doi: 10.1001/archneur.64.10.1482. [DOI] [PubMed] [Google Scholar]
- 6.Andreescu C, Butters MA, Begley A, Rajji T, Wu M, Meltzer CC, Reynolds CF, 3rd, Aizenstein H. Gray matter changes in late life depression--a structural MRI analysis. Neuropsychopharmacology. 2008;33(11):2566–72. doi: 10.1038/sj.npp.1301655. [DOI] [PMC free article] [PubMed] [Google Scholar]
- 7.Andrews-Hanna JR, Snyder AZ, Vincent JL, Lustig C, Head D, Raichle ME, Buckner RL. Disruption of large-scale brain systems in advanced aging. Neuron. 2007;56(5):924–35. doi: 10.1016/j.neuron.2007.10.038. [DOI] [PMC free article] [PubMed] [Google Scholar]
- 8.Apostolova LG, Cummings JL. Neuropsychiatric manifestations in mild cognitive impairment: a systematic review of the literature. Dement Geriatr Cogn Disord. 2008;25(2):115–26. doi: 10.1159/000112509. [DOI] [PubMed] [Google Scholar]
- 9.Bai F, Watson DR, Yu H, Shi Y, Yuan Y, Zhang Z. Abnormal resting-state functional connectivity of posterior cingulate cortex in amnestic type mild cognitive impairment. Brain Res. 2009;1302:167–74. doi: 10.1016/j.brainres.2009.09.028. [DOI] [PubMed] [Google Scholar]
- 10.Bell-McGinty S, Butters MA, Meltzer CC, Greer PJ, Reynolds CF, 3rd, Becker JT. Brain morphometric abnormalities in geriatric depression: long-term neurobiological effects of illness duration. Am J Psychiatry. 2002;159(8):1424–7. doi: 10.1176/appi.ajp.159.8.1424. [DOI] [PubMed] [Google Scholar]
- 11.Biswal B, Yetkin FZ, Haughton VM, Hyde JS. Functional connectivity in the motor cortex of resting human brain using echo-planar MRI. Magn Reson Med. 1995;34(4):537–41. doi: 10.1002/mrm.1910340409. [DOI] [PubMed] [Google Scholar]
- 12.Buckner RL, Sepulcre J, Talukdar T, Krienen FM, Liu H, Hedden T, Andrews-Hanna JR, Sperling RA, Johnson KA. Cortical hubs revealed by intrinsic functional connectivity: mapping, assessment of stability, and relation to Alzheimer’s disease. J Neurosci. 2009;29(6):1860–73. doi: 10.1523/JNEUROSCI.5062-08.2009. [DOI] [PMC free article] [PubMed] [Google Scholar]
- 13.Buckner RL, Snyder AZ, Shannon BJ, LaRossa G, Sachs R, Fotenos AF, Sheline YI, Klunk WE, Mathis CA, Morris JC, Mintun MA. Molecular, structural, and functional characterization of Alzheimer’s disease: evidence for a relationship between default activity, amyloid, and memory. J Neurosci. 2005;25(34):7709–17. doi: 10.1523/JNEUROSCI.2177-05.2005. [DOI] [PMC free article] [PubMed] [Google Scholar]
- 14.Butters MA, Klunk WE, Mathis CA, Price JC, Ziolko SK, Hoge JA, Tsopelas ND, Lopresti BJ, Reynolds CF, 3rd, DeKosky ST, Meltzer CC. Imaging Alzheimer pathology in late-life depression with PET and Pittsburgh Compound-B. Alzheimer Dis Assoc Disord. 2008;22(3):261–8. doi: 10.1097/WAD.0b013e31816c92bf. [DOI] [PMC free article] [PubMed] [Google Scholar]
- 15.Chang C, Glover GH. Time-frequency dynamics of resting-state brain connectivity measured with fMRI. Neuroimage. 2010;50(1):81–98. doi: 10.1016/j.neuroimage.2009.12.011. [DOI] [PMC free article] [PubMed] [Google Scholar]
- 16.Cox RW. AFNI: software for analysis and visualization of functional magnetic resonance neuroimages. Comput Biomed Res. 1996;29(3):162–73. doi: 10.1006/cbmr.1996.0014. [DOI] [PubMed] [Google Scholar]
- 17.Devanand DP, Pradhaban G, Liu X, Khandji A, De Santi S, Segal S, Rusinek H, Pelton GH, Honig LS, Mayeux R, Stern Y, Tabert MH, de Leon MJ. Hippocampal and entorhinal atrophy in mild cognitive impairment: prediction of Alzheimer disease. Neurology. 2007;68(11):828–36. doi: 10.1212/01.wnl.0000256697.20968.d7. [DOI] [PubMed] [Google Scholar]
- 18.Dotson VM, Resnick SM, Zonderman AB. Differential association of concurrent, baseline, and average depressive symptoms with cognitive decline in older adults. Am J Geriatr Psychiatry. 2008;16(4):318–30. doi: 10.1097/JGP.0b013e3181662a9c. [DOI] [PMC free article] [PubMed] [Google Scholar]
- 19.Fox MD, Snyder AZ, Vincent JL, Corbetta M, Van Essen DC, Raichle ME. The human brain is intrinsically organized into dynamic, anticorrelated functional networks. Proc Natl Acad Sci U S A. 2005;102(27):9673–8. doi: 10.1073/pnas.0504136102. [DOI] [PMC free article] [PubMed] [Google Scholar]
- 20.Fox MD, Raichle ME. Spontaneous fluctuations in brain activity observed with functional magnetic resonance imaging. Nat Rev Neurosci. 2007;8(9):700–11. doi: 10.1038/nrn2201. [DOI] [PubMed] [Google Scholar]
- 21.Fox MD, Zhang D, Snyder AZ, Raichle ME. The global signal and observed anticorrelated resting state brain networks. J Neurophysiol. 2009;101(6):3270–83. doi: 10.1152/jn.90777.2008. [DOI] [PMC free article] [PubMed] [Google Scholar]
- 22.Gauthier S, Reisberg B, Zaudig M, Petersen RC, Ritchie K, Broich K, Belleville S, Brodaty H, Bennett D, Chertkow H, Cummings JL, de Leon M, Feldman H, Ganguli M, Hampel H, Scheltens P, Tierney MC, Whitehouse P, Winblad B. Mild cognitive impairment. Lancet. 2006;367(9518):1262–70. doi: 10.1016/S0140-6736(06)68542-5. [DOI] [PubMed] [Google Scholar]
- 23.Geda YE, Knopman DS, Mrazek DA, Jicha GA, Smith GE, Negash S, Boeve BF, Ivnik RJ, Petersen RC, Pankratz VS, Rocca WA. Depression, apolipoprotein E genotype, and the incidence of mild cognitive impairment: a prospective cohort study. Arch Neurol. 2006;63(3):435–40. doi: 10.1001/archneur.63.3.435. [DOI] [PubMed] [Google Scholar]
- 24.Greicius MD, Srivastava G, Reiss AL, Menon V. Default-mode network activity distinguishes Alzheimer’s disease from healthy aging: evidence from functional MRI. Proc Natl Acad Sci U S A. 2004;101(13):4637–42. doi: 10.1073/pnas.0308627101. [DOI] [PMC free article] [PubMed] [Google Scholar]
- 25.Greicius MD, Supekar K, Menon V, Dougherty RF. Resting-state functional connectivity reflects structural connectivity in the default mode network. Cereb Cortex. 2009;19(1):72–8. doi: 10.1093/cercor/bhn059. [DOI] [PMC free article] [PubMed] [Google Scholar]
- 26.Grigg O, Grady CL. Task-related effects on the temporal and spatial dynamics of resting-state functional connectivity in the default network. PLoS One. 2010;5(10):e13311. doi: 10.1371/journal.pone.0013311. [DOI] [PMC free article] [PubMed] [Google Scholar]
- 27.Grubbs F. Procedures for Detecting Outlying Observations in Samples. Technometrics. 1969;11(1):1–21. [Google Scholar]
- 28.Hagmann P, Cammoun L, Gigandet X, Meuli R, Honey CJ, Wedeen VJ, Sporns O. Mapping the structural core of human cerebral cortex. PLoS Biol. 2008;6(7):e159. doi: 10.1371/journal.pbio.0060159. [DOI] [PMC free article] [PubMed] [Google Scholar]
- 29.Harrison BJ, Pujol J, Ortiz H, Fornito A, Pantelis C, Yucel M. Modulation of brain resting-state networks by sad mood induction. PLoS One. 2008;3(3):e1794. doi: 10.1371/journal.pone.0001794. [DOI] [PMC free article] [PubMed] [Google Scholar]
- 30.Kenny ER, O’Brien JT, Cousins DA, Richardson J, Thomas AJ, Firbank MJ, Blamire AM. Functional connectivity in late-life depression using resting-state functional magnetic resonance imaging. Am J Geriatr Psychiatry. 2010;18(7):643–51. doi: 10.1097/JGP.0b013e3181cabd0e. [DOI] [PubMed] [Google Scholar]
- 31.LaBar KS, Cabeza R. Cognitive neuroscience of emotional memory. Nat Rev Neurosci. 2006;7(1):54–64. doi: 10.1038/nrn1825. [DOI] [PubMed] [Google Scholar]
- 32.Lee BC, Mintun M, Buckner RL, Morris JC. Imaging of Alzheimer’s disease. J Neuroimaging. 2003;13(3):199–214. [PubMed] [Google Scholar]
- 33.Lee JS, Potter GG, Wagner HR, Welsh-Bohmer KA, Steffens DC. Persistent mild cognitive impairment in geriatric depression. Int Psychogeriatr. 2007;19(1):125–35. doi: 10.1017/S1041610206003607. [DOI] [PubMed] [Google Scholar]
- 34.Leung KK, Barnes J, Ridgway GR, Bartlett JW, Clarkson MJ, Macdonald K, Schuff N, Fox NC, Ourselin S. Automated cross-sectional and longitudinal hippocampal volume measurement in mild cognitive impairment and Alzheimer’s disease. Neuroimage. 2010;51(4):1345–59. doi: 10.1016/j.neuroimage.2010.03.018. [DOI] [PMC free article] [PubMed] [Google Scholar]
- 35.Levy-Cooperman N, Burhan AM, Rafi-Tari S, Kusano M, Ramirez J, Caldwell C, Black SE. Frontal lobe hypoperfusion and depressive symptoms in Alzheimer disease. J Psychiatry Neurosci. 2008;33(3):218–26. [PMC free article] [PubMed] [Google Scholar]
- 36.Li SJ, Li Z, Wu G, Zhang MJ, Franczak M, Antuono PG. Alzheimer Disease: evaluation of a functional MR imaging index as a marker. Radiology. 2002;225(1):253–9. doi: 10.1148/radiol.2251011301. [DOI] [PubMed] [Google Scholar]
- 37.Machulda MM, Ward HA, Borowski B, Gunter JL, Cha RH, O’Brien PC, Petersen RC, Boeve BF, Knopman D, Tang-Wai DF, Ivnik RJ, Smith GE, Tangalos EG, Jack CR., Jr Comparison of memory fMRI response among normal, MCI, and Alzheimer’s patients. Neurology. 2003;61(4):500–6. doi: 10.1212/01.wnl.0000079052.01016.78. [DOI] [PMC free article] [PubMed] [Google Scholar]
- 38.Mehta KM, Yaffe K, Langa KM, Sands L, Whooley MA, Covinsky KE. Additive effects of cognitive function and depressive symptoms on mortality in elderly community-living adults. J Gerontol A Biol Sci Med Sci. 2003;58(5):M461–7. doi: 10.1093/gerona/58.5.m461. [DOI] [PMC free article] [PubMed] [Google Scholar]
- 39.Miller SL, Fenstermacher E, Bates J, Blacker D, Sperling RA, Dickerson BC. Hippocampal activation in adults with mild cognitive impairment predicts subsequent cognitive decline. J Neurol Neurosurg Psychiatry. 2008;79(6):630–5. doi: 10.1136/jnnp.2007.124149. [DOI] [PMC free article] [PubMed] [Google Scholar]
- 40.Modrego PJ, Ferrandez J. Depression in patients with mild cognitive impairment increases the risk of developing dementia of Alzheimer type: a prospective cohort study. Arch Neurol. 2004;61(8):1290–3. doi: 10.1001/archneur.61.8.1290. [DOI] [PubMed] [Google Scholar]
- 41.Ownby RL, Crocco E, Acevedo A, John V, Loewenstein D. Depression and risk for Alzheimer disease: systematic review, meta-analysis, and metaregression analysis. Arch Gen Psychiatry. 2006;63(5):530–8. doi: 10.1001/archpsyc.63.5.530. [DOI] [PMC free article] [PubMed] [Google Scholar]
- 42.Petersen RC, Smith GE, Waring SC, Ivnik RJ, Tangalos EG, Kokmen E. Mild cognitive impairment: clinical characterization and outcome. Arch Neurol. 1999;56(3):303–8. doi: 10.1001/archneur.56.3.303. [DOI] [PubMed] [Google Scholar]
- 43.Pike KE, Savage G, Villemagne VL, Ng S, Moss SA, Maruff P, Mathis CA, Klunk WE, Masters CL, Rowe CC. Beta-amyloid imaging and memory in non-demented individuals: evidence for preclinical Alzheimer’s disease. Brain. 2007;130(Pt 11):2837–44. doi: 10.1093/brain/awm238. [DOI] [PubMed] [Google Scholar]
- 44.Rapp MA, Schnaider-Beeri M, Grossman HT, Sano M, Perl DP, Purohit DP, Gorman JM, Haroutunian V. Increased hippocampal plaques and tangles in patients with Alzheimer disease with a lifetime history of major depression. Arch Gen Psychiatry. 2006;63(2):161–7. doi: 10.1001/archpsyc.63.2.161. [DOI] [PubMed] [Google Scholar]
- 45.Resnick SM, Sojkova J, Zhou Y, An Y, Ye W, Holt DP, Dannals RF, Mathis CA, Klunk WE, Ferrucci L, Kraut MA, Wong DF. Longitudinal cognitive decline is associated with fibrillar amyloid-beta measured by [C-11]PiB. Neurology. 2010;74(10):807–15. doi: 10.1212/WNL.0b013e3181d3e3e9. [DOI] [PMC free article] [PubMed] [Google Scholar]
- 46.Rombouts SA, Stam CJ, Kuijer JP, Scheltens P, Barkhof F. Identifying confounds to increase specificity during a “no task condition”. Evidence for hippocampal connectivity using fMRI. Neuroimage. 2003;20(2):1236–45. doi: 10.1016/S1053-8119(03)00386-0. [DOI] [PubMed] [Google Scholar]
- 47.Rombouts SA, Barkhof F, Goekoop R, Stam CJ, Scheltens P. Altered resting state networks in mild cognitive impairment and mild Alzheimer’s disease: an fMRI study. Hum Brain Mapp. 2005;26(4):231–9. doi: 10.1002/hbm.20160. [DOI] [PMC free article] [PubMed] [Google Scholar]
- 48.Seeley WW, Menon V, Schatzberg AF, Keller J, Glover GH, Kenna H, Reiss AL, Greicius MD. Dissociable intrinsic connectivity networks for salience processing and executive control. J Neurosci. 2007;27(9):2349–56. doi: 10.1523/JNEUROSCI.5587-06.2007. [DOI] [PMC free article] [PubMed] [Google Scholar]
- 49.Sheline YI, Price JL, Yan ZZ, Mintun MA. Resting-state functional MRI in depression unmasks increased connectivity between networks via the dorsal nexus. Proc Natl Acad Sci U S A. 2010;107(24):11020–5. doi: 10.1073/pnas.1000446107. [DOI] [PMC free article] [PubMed] [Google Scholar]
- 50.Sheline YI, Barch DM, Price JL, Rundle MM, Vaishnavi SN, Snyder AZ, Mintun MA, Wang S, Coalson RS, Raichle ME. The default mode network and self-referential processes in depression. Proc Natl Acad Sci U S A. 2009;106(6):1942–7. doi: 10.1073/pnas.0812686106. [DOI] [PMC free article] [PubMed] [Google Scholar]
- 51.Smith GS, Kramer E, Ma Y, Kingsley P, Dhawan V, Chaly T, Eidelberg D. The functional neuroanatomy of geriatric depression. Int J Geriatr Psychiatry. 2009;24(8):798–808. doi: 10.1002/gps.2185. [DOI] [PMC free article] [PubMed] [Google Scholar]
- 52.Sorg C, Riedl V, Muhlau M, Calhoun VD, Eichele T, Laer L, Drzezga A, Forstl H, Kurz A, Zimmer C, Wohlschlager AM. Selective changes of resting-state networks in individuals at risk for Alzheimer’s disease. Proc Natl Acad Sci U S A. 2007;104(47):18760–5. doi: 10.1073/pnas.0708803104. [DOI] [PMC free article] [PubMed] [Google Scholar]
- 53.Steffens DC, Byrum CE, McQuoid DR, Greenberg DL, Payne ME, Blitchington TF, MacFall JR, Krishnan KR. Hippocampal volume in geriatric depression. Biol Psychiatry. 2000;48(4):301–9. doi: 10.1016/s0006-3223(00)00829-5. [DOI] [PubMed] [Google Scholar]
- 54.Steffens DC, Otey E, Alexopoulos GS, Butters MA, Cuthbert B, Ganguli M, Geda YE, Hendrie HC, Krishnan RR, Kumar A, Lopez OL, Lyketsos CG, Mast BT, Morris JC, Norton MC, Peavy GM, Petersen RC, Reynolds CF, Salloway S, Welsh-Bohmer KA, Yesavage J. Perspectives on depression, mild cognitive impairment, and cognitive decline. Arch Gen Psychiatry. 2006;63(2):130–8. doi: 10.1001/archpsyc.63.2.130. [DOI] [PubMed] [Google Scholar]
- 55.Steffens DC, Welsh-Bohmer KA, Burke JR, Plassman BL, Beyer JL, Gersing KR, Potter GG. Methodology and preliminary results from the neurocognitive outcomes of depression in the elderly study. J Geriatr Psychiatry Neurol. 2004;17(4):202–11. doi: 10.1177/0891988704269819. [DOI] [PubMed] [Google Scholar]
- 56.Steffens DC, Potter GG, McQuoid DR, MacFall JR, Payne ME, Burke JR, Plassman BL, Welsh-Bohmer KA. Longitudinal magnetic resonance imaging vascular changes, apolipoprotein E genotype, and development of dementia in the neurocognitive outcomes of depression in the elderly study. Am J Geriatr Psychiatry. 2007;15(10):839–49. doi: 10.1097/JGP.0b013e318048a1a0. [DOI] [PubMed] [Google Scholar]
- 57.Villemagne VL, Pike KE, Darby D, Maruff P, Savage G, Ng S, Ackermann U, Cowie TF, Currie J, Chan SG, Jones G, Tochon-Danguy H, O’Keefe G, Masters CL, Rowe CC. Abeta deposits in older non-demented individuals with cognitive decline are indicative of preclinical Alzheimer’s disease. Neuropsychologia. 2008;46(6):1688–97. doi: 10.1016/j.neuropsychologia.2008.02.008. [DOI] [PubMed] [Google Scholar]
- 58.Wang K, Liang M, Wang L, Tian L, Zhang X, Li K, Jiang T. Altered functional connectivity in early Alzheimer’s disease: a resting-state fMRI study. Hum Brain Mapp. 2007;28(10):967–78. doi: 10.1002/hbm.20324. [DOI] [PMC free article] [PubMed] [Google Scholar]
- 59.Wang L, Krishnan KR, Steffens DC, Potter GG, Dolcos F, McCarthy G. Depressive state- and disease-related alterations in neural responses to affective and executive challenges in geriatric depression. Am J Psychiatry. 2008;165(7):863–71. doi: 10.1176/appi.ajp.2008.07101590. [DOI] [PubMed] [Google Scholar]
- 60.Wang L, Zang Y, He Y, Liang M, Zhang X, Tian L, Wu T, Jiang T, Li K. Changes in hippocampal connectivity in the early stages of Alzheimer’s disease: evidence from resting state fMRI. Neuroimage. 2006;31(2):496–504. doi: 10.1016/j.neuroimage.2005.12.033. [DOI] [PubMed] [Google Scholar]
- 61.Winblad B, Palmer K, Kivipelto M, Jelic V, Fratiglioni L, Wahlund LO, Nordberg A, Backman L, Albert M, Almkvist O, Arai H, Basun H, Blennow K, de Leon M, DeCarli C, Erkinjuntti T, Giacobini E, Graff C, Hardy J, Jack C, Jorm A, Ritchie K, van Duijn C, Visser P, Petersen RC. Mild cognitive impairment--beyond controversies, towards a consensus: report of the International Working Group on Mild Cognitive Impairment. J Intern Med. 2004;256(3):240–6. doi: 10.1111/j.1365-2796.2004.01380.x. [DOI] [PubMed] [Google Scholar]
- 62.Xu G, Antuono PG, Jones J, Xu Y, Wu G, Ward D, Li SJ. Perfusion fMRI detects deficits in regional CBF during memory-encoding tasks in MCI subjects. Neurology. 2007;69(17):1650–6. doi: 10.1212/01.wnl.0000296941.06685.22. [DOI] [PubMed] [Google Scholar]
- 63.Xu Y, Xu G, Wu G, Antuono P, Rowe DB, Li SJ. The phase shift index for marking functional asynchrony in Alzheimer’s disease patients using fMRI. Magn Reson Imaging. 2008;26(3):379–92. doi: 10.1016/j.mri.2007.07.007. [DOI] [PMC free article] [PubMed] [Google Scholar]
- 64.Zar J. Biostatistical analysis. 3. Upper Saddle River, NJ: Prentice-Hall, Inc; 1996. p. 662. [Google Scholar]