Abstract
Functional studies have shown that the sphingolipid, ceramide self-assembles in phospholipid membranes to form large channels capable of allowing proteins to cross the membrane. Here these channels are visualized by negative stain transmission electron microscopy. The images contain features consistent with stain-filled pores having a roughly circular profile. There is no indication of tilt and the results are consistent with the formation of right cylinders. The sizes of the pores range from 5 to 40 nm in diameter with an asymmetric distribution indicating no apparent upper size limit. The size distribution matches well with the distribution of sizes calculated from electrophysiological measurements.
Keywords: channel, negative-stain, pore, ceramide, sphingolipid, apoptosis
1. Introduction
Apoptosis, a form of programmed cell death, is a mechanism by which unwanted cells are removed from the body in a regulated manner. Apoptosis may be initiated through either the cell surface receptor ligation pathway (extrinsic) or the mitochondria-dependent pathway (intrinsic) [1]. Induced by apoptotic stimuli, like UV irradiation and TNF-α, the outer membrane of mitochondria becomes permeable to intermembrane-space proteins like cytochrome c and Smac/DIABLO and these are released into the cytosol [1]. This release is an irreversible step of the cell death process and starts the execution phase of apoptosis. The identity of the channel responsible for this release is a subject of much research. A strong candidate is a channel formed by the sphingolipid, ceramide [2].
The role of sphingolipids in apoptosis has been recognized for some time, especially the pro-apoptotic role of ceramide [3]. In addition to its important roles in the cell stress response and cell senescence, ceramide is generally considered to be a second messenger in apoptosis [3]. In addition, it has been shown to have the ability to form channels in the mitochondrial outer membrane large enough to release the proteins responsible for initiating the downstream events [4], the execution phase of apoptosis. Elevated levels of ceramide that are found in mitochondria at the onset of apoptosis [5–10] are sufficient to produce this permeabilization [11]. Anti-apoptotic proteins inhibit ceramide channel formation [12] and pro-apoptotic proteins enhance it [13]. Thus ceramide channels are good candidates for the mitochondrial protein release pathway.
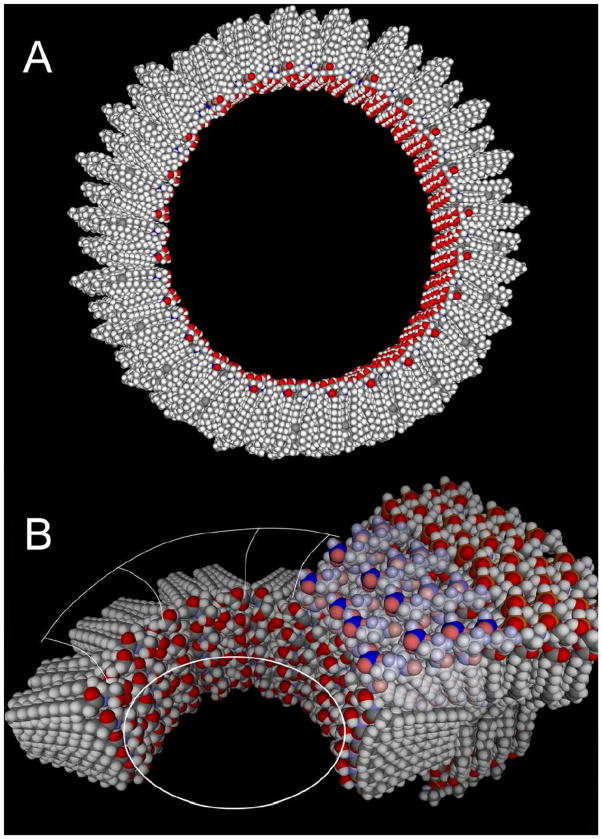
A great deal has been published on the functional nature of the ceramide channel [4, 11–15]. All information on the structure of the channel is derived from functional studies and supported by molecular dynamic simulations [16]. In the working model (Fig. 1), ceramide forms a barrel-stave channel [15–16] composed of columns/staves formed by stacking sufficient ceramide molecules to span the hydrophobic part of the membrane. These are held together by hydrogen-bonding of ceramide’s amide linkage. The columns are arranged in an anti parallel fashion to form the barrel with the hydroxyl groups forming the channel’s inner lining. The cylindrical barrel-stave nature of the channel is strongly supported by the observation that the channel preferentially disassembles in multiples of a conducting unit of 4 nS [15]. However, direct structural information has been difficult to obtain because the channel is in dynamic equilibrium with monomers and non-channel-forming aggregates. Most of the ceramide present in the membrane is not forming the channel proper. Here we report the visualization of ceramide channels by negative stain transmission electron microscopy.
Fig. 1.
Model of the channel formed by C16-ceramide in membranes. A. The channel is slightly tilted to illustrate the columns that span the membrane, each consisting of 6 ceramide monomers. The pore is lined by hydroxyl groups. The hydrocarbon tails are oriented parallel to the plane of the membrane. The columns are arranged in an antiparallel fashion so that the carbonyl oxygen of the amide linkage (red) is only visible in every other column. The pore diameter of this 48-column channel is 10 nm. B. A model of a segment of a smaller ceramide channel showing how it might interface with the phospholipid membrane. Note the slightly hourglass shape of the pore and the distorted phospholipids (lighter colors) that cover the hydrocarbon chains of the ceramides at the end of the channel. The structure of this interface is an illustration of the results reported from molecular dynamic simulations [16].
2. Materials and methods
2.1 Materials
Asolectin (a polar extract of soybean phospholipids resembling the mitochondrial outer membrane phospholipids), diphytanoyl phosphatidylcholine (DPhPC), ceramides and the materials needed for liposome formation by extrusion were bought from Avanti Polar Lipids (Alabaster AL). Formvar and carbon coated, 200 mesh copper electron microscope grids were purchased from Electron Microscopy Sciences (Hatfield, PA). Dil C12, the membrane tagging dye was bought from BD Biosciences (San Jose, CA).
2.2 Preparation of liposomes
2.2.1 Liposomes were composed of asolectin
DPhPC: cholesterol in a 0.5:0.5:0.05 weight ratio. The lipids were mixed and dissolved in hexane, dried under nitrogen and placed under vacuum overnight. On occasion, the fluorescent marker DiL C12 was included at approximately a 1:50 molar ratio. The lipid was dispersed in 1 mL of 0.8M mannitol, 50mM NaCl, 10mM HEPES, 1mM EDTA, pH 7.2. The liposomes were sonicated and freeze thawed 4 times followed by extrusion through a 0.2 μm polycarbonate membrane for 17 passes. This last step generates single-walled liposomes.
2.2.2 Formation of ceramide channels in the liposomes
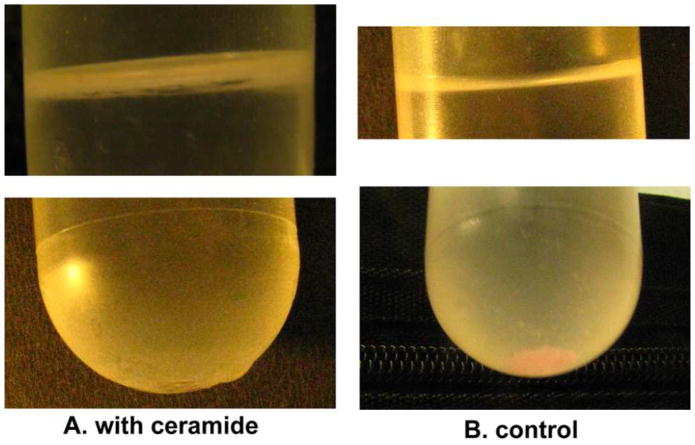
The extruded sample (1ml) was diluted to 10 ml with 0.60M Mannitol, 0.10M NaCl, 10mM HEPES, 1mM EDTA, pH 7.2. This buffer was carefully chosen because the osmolarity of the buffer equals that of the denser mannitol buffer inside the liposome. Four hundred microliters of 1mg/ml C16 ceramide in isopropanol or vehicle alone were added to the diluted liposome solution while vortexing. Dilution of the liposome sample was necessary to minimize the influence of the vehicle (isopropanol). Liposomes containing channels were separated from those lacking channels by centrifugation in a step gradient. The bottom layer, containing most of the volume, was the liposome suspension. The next layer was 1ml of 0.4M NaCl containing 10mM HEPES pH 7.2. The channel-containing liposomes were expected to collect at the interface between these solutions. Aggregated ceramide molecules (ceramide micelles) should float above the NaCl layer because their density (approximately equal to water) is less than that of both layers. To further separate the liposomes from the ceramide aggregates, 1 ml of water was layered on top of the NaCl layer. The tubes were spun in a swinging bucket rotor at an RCF=58000 at room temperature for 4 hours. In the tube containing the liposomes treated with ceramide, most of the liposomes were located at the mannitol/NaCl interface (Fig. 2A). The liposomes only treated with isopropanol (vehicle control) sedimented to the bottom of the centrifuge tube (Fig. 2B). Once removed from the gradient, the liposome suspension was concentrated further by placing it in a dialysis tube and adding polyvinyl pyrrolidone, with average molecular weight of 40,000, around the tube.
Fig. 2.
Separation of liposomes containing channels from liposomes without channels. Liposomes with channels floated to an upper interface (see Methods) (A top layer). Those lacking channels sedimented to the bottom of the tube (B bottom layer). The liposomes separated in the tube shown in (A) were treated with C16-ceramide. Those in the tube shown in (B) were treated with the vehicle, isopropanol. The membranes contained a fluorescent dye (Dil C12) and therefore appear pink.
2.3 Transmission electron microscopy
Carbon coated formvar grids were used for the study. The grid was floated on top of a drop of sample for fifteen minutes followed by floating on top of osmium tetroxide (2% aqueous solution) for ten minutes. Then it was floated on top of 1% aqueous uranyl acetate for 1 min and after air drying, it was observed under TEM. The electron microscopic analysis of the sample was performed with a ZEISS EM 10 CATEM at magnifications ranging from 25K–200K. The electron micrographs were 2D projections of the negatively-stained specimens. Approximately equal numbers of ceramide-treated and control liposomes, treated only with the vehicle, isopropanol, were observed. No channel-like structures were ever observed on the control liposomes whereas a total of over 80 channel-like structures were observed on the ceramide-treated liposomes over many separate experiments by two investigators working independently (JS and SS).
2.4 Image analysis
All image analysis was performed using Image J software (developed at NIH and freely available on line) at 8 bit resolution. Channel diameters were determined by doing a densitometric slice through the channel and measuring the distance at the inflection points. The channels were essentially circular and considering the wide variation in channel sizes, increased precision was considered to be unnecessary. Surface plots of ceramide channels embedded in liposomes were performed after inverting the image so that dark areas appear raised. This allowed better visualization of the channel and its comparison to the depth of stain accumulated around the vesicle. The resolution of the electron micrographs, as influenced by the degree of defocusing, was determined from the first zero of the phase contrast transfer function in the Fourier transform power spectrum of a background region of the micrograph and used without further correction.
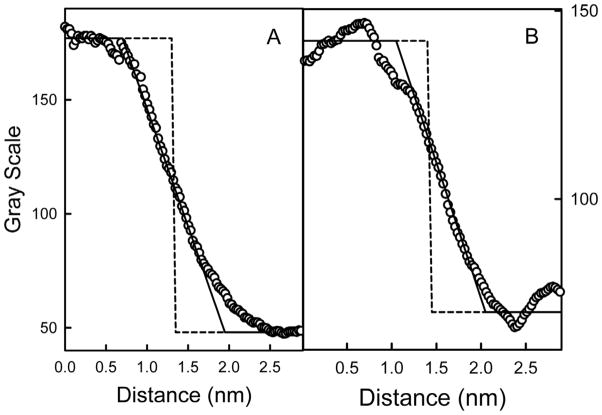
Although 3-D reconstructions were not attempted, the staining profile of the channels was examined to look for indications that the walls of the channels might be tilted. Density profiles of the edges of select channels were compared to that of a theoretical right-angled edge that was smoothed (low-pass filtered) by a moving average. To avoid sampling error, the density profile used for each channel was an average of 6 cross-sections at angles evenly spaced around the roughly circular stain density. For Fig. 6, the resolution limit (in nanometers) used for the moving average was determined from the first zero of the phase contrast transfer function of the respective image background. In addition, a random sampling of 15 micrographs was selected and, of these, 13 were of sufficient quality to be analyzed further. The smoothing procedure was performed with a variable moving average and the best fit was determined by a least-squares method. This value was found to compare well with the CTF resolution estimate.
Fig. 6.
Probing the shape of the pore. Two examples of pore edges are shown (circles) along with an ideal edge if the pore were a right cylinder (dashed line). The ideal edge was smoothened to an extent matching the measured resolution of the image (solid line): 1.25 nm for panel A and 1.0 nm for panel B.
2.5 Electrophysiological Recordings
The formation of ceramide channels was monitored by recording the current flowing through a planar phospholipid membrane made by the monolayer technique [17] as modified [18]. The lipids used to form the membrane were DPhPC, asolectin, cholesterol, 1:1:0.2 (w: w: w). Membranes were 0.05 to 0.1 mm in diameter. The voltage was clamped and the current recorded. The aqueous solution contained 100 mM KCl, 5mM MgCl2, 5mM PIPES (pH 6.9) for C2-ceramide and 1.0M KCl, 5mM MgCl2, 5mM PIPES (pH 6.9) for C16-ceramide. All the experiments were performed at room temperature (about 23°C). Ceramide was generally added to both sides of the membrane. C2-ceramide was dissolved in DMSO and C16-ceramide in isopropanol. Solutions of 0.1 or 1.0 mg/ml were used. Aliquots of 2 μL to 20 μL were stirred into 5 ml of aqueous buffer bathing the membrane. Multiple additions were often needed to achieve a substantial conductance. The dispersal of ceramide close to the membrane was essential to achieve a good conductance level with the long-chain ceramide.
3. Results and Discussion
3.1 Generation of liposomes containing channels
Single-walled phospholipid/cholesterol liposomes were formed by the extrusion technique. C16-ceramide dissolved in isopropanol was added while vortexing to form channels in the liposomes. The amount of isopropanol was kept below 4% to avoid disturbing the liposomal membranes. This technique was shown to form channels capable of permeabilizing the liposomes to carboxyfluorescein and the permeability could be influenced by agents that influence ceramide channels [19]. The liposomes with channels were separated from those without channels and from ceramide micelles by means of a density step gradient. This took advantage of the difference in permeability of the membranes of liposomes containing channels and thus also served as evidence of channel formation. In Fig. 2A, the top of the gradient reveals the ceramide-containing liposomes as cloudy layer just below the air-water interface. There is no visible pellet on the bottom of the tube. In Fig. 2B, the top of the gradient shows no visible liposomes whereas the bottom of the tube has an evident pink pellet of liposomes containing the tagging dye.
3.2 Visualization of channels by electron microscopy
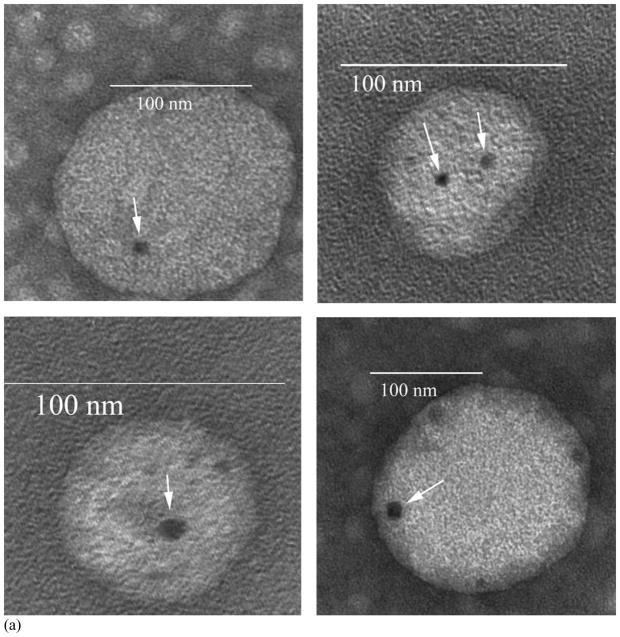
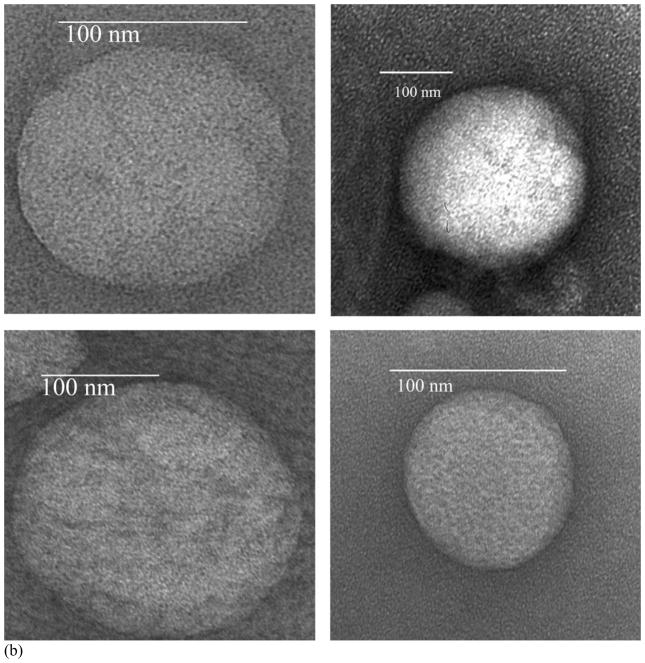
Both the isopropanol (vehicle control) and ceramide treated liposomes were fixed with osmium tetroxide and negatively-stained with uranyl acetate prior to observation by TEM. It is known that ceramide channels are in dynamic equilibrium with monomers or non-channel aggregates in the membrane [4–15] and thus osmium tetroxide was used as a mild fixative to stabilize the channels. The osmium tetroxide treatment alone produced little staining. The subsequent treatment with uranyl acetate visualized the channels. As a negative stain, uranyl acetate forms an amorphous, glassy layer that fills spaces, such as channel lumens, causing these to be electron opaque. Some of the ceramide-treated liposomes had black circular structures (Fig. 3A, arrows), interpreted as stain-filled cylindrical channels. Some fainter, channel like structures were sometimes seem (e.g. Fig. 3A lower left) in the periphery of treated liposomes. Prudence demanded that these not be counted as authentic channels. A total of over 80 channel-like structures were observed on the ceramide-treated liposomes over many separate experiments by two investigators working independently (JS and SS). A similar number of isopropanol treated liposomes (Fig. 3B) were observed as those treated with ceramide yet none of these control liposomes had the structures seen in the ceramide-treated liposomes, demonstrating that the channel-like structures were induced or produced by ceramide. Dihydroceramide-treated liposomes were indistinguishable from controls. This is expected because dihydroceramide does not form channels in mitochondria [11], planar membranes [14, 15] or liposomes [19].
Fig. 3.
Ceramide channels visualized by TEM. Some of the ceramide-treated liposomes contained black circular regions (A) whereas untreated liposomes (B) had no such regions. The black regions in (A), indicated by arrows, are interpreted as the 2-D projections of ceramide channels filled with negative stain (uranyl acetate).
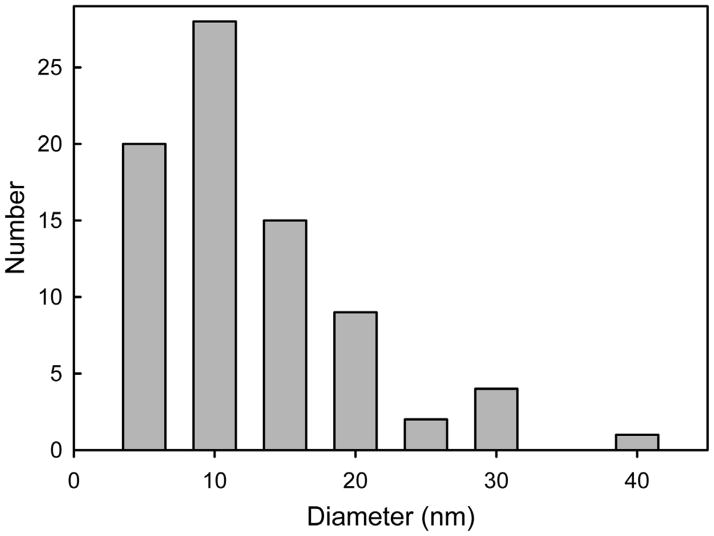
A histogram of the diameters of the circular channel-like structures shows a size range from 5–38 nm (Fig. 4). The resolution limit for negative staining is 1.5–2 nm [20] and thus these structures are well within the scope of the method. However, smaller channels may have been present and not detected because of the limitations of the method.
Fig. 4.
A histogram of ceramide channel diameters obtained from the electron micrographs.
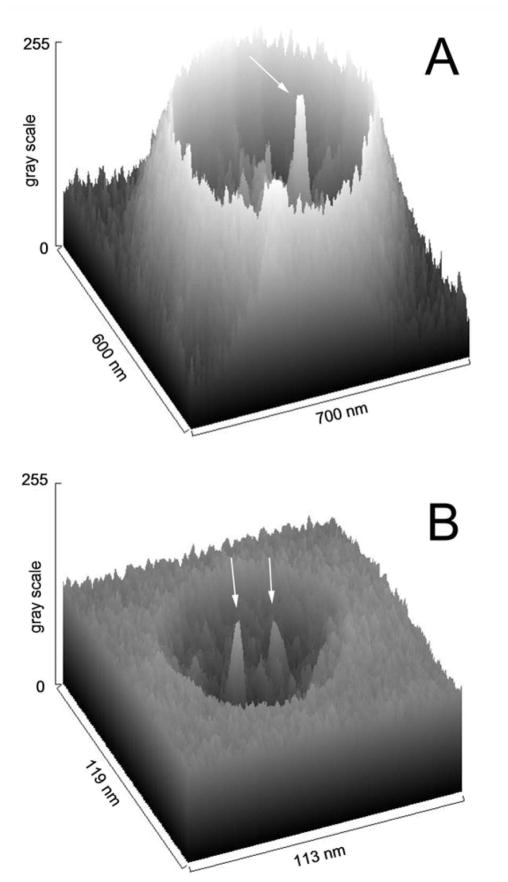
The amorphous, glassy nature of the negative stain allowed us to distinguish between a surface feature and a channel with depth. As the stain dries over and around the flattened liposome, the stain can accumulate at the edge and its thickness can decline with distance from the liposome in a roughly exponential fashion (Fig. 5A) or the vesicle can displace stain from a fairly even background (Fig. 5B). The gray scale of the scanned image has 8 bit resolution and represents the quantitation of the electron micrograph. The gray scale values should be proportional to the thickness of deposited stain because the heavy metals in the stain are the major electron scatterers and the greater the amount of stain the fewer electrons will hit the photographic negative. The major peaks within this outline of the vesicles in Fig. 5 are the stain-filled channels (indicated by arrows). The accumulation of stain within the channel results in a gray scale that is comparable with the accumulation of stain around the flattened vesicle showing that what we interpret as channels have significant depth and thus are unlikely to be minor surface indentations.
Fig. 5.
Surface plots of the stain density of electron micrographs of vesicles containing one (A) and two (B) channels. The gray scale was inverted so that the highest value has the darkest stain. Arrows indicate the location of the strain-filled channels.
The cross-sectional view of the stain density of the stain-filled channels is not rectangular but rhomboid in shape. This is expected because the image is blurred by the contrast transfer function of the microscope. However, one can ask whether the shape is within the limits expected for a cylindrical channel or perhaps indicates the formation of something other than a right cylinder. For instance, the channel might have tilted sides, forming a truncated cone. To look for evidence of a deviations from a right cylinder, we compared the density function of the cross-section at the edge of a channel to a theoretical right-angled edge that was smoothened (low-pass filtered) by a moving average. In the two examples shown in Fig. 6, the degree of smoothing was determined by the resolution estimate determined from the first zero of the phase contrast transfer function (CTF) of the Fourier transform power spectrum of a background region of the same electron micrograph from which the image was obtained (1.25 nm for panel A and 1.0 nm for panel B of Fig. 6). In these cases the agreement between experimental results and theoretical expectation is very good. Alternatively, smoothening of the theoretical right-angled edge was varied until it gave a best fit to the density profiles of channels in the micrographs and from these an apparent resolution was obtained that could be compared to that determined from the CTF of the background. This was done to a sampling of 13 micrographs. The average resolution from the curve fitting was 1.3 ± 0.3 and that from the CTF was 1.4 ± 0.3. The average of the differences was 0.12 nm, only 10% of the value of the resolutions. Thus, the observations are consistent with a channel forming a pore that is a right cylinder. However, because the thickness of liposome bilayers is about the same dimension as typical negative-stain grain size (approximately 5 nm), the actual 3D shape of the ceramide channels cannot be inferred from these types of analyses. High-resolution three-dimensional reconstruction of frozen-hydrated specimens will be needed to rigorously explore the shape of these channels.
3.3 Planar membrane experiments
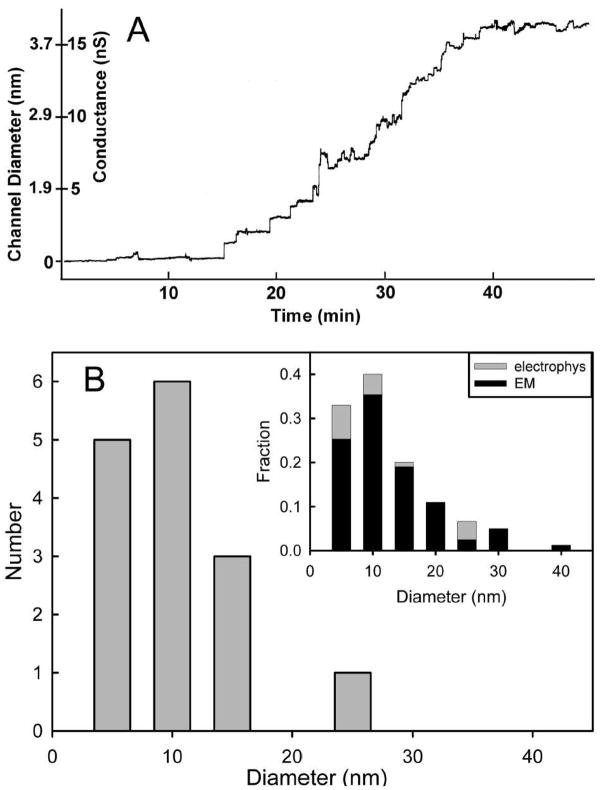
The planar membrane experiments are another way to measure the size of ceramide channels. These sizes can be compared to the sizes determined by TEM. Ceramide is known to form large and stable channels in planar membrane [14–15]. Addition of ceramide to phospholipid membranes results in conductance increments that culminate into a final steady-state conductance (Fig. 7A). In most cases this final conductance has been shown to be due to a single gargantuan channel [15]. Due to the large size of these channels one can calculate their diameter with high accuracy knowing the conductance of a cylinder of solution and the access resistance of the medium.
Fig. 7.
Sizes of ceramide channels measured from electrophysiological experiments. (A) A typical trace of conductance increments in a planar phospholipid bilayer following the addition of C16-ceramide to the aqueous compartment. This is the growth of a single ceramide channel [15]. The calculated channel diameter is also indicated on the y-axis. (B) Histogram of the calculated size of ceramide channels from many experiments such as the one illustrated in (A). In the inset, the number of events is expressed as a fraction of the total number of events and the results from electron microscopy (EM) and electrophysiological recordings (electrophys) are plotted together for comparison.
where d is the diameter of the pore, G is the measured conductance, ρ is the resistivity of the medium (8.94 Ohm-cm for 1.0 M KCl), L is the length of the channel (taken as 5 nm) and π has the usual value. The length of the channel was assumed to be 5 nm. Separate histograms of channel diameter sizes calculated from TEM and planar membrane experiment data (Fig. 4 & 7B respectively) show a virtually identical distribution. Both data sets were converted to fractions of the total number of observations and plotted together in the inset to Fig. 7B for easy comparison. Both histograms are asymmetric, with long tails on the side of large channels. This indicates that the channel sizes are not clearly limited. Electrophysiological measurements have recorded channels with much larger calculated diameters.
4. Conclusion
This work presents the first visualization of the large channels formed by ceramide in phospholipid membranes. Channel sizes peak around 10 nm but do not show a normal distribution, indicating that the size is not strictly limited by the energetics of channel curvature. Indeed, both the TEM and functional studies show that the channels can achieve very large sizes. The size may be restrained in mitochondria by Bcl-2 family proteins as previously reported [12]. The ability to form very large channels is in agreement with models of the ceramide channel structure deduced from functional studies [15] and supported by molecular dynamics simulations [16]. The large channel size is also in agreement with all the intermembrane space proteins that are released on the onset of the induction phase of apoptosis. These results may not apply to other structural forms of ceramide, such as skin ceramide that has been shown [21] to act by changing the overall morphology of liposomes.
Acknowledgments
This work was supported by a grant from the National Science Foundation (MCB-0641208).
Footnotes
Publisher's Disclaimer: This is a PDF file of an unedited manuscript that has been accepted for publication. As a service to our customers we are providing this early version of the manuscript. The manuscript will undergo copyediting, typesetting, and review of the resulting proof before it is published in its final citable form. Please note that during the production process errors may be discovered which could affect the content, and all legal disclaimers that apply to the journal pertain.
References
- 1.Shi Y. A structural view of mitochondria-mediated apoptosis. Nat Struc Biol. 2001;8:394–401. doi: 10.1038/87548. [DOI] [PubMed] [Google Scholar]
- 2.Ganesan V, Colombini M. Regulation of ceramide channels by Bcl-2 family proteins. FEBS Lett. 2010;584:2128–2134. doi: 10.1016/j.febslet.2010.02.032. [DOI] [PubMed] [Google Scholar]
- 3.Hannun YA, Obeid LM. Principles of bioactive lipid signaling: lessons from sphingolipids. Nat Rev Mol Cell Biol. 2008;9:139–150. doi: 10.1038/nrm2329. [DOI] [PubMed] [Google Scholar]
- 4.Siskind L. Ceramide channels increase the permeability of the mitochondrial outer membrane to small proteins. J Biol Chem. 2002;277:26796–803. doi: 10.1074/jbc.M200754200. [DOI] [PMC free article] [PubMed] [Google Scholar]
- 5.Thomas RL, Matsko CM, Lotze MT, Amoscato AA. Mass spectrometric identification of increased C16 ceramide levels during apoptosis. J Biol Chem. 1999;274:30580–30588. doi: 10.1074/jbc.274.43.30580. [DOI] [PubMed] [Google Scholar]
- 6.Ardail D, Maalouf M, Boivin A, Chapet O, Bodennec J, Rousson R, Rodriguez-Lafrasse C. Diversity and complexity of ceramide generation after exposure of jurkat leukemia cells to irradiation. Int J Radiat Oncol Biol Phys. 2009;73:1211–1218. doi: 10.1016/j.ijrobp.2008.11.033. [DOI] [PubMed] [Google Scholar]
- 7.Birbes H, Luberto C, Hsu YT, El Bawab S, Hannun YA, Obeid LM. A mitochondrial pool of sphingomyelin is involved in TNFalpha-induced Bax translocation to mitochondria. Biochem J. 2005;386:445–451. doi: 10.1042/BJ20041627. [DOI] [PMC free article] [PubMed] [Google Scholar]
- 8.Dai Q, Liu J, Chen J, Durrant D, McIntyre TM, Lee RM. Mitochondrial ceramide increases in UV-irradiated HeLa cells and is mainly derived from hydrolysis of sphingomyelin. Oncogene. 2004;23:3650–3658. doi: 10.1038/sj.onc.1207430. [DOI] [PubMed] [Google Scholar]
- 9.Garcia-Ruiz C, Colell A, Mari M, Morales A, Fernandez-Checa JC. Direct effect of ceramide on the mitochondrial electron transport chain leads to generation of reactive oxygen species. Role of mitochondrial glutathione. J Biol Chem. 1997;272:11369–11377. doi: 10.1074/jbc.272.17.11369. [DOI] [PubMed] [Google Scholar]
- 10.Matsko CM, Hunter OC, Rabinowich H, Lotze MT, Amoscato AA. Mitochondrial lipid alterations during Fas- and radiation-induced apoptosis. Biochem Biophys Res Commun. 2001;287:1112–1120. doi: 10.1006/bbrc.2001.5696. [DOI] [PubMed] [Google Scholar]
- 11.Siskind LJ, Kolesnick RN, Colombini M. Ceramide forms channels in mitochondrial outer membranes at physiologically relevant concentrations. Mitochondrion. 2006;6:118–125. doi: 10.1016/j.mito.2006.03.002. [DOI] [PMC free article] [PubMed] [Google Scholar]
- 12.Siskind LJ, Feinstein L, Yu T, Davis JS, Jones D, Choi J, Zuckerman JE, Tan W, Hill RB, Hardwick JM, Colombini M. Anti-apoptotic Bcl-2 family proteins disassemble ceramide channels. J Biol Chem. 2008;283:6622–6630. doi: 10.1074/jbc.M706115200. [DOI] [PMC free article] [PubMed] [Google Scholar]
- 13.Ganesan V, Perera MN, Colombini D, Datskovskiy D, Chadha K, Colombini M. Ceramide and activated Bax act synergistically to permeabilize the mitochondrial outer membrane. Apoptosis. 2010;15:553–562. doi: 10.1007/s10495-009-0449-0. [DOI] [PubMed] [Google Scholar]
- 14.Siskind LJ, Colombini M. The lipids C2- and C16-ceramide form large stable channels. Implications for apoptosis. J Biol Chem. 2000;275:38640–38644. doi: 10.1074/jbc.C000587200. [DOI] [PMC free article] [PubMed] [Google Scholar]
- 15.Siskind LJ, Davoody A, Lewin N, Marshall S, Colombini M. Enlargement and contracture of C2-ceramide channels. Biophys J. 2003;85:1560–1575. doi: 10.1016/S0006-3495(03)74588-3. [DOI] [PMC free article] [PubMed] [Google Scholar]
- 16.Anishkin A, Sukharev S, Colombini M. Searching for the molecular arrangement of transmembrane ceramide channels. Biophys J. 2006;90:2414–2426. doi: 10.1529/biophysj.105.071977. [DOI] [PMC free article] [PubMed] [Google Scholar]
- 17.Montal M, Mueller P. Formation of bimolecular membranes from lipid monolayers and a study of their electrical properties. Proc Natl Acad Sci USA. 1972;69:3561–3566. doi: 10.1073/pnas.69.12.3561. [DOI] [PMC free article] [PubMed] [Google Scholar]
- 18.Colombini M. Characterization of channels isolated from plant mitochondria. Methods Enzymol. 1987;148:465–475. doi: 10.1016/0076-6879(87)48045-2. [DOI] [PubMed] [Google Scholar]
- 19.Stiban J, Fistere D, Colombini M. Dihydroceramide hinders ceramide channel formation: Implications on apoptosis. Apoptosis. 2006;11:773–780. doi: 10.1007/s10495-006-5882-8. [DOI] [PubMed] [Google Scholar]
- 20.Maunsbach AB, Afzelius BA. Biomedical electron microscopy: illustrated methods & interpretations. Academic Press; 1999. [Google Scholar]
- 21.Xu P, Tan G, Zhou J, He J, Lawson LB, McPherson GL, John VT. Undulating tubular liposomes through incorporation of a synthetic skin ceramide into phospholipid bilayers. Langmuir. 2009;25:10422–10425. doi: 10.1021/la9010899. [DOI] [PMC free article] [PubMed] [Google Scholar]


