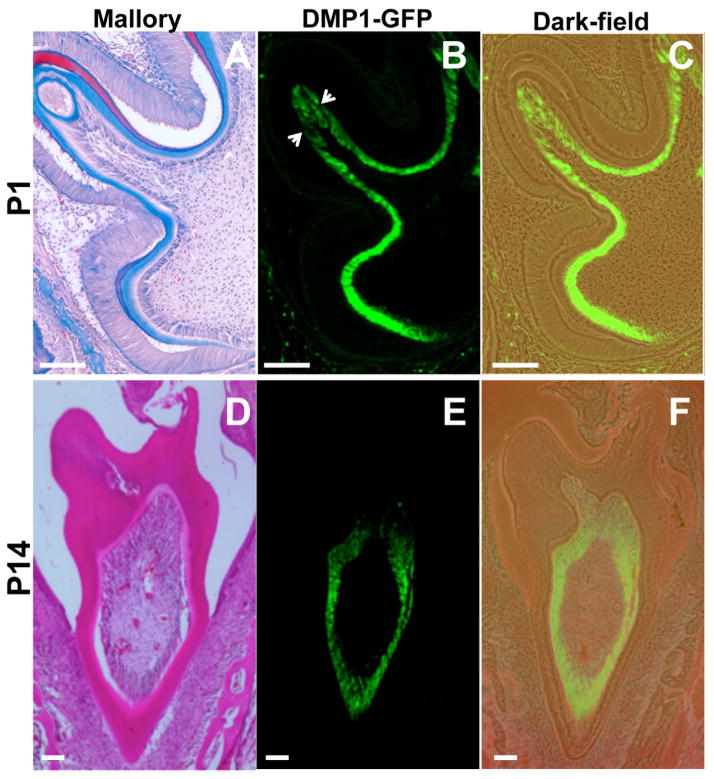
Figure 2. Expression of DMP1-GFP transgene in developing molars at P1 and P14.
Stained (A,D), epifluorescence (B,E) and dark-field (C,F), images of sections through postnatal molar teeth at P1 (A–C) and P14 (D–F). In each stage of development, adjacent sections were processed for different analyses. (A–C) At P1 DMP1-GFP is expressed in the entire layer of fully differentiated odontoblasts. At the tip of the each cusp highly differentiated odontoblasts show slight reduction of GFP signal (indicated by arrows). A represents an image of a section stained with Mallory. (D–F) At P14, highly differentiated odontoblasts at the tip of the cusp show DMP1-GFP expression at very low intensity. (D) represents an image of a section stained with H&E. Scale bar in all pictures=100 μm.

