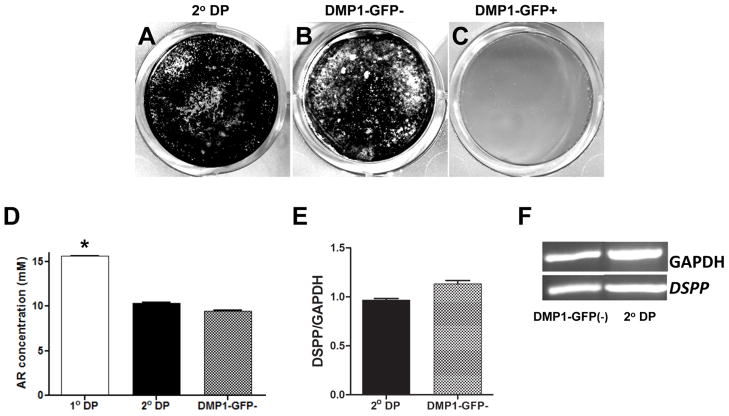
Figure 8. Mineralization and dentinogenic potential of DMP1-GFP- and DMP1-GFP+ populations.
(A–C) represent images of von Kossa staining of cultures established from unsorted cells (secondary culture) (A), DMP1-GFP- (B) and DMP1-GFP+ (C) cells after 21 days. (D) Histogram showing the amounts of extracted Alizarin Red staining in cultures after 21 days. Values represent the concentration of the extracted Alizarin Red calculated from the mean absorbance ± S.E. for at least three independent experiments with multiple samples in each experiment (*p<0.05). (E) Histogram showing the relative levels of DSPP after 21 days in these cultures The levels of DSPP were normalized to GAPDH. (F) RT-PCR analysis of expression of DSPP in these cultures.

