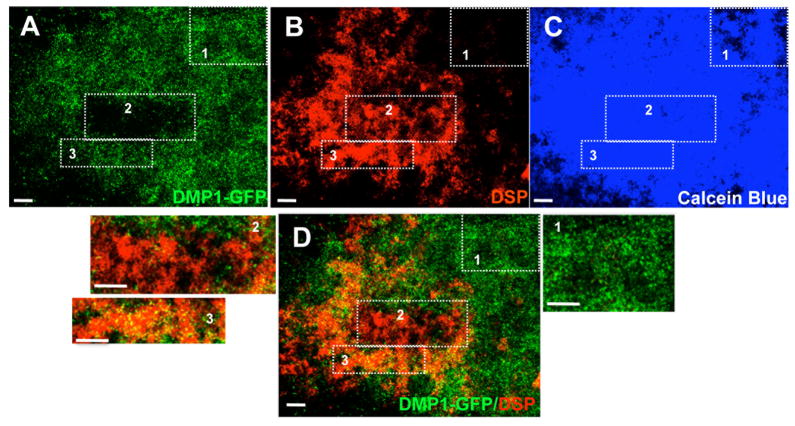
Figure 9. Expression of DMP1-GFP, DSP in mineralized matrix in vitro at day 21.
Images representing expression of DMP1-GFP (A), DSP (B) and Calcein Blue (C) in the same culture at day 21. D represents the Overlay of the two images generated in Photoshop showing the correlation of DMP1-GFP expression and DSP staining. Rectangles indicated by 1, 2, 3 in all images are shown at higher magnifications. Area 1 contains cells expressing DMP1-GFP at high intensity, that is also stained with Calcein Blue but not DSP representing the osteogenic differentiation in this culture. Area 2 contains cells expressing DMP1-GFP at very low intensity, is stained with anti-DSP antibody and Calcein Blue representing the dentinogenic differentiation and the formation of fully highly differentiated odontoblasts. Area 3 contains cells expressing DMP1-GFP at both high and low intensity, is stained with anti-DSP antibody and Calcein Blue characteristic of the dentinogenic differentiation and the formation of secretory/functional odontoblasts and young odontoblasts. Scale bars in all images = 1mm

