

Abstract
Objective
The FLT3 internal tandem duplication (Flt3-ITD) confers a worse prognosis for patients with acute myeloid leukemia (AML); however, the mechanisms involved are unknown. As AML is treated with cytarabine (Ara-C) and an anthracycline we sought to determine the effects of the Flt3-ITD on response to these agents.
Methods
A genetically defined mouse model of AML was used to examine the effects of the Flt3-ITD on response to cytarabine and doxorubicin in vitro and in vivo.
Results
In vitro, the Flt3-ITD conferred resistance to doxorubicin and doxorubicin plus Ara-C, but sensitivity to Ara-C alone. This resistance was reversible by the Flt3-ITD inhibitor sorafenib. The Flt3-ITD did not affect DNA damage levels following treatment but was associated with increased levels of p53. The p53 response was critical to the observed changes as the Flt3-ITD had no effect on chemotherapy response in the setting of p53 null AML. In vivo, the Flt3-ITD accelerated engraftment that was partially reversible by Ara-C but not doxorubicin. Additionally, Ara-C provided a significant reduction in disease burden and a survival advantage that was not increased by the addition of doxorubicin. Doxorubicin alone lead to only minimal disease reduction and no survival benefit.
Conclusions
These data demonstrate that the Flt3-ITD confers sensitivity to cytarabine, but resistance to doxorubicin in a manner that depends on p53. Thus, patients with Flt3-ITD positive AML may not benefit from treatment with an anthracycline.
Introduction
Acute myeloid leukemia (AML) is a genetically heterogeneous, aggressive disease and despite decades of research, outcomes for most patients remain poor. Patients can be divided into prognostic groups based on the presence of recurrent chromosomal abnormalities [1–3], however, many have no chromosomal abnormalities and fall into an intermediate prognostic group with variable outcomes [4]. Recent work has shown that the presence of submicroscopic genetic mutations can affect prognosis in these patients [5].
One such example is the Flt3-ITD. The presence of an internal tandem duplication within the FLT3 gene confers a worse prognosis in multiple studies [5–8]. The FLT3 gene encodes a member of the type 3 receptor tyrosine kinases and has a role in normal hematopoiesis [9]. The tandem duplication insertion results in constitutive activation of the receptor [10]. This activation causes a myeloproliferative disorder in mice and cooperates with other oncogenes in the generation of AML [11–12]. Mutations in the FLT3 gene are among the most common in AML, and inhibitors of this molecule are the current focus of multiple recent and ongoing clinical trials [13–17].
The presence of the Flt3-ITD activates multiple downstream signaling cascades, including the RAS-MAP kinase pathway [18–19]. It perturbs multiple cellular functions including; DNA repair [20], cell cycle progression [21], levels of reactive oxygen species (ROS) [22] and levels of anti-apoptotic proteins [23–24]. Several studies have implicated these changes to anthracycline resistance in cell lines or primary patient samples in vitro [20, 23].
Despite this work, the effects of the Flt3-ITD on chemotherapy response remain poorly understood. At present patients with Flt3-ITD positive AML outside of a clinical trial are treated with a combination of cytarabine and an anthracycline. In this study we use a genetically defined mosaic mouse model of AML to determine the effect of the Flt3-ITD on response to chemotherapy in vitro and in vivo.
Materials and Methods
Retroviral constructs
All retroviruses were constructed in the MSCV backbone (Clontech) and have been described previously [25]. Cloning strategies and primer sequences are available on request.
Fetal liver cell isolation, retroviral transduction, and transplantation
The Cold Spring Harbor and Wake Forest University Animal Care and Use Committees approved all mouse experiments. E13.5–E15 fetal liver cells (FLCs) from wild-type C57BL/6 mice were isolated, cultured, and retrovirally transduced as described previously [25]. Briefly, retroviral (co)transduction was carried out by combining viral supernatants from independent transfections of ecotropic Phoenix packaging cells in a 1:1 ratio. Transduction of GFP-expressing constructs was assessed 24–48 h after the last infection by flow cytometry (Guava EasyCyte, Guava Technologies). Transduction of luciferase-expressing constructs was confirmed qualitatively (IVIS100, Caliper LifeSciences). 1 × 10⁶ cells were transplanted by tail vein injection of 6- to 8-wk-old lethally irradiated C57BL/6 recipient mice (9.0 Gy as single dose administered prior to transplantation).
Competition and viability assays
Two days after infection or thereafter, leukemia cells were split into replicate wells of ~25,000 cells in 24-well plates. After 72-hour treatments, the GFP-positive percentage was quantified in the live cell population by using a FACSCalibur flow cytometer (BD Bioscience, San Jose, CA) or Guava Easycyte (Millipore, Billerica, MA). For cultures where the GFP+ population was in excess of 50%, non-infected co-cultured cells were added to achieve a final GFP+ population of ~20%. Viability assays were done using either the Cell Titer-Blue assay (Promega) according to the manufacturer's protocol, or by PI staining followed by flow cytometry gating via a FSC versus PI plot. All cells were maintained in stem cell media (40% DMEM, 40% IMDM, 20% FBS, supplemented with murine stem cell factor to a final of 10 ng/ml, murine iL6 to 2 ng/ml and murine iL3 to 0.4 ng/ml).
Alkaline comet assay
Cells were treated as indicated, mixed with 1% agarose, placed on a glass slide, put in alkaline lysis buffer (2.5 M NaCl, 100 mM EDTA, 10 mM Tris, pH 10, 1% Triton X-100, 2% DMSO), and placed at 4°C overnight. Slides were rinsed three times with weak alkali buffer (0.03M NaOH, 1 mM EDTA). Slides were electrophoresed in weak alkali buffer at 25V for 25 min, rinsed, placed in neutralization buffer (0.05 M Tris buffer pH 8.0) for 10 min, fixed with 100% methanol and allowed to dry overnight. Slides were stained in propidium iodide at 20 mg/ml for 10 min and visualized with a fluorescence microscope. The comet DNA content was quantitated using a freeware program called CASPlab available at http://casplab.com/.
Western blots and immunofluorescence
Samples were lysed in Laemmli buffer, separated by SDS-PAGE, and transferred to Immobilon PVDF membrane (Millipore). Antibodies against p53 (IMX25, 1:1000; Leica Microsystems), p21 (C-19,1:500; Santa Cruz Biotechnologies), Nras (F155, 1:300; Santa Cruz Biotechnologies), Flt3 (sc479, 1:500; Santa Cruz Biotechnologies), p-STAT5 (1:2000, #9356; Cell Signalling Technologies), STAT5 (1:2000, #9363; Cell Signalling Technologies) and actin (AC-15, 1:5000; Abcam) were used. Immunofluorescence for phosphorylated γH2AX, cells were fixed with 4% NBF, permeabilized with PBS containing 0.2% Triton-X 100, and probed with anti-phosphoH2AX (1:100, #2577; Cell Signalling Technologies) followed by donkey anti-rabbit Alexa 594 conjugated antibody (1:500, A-21207; Invitrogen) and visualized via fluorescence microscopy. Greater than 90 nuclei were then scored per condition, per experiment, by two separate individuals using the following scoring system: 0=none, 1=few, 2=moderate, 3=many.
Transplantation and in vivo treatment studies
For treatment studies, primary leukemias were transplanted into 6- to 8-wk-old sublethally irradiated recipient mice (4 Gy) by tail-vein injection of 1 × 10⁶ viable cells. Sublethal irradiation was used to achieve a more uniform disease onset in recipient animals. For animals transplanted with luciferase-expressing leukemias, mice were monitored by bioluminescent imaging on day 7 after transplantation. Bioluminescent imaging was performed using an IVIS100 imaging system (Caliper LifeSciences). Mice were injected intraperitoneally with 150 mg/kg D-Luciferin (Caliper LifeSciences), anesthetized with isoflurane, and imaged for 2 min after a 5-min incubation following injection. Chemotherapy was initiated upon detection of clear signals. Mice were treated for five consecutive days every 24 h with i.p. injections of 100 mg/kg cytarabine or 3 mg/kg doxorubicin (both from Bedford Laboratories) or both. Control animals were observed only. Repeat luciferase imaging was performed on day 6 following treatment (day 13 from transplantation).
In vivo competition assays
Ly5.1+ C57Bl6 6- to 8-wk-old sublethally irradiated recipient mice (4 Gy) were injected with 1×10⁶ blasts, 10% expressing the Flt3-ITD or a control vector. These mice are syngeneic with standard C57Bl6 mice except for the Ly5.1 allele. This allows for distinction between endogenous marrow cells and the Ly5.2+ leukemia. On day 13 observation or treatments with either doxorubicin, cytarabine or the combination were begun. After 5 days of treatment or observation, animals were sacrificed and bilateral femoral bone marrow was harvested, stained with FITC or APC conjugated anti-Ly5.2 antibody (E Biosciences, San Diego, CA). Stained cells were analyzed by flow cytometry using either a Guava or a FACSCalibur flow cytometer (BD Bioscience, San Jose, CA).
Statistical Methods
In all experiments with more than two means an initial ANOVA analysis was used. If a statistically significantly result was obtained (p<0.05) then individual means were compared by two sided standard student's T test. For comparison of Kaplan-Meier curves a log rank test was used. All statistical analysis was performed using Graph Pad Prism 5 software (GraphPad Software Inc). All error bars represent the standard error.
Results
Flt3-ITD alters chemotherapy response in vitro
To determine the effects of the Flt3-ITD on chemotherapy response we utilized a genetically defined mouse model of AML based expression of the MLL-ENL fusion protein. We chose this model because 1) it has been shown to closely resemble the AML seen in patients expressing this protein [25–26], 2) blasts can be cultured in media supplemented with cytokines and injected into secondary recipients, and 3) it is a syngeneic model that contains contributions from the microenvironment and the immune system. We generated several AML cell lines expressing either MLL-ENL alone or with the Flt3-ITD (see schema in Figure 1A).
Figure 1.

Changes in chemotherapy response can be detected in a genetically defined murine AML model. A) Schematic overview of the generation of the mosaic AML mouse models. C57BL/6 fetal liver cells isolated at E13.5–E15 were (co)transduced with MLL-ENL expressing retroviruses and injected into lethally irradiated recipients. B) Competition assays were done with partially infected MLL-ENL-induced leukemias with the indicated shRNA vectors. Data is presented as a ratio of GFP+ cells in the control vs each experimental condition (%GFP exp/%GFP control). All reactions were done in triplicate. Asterisks denote statistically significant results. C) The MSCV based vector expressing N-RasG12D is shown in the right panel. The left panel shows cytokine independent growth for 7 days as assessed by flow cytometry in media that contained or lacked murine SCF, iL6 and iL3. D) Competition assays were carried out as above in cytokine replete media. The left panel is a histogram of representative flow data. In the right panel the mean ratio of GFP positive to negative populations are plotted; each experiment is done in triplicate and was repeated in 2 separate infections. A representative example is shown. Asterisks denote statistically significant differences (p<0.05 by student's T test).
To determine the effect of the Flt3-ITD we developed a protocol to infect established MLL-ENL leukemia cells. To determine whether retroviral vectors could cause resistance in MLL-ENL-induced leukemias, we infected cells with retroviruses expressing short hairpin RNAs (shRNAs) that targeted either Topoisomerase II alpha (TopoII) or p53 with a GFP reporter. ShRNAs that target TopoII confer resistance to doxorubicin [27] while knockdown of p53 results in decreased sensitivity to a variety of cytotoxic chemotherapies. To assess the effects of these shRNAs on chemotherapy response, a competition assay was performed (see [27]). In this assay, a partially infected cell population is exposed to cytarabine, doxorubicin, or both for 72 hours. Doxorubicin was used because C57/Bl6 mice do not tolerate the more commonly used daunorubicin [28]. After exposure, the ratio of GFP+ cells in the viable population is determined. As expected, cells expressing the shRNA targeting TopoII were significantly enriched in the presence of doxorubicin (p=0.003), but not cytarabine (p=NS, Figure 1B). Cells expressing the shRNA that targets p53 were significantly enriched in the presence of both doxorubicin and cytarabine (p=0.001 and 0.0003). Cells expressing the control shRNA did not significantly enrich in the presence of either agent (Figure 1B). These data demonstrate that resistance to therapy can be detected by this assay.
To assess if increased sensitivity could also be detected we sought to determine the effect of oncogenic NRasG12D. In previous reports oncogenic Ras increased sensitivity to cytarabine [29–31]. Leukemia cells transduced with retrovirus expressing NrasG12D became cytokine-independent (Figure 1C). As expected competition assays revealed a significant dose-dependent decrease in N-Ras-expressing cells after cytarabine treatment (p=0.001, Figure 1D). Collectively these data show that this system can accurately report changes in doxorubicin and cytarabine sensitivity in vitro.
To determine the effects of the Flt3-ITD on chemotherapy response, a GFP tagged, Flt3-ITD vector was infected into cells (Figure 2A). This resulted in efficient expression of the Flt3-ITD (Figure S1A). Cells infected with the Flt3-ITD became cytokine-independent (Figure 2A) and exhibited STAT5 hyper-phosphorylation consistent with constitutively active Flt3-ITD (Figure S1B). The Flt3-ITD expressing cells became depleted in the presence of cytarabine (p=0.005), but enriched with doxorubicin alone and cytarabine plus doxorubicin (p=0.005 and <0.0001 respectively, Figure 2B). To confirm these results pure populations of cells with or without the Flt3-ITD were exposed to cytarabine or doxorubicin. When viability was assessed results were consistent with the competition assays (Figure 2C). To further establish the causal nature of the Flt3-ITD on the observed changes we utilized the small molecule tyrosine kinase inhibitor sorafenib. Sorafenib has been shown to be a potent inhibitor of the Flt3-ITD [13]. When Flt3-ITD expressing cells were treated with sorafenib they became sensitized to doxorubicin while the control cells did not (p=< 0.0001, Figure 2D). These data confirm that the Flt3-ITD confers increased sensitivity to cytarabine and resistance to doxorubicin in vitro.
Figure 2.

The Flt3-ITD alters chemotherapy response in vitro. A) The MSCV based vector expressing the Flt3-ITD is shown. Cytokine independent growth was assessed by flow cytometry as in 1C. B) Competition assays were done in MLL-ENL only leukemias partially positive for the Flt3-ITD. For the combined treatments cells were exposed to doxorubicin at 5 ng/ml and 25 nM cytarabine. Multiple experiments were done in triplicate in 2 independent cell lines, a representative result is shown. Asterisks denote statistically significant differences. C) Purified populations of MLL-ENL-induced leukemias infected with Flt3-ITD or control vector were exposed to the indicated chemotherapy for 72 hours. All reactions were done in triplicate. Viability was then assessed by MTS assay. D) Purified cell populations were exposed to 2.5 ng/ml doxorubicin, 25nM sorafenib or both for 72 hours. Viability was assessed by MTS assay. Asterisks denote statistically significant differences.
The Flt3-ITD does not decrease the amount of chemotherapy-induced DNA damage
To elucidate how the Flt3-ITD alters chemotherapy response, we examined the amount of DNA damage induced by either doxorubicin or cytarabine. To assess the presence of single or double strand breaks in the DNA, an alkaline comet assay was performed. We found no statistically significant difference in the amount of single- and double-strand DNA breaks induced by treatment with either doxorubicin or cytarabine (Figure 3A). Cells that contained the Flt3-ITD showed increased DNA strand breaks at baseline, consistent with previously published reports [22]. We next examined the generation of γH2AX foci in response to doxorubicin or cytarabine exposure. While there was an increase in γH2AX foci in blasts expressing the Flt3-ITD at baseline there was no reproducible decrease in foci generated in the Flt3 ITD expressing blasts under any condition examined (Figure S2). These results suggest that the Flt3-ITD does not alter the intracellular concentration of either doxorubicin or cytarabine and makes it unlikely that the resistance to doxorubicin is mediated by increased drug efflux.
Figure 3.

The Flt3-ITD increases p53 induction. A) Alkaline comet assays were performed after cells were treated with the indicated chemotherapy for four hours. Ten to twelve comets were quantitated per condition and the experiment was carried out 3 times. A representative result is shown. B) Western blot for murine p53 and p21. Cells were exposed to the indicated amounts of doxorubicin for 4 hours, harvested and lysates analyzed for p53 and p21. D) Q-PCR results for p53 transcriptional targets p21 and MDM2. Cells were exposed to the indicated chemotherapies for 4 hours and total RNA was isolated. QPCR was performed and relative transcript amounts as compared to an actin control were plotted.
The Flt3-ITD increases the induction of p53 after exposure to chemotherapy
It has been recently shown that oncogenic Ras increases the p53 response to cytarabine [31]. As the Flt3-ITD also activates the Ras pathway, we assessed the p53 response in cells with or without the Flt3-ITD. Cells were exposed to doxorubicin and p53 levels assessed. The presence of the Flt3-ITD increased p53 induction (Figure 3B). Consistent with induction of p53 western blots showed increased p21 levels (Figure 3B). To compare p53 induction with cytarabine and establish that p53 was inducing transcription of additional downstream targets, we performed RT-QPCR on p21 and MDM2 – another known p53 transcriptional target gene - after exposure to either doxorubicin or cytarabine. Transcripts of both genes were increased in a Flt3-ITD dependent fashion after exposure to either doxorubicin or cytarabine (Figure 3C). Taken together, these data demonstrate the Flt3-ITD causes an increase in the p53 response in blasts exposed to either cytarabine or doxorubicin.
The Flt3-ITD does not alter the chemotherapy response in p53 null blasts
To determine if altered p53 induction mediated differences in chemotherapy response, we generated MLL-ENL only cells from p53 null FLCs. We then infected the cells with the Fl3 ITD or control vector and performed competition assays. These blasts efficiently expressed the Flt3-ITD and cells containing the Flt3-ITD had a growth advantage in cytokine-deficient media (Figure S3). However, the Flt3-ITD did not confer resistance to doxorubicin or doxorubicin plus cytarabine, and we found no consistently increased sensitivity to cytarabine (Figure 4A).
Figure 4.

The Flt3-ITD does not alter chemotherapy response in p53 null leukemias. A) Competition assays were done in p53 null, MLL-ENL only leukemias partially positive for the Flt3-ITD. Two independent infections were exposed to the indicated chemotherapy for 72 hours. B) Competition assays. MLL-ENL and Flt3-ITD leukemia was generated from p53 wild type FLCs and infected with a control vector or one that expresses a shRNA targeting p53. Cells were exposed to the indicated chemotherapy for 72 hours, all experiments were done in triplicate. Asterisks denote statistical difference from control (p=<0.05 by student's T test).
To further establish the dependence of the increased sensitivity to cytarabine on an intact p53, we performed competition assays with an shRNA that targets p53 in a MLL-ENL and Flt3-ITD expressing leukemia. When the cells were treated with cytarabine, there was a dose-dependent, significant increase in the cells containing the shRNA (p=< 0.0001, Figure 4B). These data are consistent with the interpretation that Flt3-ITD confers an increased sensitivity to cytarabine in a p53-dependent manner.
The Flt3-ITD alters chemotherapy response in vivo
Recent studies have shown that the bone marrow microenvironment can have a profound effect on chemotherapy response in AML [32]. To extend our findings to a setting that would incorporate these important interactions, we developed an in vivo competition assay (Figure 5A). Flt3-ITD-positive cells demonstrated a profound engraftment advantage: although they comprised only 10% of the injected cells, they became nearly 95% of the cells in the control marrow (Figure 5B). Consistent with our in vitro data, this advantage was partially reversed by cytarabine (n=3) but not by doxorubicin (n=4) treatment (Figure 5B). Leukemia cells transduced with a GFP expressing control vector did not display a similar advantage in engraftment. In fact, the percentage of GFP-positive cells declined from ~10% to ~ 4% (n=3), and was not affected by treatment with cytarabine (n=4) or doxorubicin (n=4). These data demonstrate that the Flt3-ITD confers an engraftment advantage that can be partly abolished by treatment with cytarabine but not doxorubicin.
Figure 5.

The Flt3-ITD alters chemotherapy response in vivo and accelerates an already established AML. A) Schema of in vivo competition assay. MLL-ENL-induced leukemias infected with Flt3-ITD expressing vectors are diluted with uninfected cells to a total of ~10% Flt3-ITD positivity and injected into sublethally irradiated Ly5.1+ C57/Bl6. Animals are observed or treated as indicated. After treatment femurs are harvested, cells stained for anti-Ly5.2 and analyzed by flow cytometry. B) In vivo competition assays. Assays were performed as described in A. Shown are the mean percentages of the GFP+ cells of the total Ly5.2+ population (GFP+/Ly5.2+). Error bars reflect the standard error. C) Leukemic burden in Ly5.1+ C57/Bl6 mice after 5 days of treatment with the indicated therapy. Mice were injected with the indicated leukemia. Following treatment femurs were harvested, marrow cells analyzed for GFP (Flt3-ITD expressing cells) or stained with anti-Ly5.2 antibody (Parental cells) and analyzed by flow cytometry. Data was normalized to average engraftment of untreated control animals. Error bars reflect the standard error.
To further assess the effects of the Flt3-ITD on chemotherapy response in vivo, mice were injected with pure populations of cells with or without the Flt3-ITD and therapy was initiated on day 13 as in the in vivo competition assay. At the end of treatment overall leukemic burden was determined by flow cytometry. The parental leukemia was minimally responsive to doxorubicin (n=9) or cytarabine (n=9), but a significant reduction was seen with the combination vs either agent alone (p= < 0.0009, n=5, Figure 5C). In marked contrast, Flt3-ITD-infected cells were somewhat sensitive to doxorubicin (n=12), but showed a marked reduction to cytarabine (n=11, p= < 0.0001 vs doxorubicin). No additional activity was seen when doxorubicin was added to cytarabine (n=4, Figure 5C). Combination therapy was slightly less efficacious when compared to cytarabine alone, although this was not statistically significant (p= NS). These data show that the Flt3-ITD increases sensitivity to cytarabine in vivo.
To extend this analysis to total body leukemic burden and rule out isolate specific effects, mice were injected with a leukemia that was generated by transduction of both a Flt3-ITD expressing vector and a MLL-ENL vector that co-expressed luciferase. Once leukemic engraftment was established by luciferase imaging, animals were observed (n=4) or treated with either doxorubicin (n=7), cytarabine (n=7), or both (n=7) and re-imaged. Consistent with our previous results this Flt3-ITD expressing leukemia exhibited a marked sensitivity to cytarabine (p= 0.0003 vs control), and addition of doxorubicin provided no additional benefit in disease reduction (p= NS, Figures 6A and S4). To determine if this differential activity resulted in a difference in survival we treated mice with cytarabine, doxorubicin or both and then followed the animals for survival. Consistent with the luciferase data animals that were treated with cytarabine (n=13) had a significant survival advantage over controls (n=11) with a p value of 0.02. Furthermore when doxorubicin was added to cytarabine (n=7) there was no significant difference in survival over animals treated with cytarabine alone (p= NS). Lastly, doxorubicin alone (n=5) did not result in a significant survival advantage over controls (Figure 6B). To ensure that this lack of survival benefit was a consequence of the presence of the Flt3-ITD we treated animals injected with a MLL-ENL and NRasG12D driven leukemia with the same regimen of doxorubicin. In contrast to the Flt3-ITD leukemia there was a significant survival benefit for the Ras driven leukemia when treated with doxorubicin (n=5) versus controls (n=5, p= 0.004, Figure 6B). Taken together, these data confirmed that Flt3-ITD increases the sensitivity to cytarabine in vivo and importantly that doxorubicin does not add any benefit over cytarabine alone.
Figure 6.

Flt3-ITD expressing leukemias do not benefit from doxorubicin treatment. A) MLL-ENL and Flt3-ITD leukemia was generated with a luciferase reporter. Animals were injected and one week later imaged for luciferase activity (D1). Animals were then treated as indicated for 5 days and on day 6 were imaged again (D6). Control animals were not treated, Dox animals received doxorubicin at 3mg/kg daily, Ara animals received cytarabine at 100mg/kg daily and A+D animals received doxorubicin and cytarabine. Quantitation of the luciferase activity using the Living Image System software (Xenogen) is shown. B) Kaplan-Meier curves for animals injected with the indicated leukemia and treated with cytarabine at 100mg/kg, doxorubicin at 3mg/kg or both. P values are for log rank test for treatment compared to control.
Discussion
The Flt3-ITD is one of the most common receptor tyrosine kinase mutations found in AML and results in a constitutive kinase activity, predicts shorter remission periods, increased risk of relapse, and lower overall survival [5, 33]. To better understand the mechanisms involved we sought to determine the effect of the Flt3-ITD on chemotherapy response using a mouse model of AML. In this study, we utilized a MLL-ENL driven murine model of AML in which FLCs are infected with retroviruses that express the oncogenic MLL-ENL fusion protein with or without a second virus that expresses the Flt3-ITD.
When we compared the therapy response of MLL-ENL leukemias with and without the Flt3-ITD we made several key observations. First, cells expressing the Flt3-ITD had increased sensitivity to cytarabine and resistance to doxorubicin. These findings were consistent across multiple isolates as well as in multiple infections. Importantly when the leukemias were treated with the combination of cytarabine and doxorubicin, approximating the current standard treatment, a net resistance was observed. Second, we observed an increase in the induction of p53 following therapy and its downstream gene targets in cells expressing the Flt3-ITD. This increased p53 response was shown to be critical for the observed changes as the Flt3-ITD did not affect therapy response in p53 null leukemias. Third, when assessed in vivo the Flt3-ITD-containing cells held a profound engraftment advantage despite the highly aggressive nature of the parental leukemia. The engraftment advantage conferred by the Flt3-ITD could be partially abolished by cytarabine but not doxorubicin. Additionally, when bilateral femoral bone marrow was assessed after treatment, residual disease burden was reduced when the Flt3-ITD containing leukemia was treated with cytarabine and no additional benefit was seen when doxorubicin was added. This was in contrast to the parental leukemia where there was only modest sensitivity to either agent alone and increased efficacy when the two were combined. This result was confirmed with a luciferase tagged Flt3-ITD leukemia. Finally, when animals engrafted with a Flt3-ITD expressing leukemia were treated with cytarabine there was a statistically significant increase in survival over control animals. This survival advantage could not be improved upon by the addition of doxorubicin and treatment with doxorubicin alone did not result in prolongation of survival.
These results have several potential clinical implications. First, they demonstrate that the Flt3-ITD provides an engraftment advantage to a fully established leukemia and provide proof of principle that Flt3-ITD mutations acquired after leukemogenesis can provide a competitive advantage, and thus explain how patients who are Flt3-ITD negative at diagnosis can become Flt3-ITD positive at relapse [34]. Additionally, the results demonstrate that the Flt3-ITD confers sensitivity to cytarabine and resistance to doxorubicin in an MLL-ENL driven leukemia. It is important to interpret this result in the proper context. The data presented here show that the Flt3-ITD expressing MLL-ENL leukemias become sensitized to cytarabine when compared to the non-Flt3-ITD expressing parental line. It is important to remember that the MLL-ENL model is therapy resistant [25] and that the cytarabine survival benefit while statistically significant remains modest. This increased responsiveness did not result in any animal achieving a complete remission and as mentioned above the Flt3-ITD expressing leukemias became more aggressive with shorter overall survival when compared to non-Flt3-ITD expressing leukemias (data not shown). Most importantly however, these results demonstrated that the addition of an anthracycline provides no benefit for animals injected with Flt3-ITD positive AML. This confirms and extends previous studies that have associated the Flt3-ITD with resistance to anthracyclines and increased DNA repair in vitro [20]. Additionally, all of the large studies to date that have established the negative impact of the Flt3-ITD were based on treatment regimens that combined cytarabine with an anthracycline during every phase of treatment [5–8, 35].
Our data suggests that for the MLL-ENL model expressing the Flt3 ITD, the anthracycline only adds toxicity without increasing efficacy. This is consistent with the findings of a recent clinical trial showing that while most AML patients benefit from intensified anthracycline dosing regimens, patients with the Flt3-ITD do not [36]. This data is also consistent with previous work on a PML-RARα and Flt3-ITD expressing murine model that demonstrated inhibition of the Flt3-ITD resulted in increased sensitivity to doxorubicin [28]. Finally, our data demonstrating the ability of sorafenib to sensitize Flt3-ITD expressing leukemias to doxorubicin are consistent with the results of a recent study of early high dose cytarabine and idarubicin in combination with sorafenib, that resulted in a complete remission in 14 out of 15 patients with a FLT3 mutation [37].
In this study the observed changes in chemotherapy response were dependent on an intact p53 response and p53 induction was higher in the cells expressing the Flt3 ITD. This result was particularly surprising in light of the fact that we and others have observed that MLL fusion proteins attenuate the p53 response in vitro and in vivo by an incompletely understood mechanism [25, 38–39]. In our previous study, we found that the suppressed p53 response is at least in part responsible for the relatively poor chemotherapy responsiveness of MLL-ENL driven AML. Upon treatment MLL-ENL models do not achieve complete disease remission and an average survival benefit of only several days is observed. These findings were reproduced in the present study (see figure 6B). However it is important to note that in all the previous studies an attenuation of p53 function, not complete loss was observed. As all comparisons were made between isogeneic MLL-ENL leukemias with or without the Flt3 ITD and there was clearly induction of both p53 protein and downstream targets (see figure 3B and C) we feel this model is suitable for studying the impact of the Flt3-ITD on p53 signaling and chemotherapy response. The downstream signaling consequences of the Flt3-ITD include activation of the PI3K, STAT5 and RAS/MAPK kinase pathways. Activation of the RAS pathway has been associated with increased sensitivity to cytarabine in vitro [29–30] and improved responses to high-dose cytarabine regimens in patients [40]. Ras mutations have also been shown to induce reactive oxygen species (ROS) and promote a DNA damage response. In a recent study, the presence of oncogenic Ras altered the response of MLL-ENL expressing murine bone marrow cells to cytarabine in a p53-dependent fashion [31]. Thus, it is likely that the Flt3-ITD mediated increased cytarabine sensitivity and p53 induction is a consequence of activation of the RAS/MEK/ERK pathway. These results are also consistent with previous studies that have shown that p53 loss contributes to resistance to cytarabine in AML cell lines [41]. Additionally, we observed that p53 induction was also more pronounced upon exposure to doxorubicin despite the fact that the Flt3 ITD conferred resistance to this agent. Cell responses to p53 induction can take the form of transient cell cycle arrest and DNA repair or permanent arrest in the form of senescence or apoptosis (reviewed in [42]). In addition to p53's more well known role in apoptosis induction it has also been shown to induce multiple prosurvival and DNA repair genes [43]. Flt3 ITD expressing AML cell lines and primary patient samples have increased ROS, double strand DNA breaks and increased DNA repair capacity [20, 22]. We hypothesize that cells expressing the Flt3 ITD are primed to repair double strand DNA breaks and that p53 induction in this setting results in cell cycle arrest, increased DNA repair and survival. Consistent with this hypothesis is the fact that Flt3 ITD expressing cells also showed increased resistance to etoposide, a topoisomerase II poison that induces DNA double strand breaks (data not shown). The exact mechanisms involved are the focus of ongoing studies.
Finally, these data suggest that the one size fits all approach to treatment of AML should be re-examined. There are multiple cytogenetic abnormalities and mutations that affect prognosis yet induction therapy is the same for all with the combination of cytarabine and an anthracycline. While our data is clearly preliminary and was derived from a single oncogene driven mouse model it suggests that patients with Flt3-ITD positive AML would not benefit from an anthracycline in the absence of a Flt3 inhibitor. It is our hope that this data will stimulate discussion on future clinical trials for patients with Flt3 ITD expressing AML.
Supplementary Material
Flt3-ITD expression in MLL-ENL-induced leukemias. Western blot showing expression of the Flt3-ITD in MLL-ENL-induced leukemias is shown. Western blot showing increased phospho-STAT5 was performed in leukemia cells maintained in serum or starved for 4 hours and re-fed as indicated.
Flt3-ITD expressing cells have higher baseline γH2AX foci. A) Immunofluorescence staining for phospho-γ-H2AX. Cells were treated with the indicated therapy for 4 hours, fixed, permeabilized and stained with anti-γH2AX antibody. B) Quantitation of phospho-γ-H2AX foci. Cells were exposed to the indicated therapy for 4 hours. Nuclei were stained for phospho-γ-H2AX and scored on a scale of 0 to 3 for the amount of foci present (0=none, 1=few, 2=moderate, 3=many). Bar graphs represent the mean score for each condition. The experiment was repeated three times, a representative example is shown.
The Flt3-ITD is efficiently expressed in p53 null leukemias. MLL-ENL expressing leukemias were generated in p53 null FLCs and then infected with the Flt3-ITD expressing vector. A) Cytokine independent growth was assessed by flow cytometry in media that contained or lacked murine SCF, iL6 and iL3. B) Western blot with anti-Flt3 is shown.
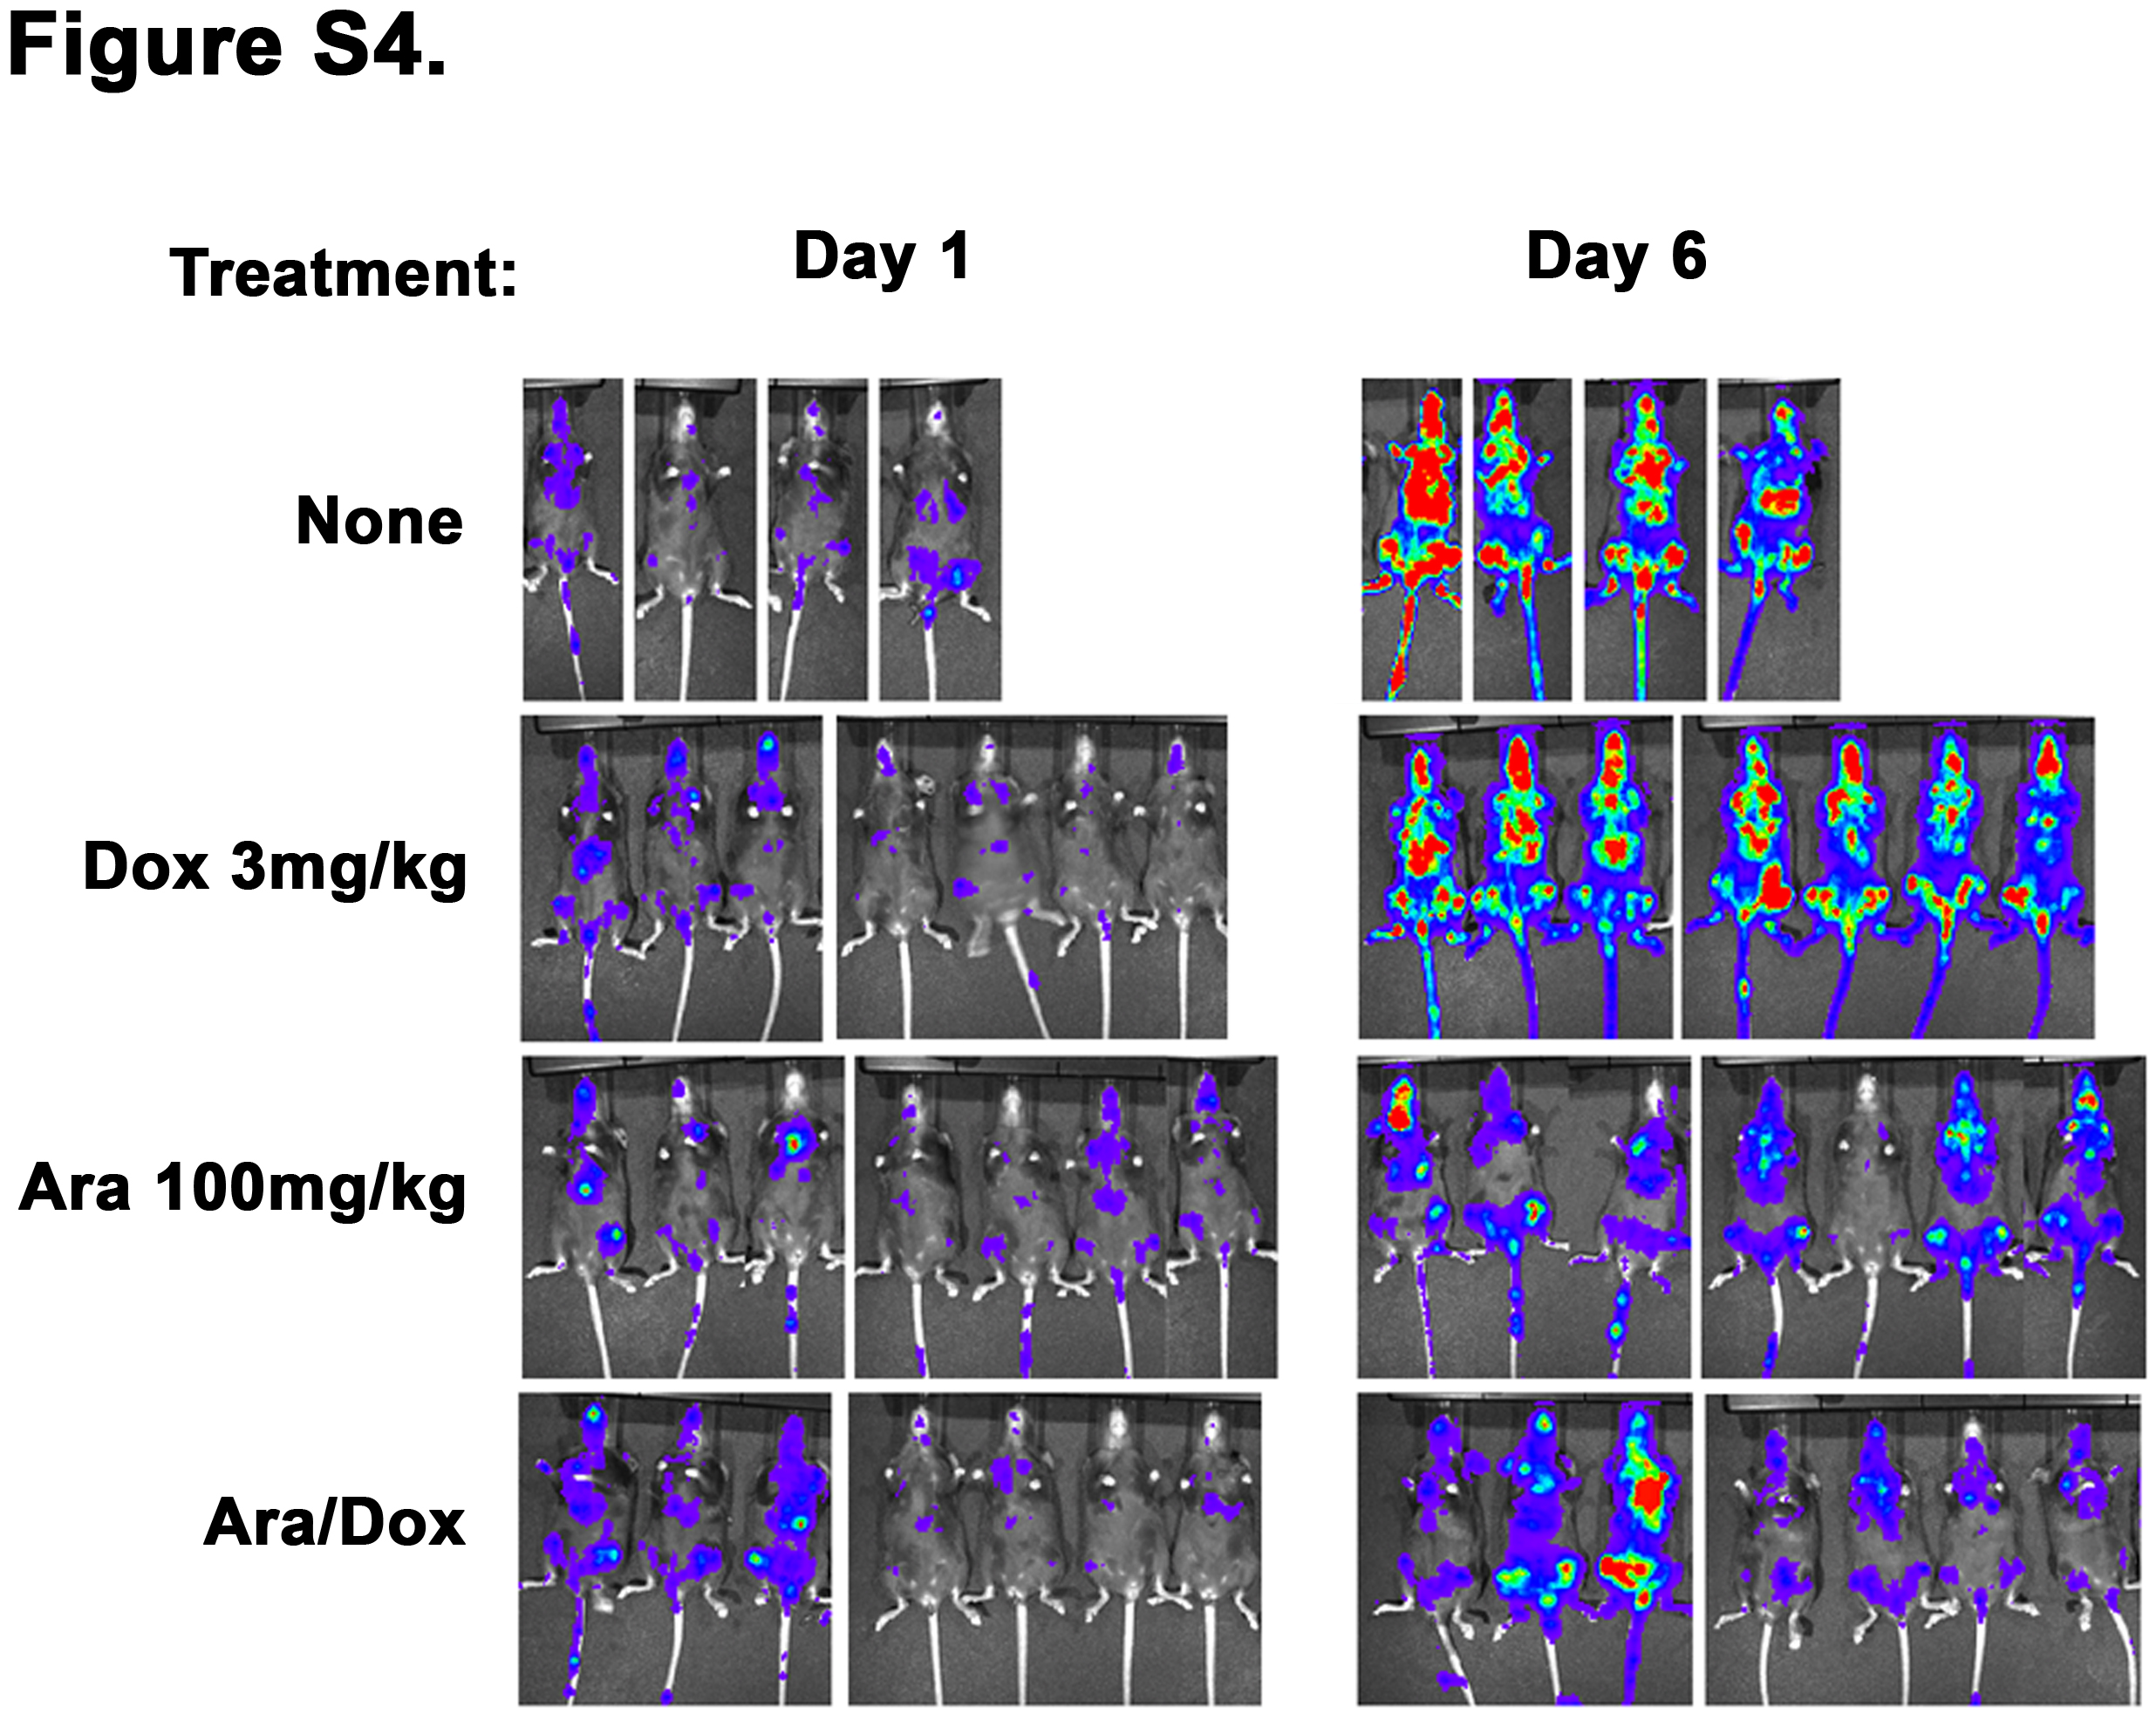
Flt3-ITD expressing leukemias do not benefit from doxorubicin treatment. MLL-ENL and Flt3-ITD leukemia as in Figure 6A. Animals were injected with the leukemia and one week later imaged for luciferase activity (D1). Animals were then treated as indicated for 5 days and on day 6 were imaged again (D6). Representative images of treated and control mice are shown.
Acknowledgments
We gratefully acknowledge Teresa Mascenik, Meredith Taylor and Kristin Lehet for technical assistance, Karen Klein for her editorial assistance. J.Z. is the Andrew Seligson Memorial Fellow at CSHL. This work was supported by a Specialized Center of Research grant from the Leukemia and Lymphoma Society, generous gifts from the Don Monti Memorial Research Foundation, the Ambassador Felix Schnyder Memorial Grant of the Lauri Strauss Leukemia Foundation and the Wake Forest University Comprehensive Cancer Center. Additional support provided by Award Number P30CA012197 from the National Cancer Institute. The content is solely the responsibility of the authors and does not necessarily represent the official views of the National Cancer Institute or the National Institutes of Health.
Footnotes
Conflict of Interest Disclosure:
No financial interest/relationships with financial interest relating to the topic of this article have been declared.
Publisher's Disclaimer: This is a PDF file of an unedited manuscript that has been accepted for publication. As a service to our customers we are providing this early version of the manuscript. The manuscript will undergo copyediting, typesetting, and review of the resulting proof before it is published in its final citable form. Please note that during the production process errors may be discovered which could affect the content, and all legal disclaimers that apply to the journal pertain.
References
- 1.Byrd JC, Mrozek K, Dodge RK, et al. Pretreatment cytogenetic abnormalities are predictive of induction success, cumulative incidence of relapse, and overall survival in adult patients with de novo acute myeloid leukemia: results from Cancer and Leukemia Group B (CALGB 8461) Blood. 2002;100:4325–4336. doi: 10.1182/blood-2002-03-0772. [DOI] [PubMed] [Google Scholar]
- 2.Grimwade D, Walker H, Oliver F, et al. The importance of diagnostic cytogenetics on outcome in AML: analysis of 1,612 patients entered into the MRC AML 10 trial. The Medical Research Council Adult and Children's Leukaemia Working Parties. Blood. 1998;92:2322–2333. [PubMed] [Google Scholar]
- 3.Slovak ML, Kopecky KJ, Cassileth PA, et al. Karyotypic analysis predicts outcome of preremission and postremission therapy in adult acute myeloid leukemia: a Southwest Oncology Group/Eastern Cooperative Oncology Group Study. Blood. 2000;96:4075–4083. [PubMed] [Google Scholar]
- 4.Haferlach T. Molecular genetic pathways as therapeutic targets in acute myeloid leukemia. Hematology Am Soc Hematol Educ Program. 2008:400–411. doi: 10.1182/asheducation-2008.1.400. [DOI] [PubMed] [Google Scholar]
- 5.Schlenk RF, Dohner K, Krauter J, et al. Mutations and treatment outcome in cytogenetically normal acute myeloid leukemia. N Engl J Med. 2008;358:1909–1918. doi: 10.1056/NEJMoa074306. [DOI] [PubMed] [Google Scholar]
- 6.Rombouts WJ, Blokland I, Lowenberg B, Ploemacher RE. Biological characteristics and prognosis of adult acute myeloid leukemia with internal tandem duplications in the Flt3 gene. Leukemia. 2000;14:675–683. doi: 10.1038/sj.leu.2401731. [DOI] [PubMed] [Google Scholar]
- 7.Thiede C, Steudel C, Mohr B, et al. Analysis of FLT3-activating mutations in 979 patients with acute myelogenous leukemia: association with FAB subtypes and identification of subgroups with poor prognosis. Blood. 2002;99:4326–4335. doi: 10.1182/blood.v99.12.4326. [DOI] [PubMed] [Google Scholar]
- 8.Frohling S, Schlenk RF, Breitruck J, et al. Prognostic significance of activating FLT3 mutations in younger adults (16 to 60 years) with acute myeloid leukemia and normal cytogenetics: a study of the AML Study Group Ulm. Blood. 2002;100:4372–4380. doi: 10.1182/blood-2002-05-1440. [DOI] [PubMed] [Google Scholar]
- 9.Gilliland DG, Griffin JD. The roles of FLT3 in hematopoiesis and leukemia. Blood. 2002;100:1532–1542. doi: 10.1182/blood-2002-02-0492. [DOI] [PubMed] [Google Scholar]
- 10.Kiyoi H, Towatari M, Yokota S, et al. Internal tandem duplication of the FLT3 gene is a novel modality of elongation mutation which causes constitutive activation of the product. Leukemia. 1998;12:1333–1337. doi: 10.1038/sj.leu.2401130. [DOI] [PubMed] [Google Scholar]
- 11.Li L, Piloto O, Nguyen HB, et al. Knock-in of an internal tandem duplication mutation into murine FLT3 confers myeloproliferative disease in a mouse model. Blood. 2008;111:3849–3858. doi: 10.1182/blood-2007-08-109942. [DOI] [PMC free article] [PubMed] [Google Scholar]
- 12.Kim HG, Kojima K, Swindle CS, et al. FLT3-ITD cooperates with inv(16) to promote progression to acute myeloid leukemia. Blood. 2008;111:1567–1574. doi: 10.1182/blood-2006-06-030312. [DOI] [PMC free article] [PubMed] [Google Scholar]
- 13.Zhang W, Konopleva M, Shi YX, et al. Mutant FLT3: a direct target of sorafenib in acute myelogenous leukemia. J Natl Cancer Inst. 2008;100:184–198. doi: 10.1093/jnci/djm328. [DOI] [PubMed] [Google Scholar]
- 14.Pratz KW, Cortes J, Roboz GJ, et al. A pharmacodynamic study of the FLT3 inhibitor KW-2449 yields insight into the basis for clinical response. Blood. 2009;113:3938–3946. doi: 10.1182/blood-2008-09-177030. [DOI] [PMC free article] [PubMed] [Google Scholar]
- 15.Knapper S, Burnett AK, Littlewood T, et al. A phase 2 trial of the FLT3 inhibitor lestaurtinib (CEP701) as first-line treatment for older patients with acute myeloid leukemia not considered fit for intensive chemotherapy. Blood. 2006;108:3262–3270. doi: 10.1182/blood-2006-04-015560. [DOI] [PubMed] [Google Scholar]
- 16.Stone RM, DeAngelo DJ, Klimek V, et al. Patients with acute myeloid leukemia and an activating mutation in FLT3 respond to a small-molecule FLT3 tyrosine kinase inhibitor, PKC412. Blood. 2005;105:54–60. doi: 10.1182/blood-2004-03-0891. [DOI] [PubMed] [Google Scholar]
- 17.Smith BD, Levis M, Beran M, et al. Single-agent CEP-701, a novel FLT3 inhibitor, shows biologic and clinical activity in patients with relapsed or refractory acute myeloid leukemia. Blood. 2004;103:3669–3676. doi: 10.1182/blood-2003-11-3775. [DOI] [PubMed] [Google Scholar]
- 18.Hayakawa F, Towatari M, Kiyoi H, et al. Tandem-duplicated Flt3 constitutively activates STAT5 and MAP kinase and introduces autonomous cell growth in IL-3-dependent cell lines. Oncogene. 2000;19:624–631. doi: 10.1038/sj.onc.1203354. [DOI] [PubMed] [Google Scholar]
- 19.Kajiguchi T, Chung EJ, Lee S, et al. FLT3 regulates beta-catenin tyrosine phosphorylation, nuclear localization, and transcriptional activity in acute myeloid leukemia cells. Leukemia. 2007;21:2476–2484. doi: 10.1038/sj.leu.2404923. [DOI] [PubMed] [Google Scholar]
- 20.Seedhouse CH, Hunter HM, Lloyd-Lewis B, et al. DNA repair contributes to the drug-resistant phenotype of primary acute myeloid leukaemia cells with FLT3 internal tandem duplications and is reversed by the FLT3 inhibitor PKC412. Leukemia. 2006;20:2130–2136. doi: 10.1038/sj.leu.2404439. [DOI] [PubMed] [Google Scholar]
- 21.Wang L, Wang J, Blaser BW, et al. Pharmacologic inhibition of CDK4/6: mechanistic evidence for selective activity or acquired resistance in acute myeloid leukemia. Blood. 2007;110:2075–2083. doi: 10.1182/blood-2007-02-071266. [DOI] [PubMed] [Google Scholar]
- 22.Sallmyr A, Fan J, Datta K, et al. Internal tandem duplication of FLT3 (FLT3/ITD) induces increased ROS production, DNA damage, and misrepair: implications for poor prognosis in AML. Blood. 2008;111:3173–3182. doi: 10.1182/blood-2007-05-092510. [DOI] [PubMed] [Google Scholar]
- 23.Bagrintseva K, Geisenhof S, Kern R, et al. FLT3-ITD-TKD dual mutants associated with AML confer resistance to FLT3 PTK inhibitors and cytotoxic agents by overexpression of Bcl-x(L) Blood. 2005;105:3679–3685. doi: 10.1182/blood-2004-06-2459. [DOI] [PubMed] [Google Scholar]
- 24.Fukuda S, Singh P, Moh A, et al. Survivin mediates aberrant hematopoietic progenitor cell proliferation and acute leukemia in mice induced by internal tandem duplication of Flt3. Blood. 2009;114:394–403. doi: 10.1182/blood-2008-11-188714. [DOI] [PMC free article] [PubMed] [Google Scholar]
- 25.Zuber J, Radtke I, Pardee TS, et al. Mouse models of human AML accurately predict chemotherapy response. Genes Dev. 2009;23:877–889. doi: 10.1101/gad.1771409. [DOI] [PMC free article] [PubMed] [Google Scholar]
- 26.Barabe F, Kennedy JA, Hope KJ, Dick JE. Modeling the initiation and progression of human acute leukemia in mice. Science. 2007;316:600–604. doi: 10.1126/science.1139851. [DOI] [PubMed] [Google Scholar]
- 27.Burgess DJ, Doles J, Zender L, et al. Topoisomerase levels determine chemotherapy response in vitro and in vivo. Proc Natl Acad Sci U S A. 2008;105:9053–9058. doi: 10.1073/pnas.0803513105. [DOI] [PMC free article] [PubMed] [Google Scholar]
- 28.Lee BD, Sevcikova S, Kogan SC. Dual treatment with FLT3 inhibitor SU11657 and doxorubicin increases survival of leukemic mice. Leuk Res. 2007;31:1131–1134. doi: 10.1016/j.leukres.2006.11.012. [DOI] [PMC free article] [PubMed] [Google Scholar]
- 29.Koo HM, McWilliams MJ, Alvord WG, Vande Woude GF. Ras oncogene-induced sensitization to 1-beta-D-arabinofuranosylcytosine. Cancer Res. 1999;59:6057–6062. [PubMed] [Google Scholar]
- 30.Koo HM, Monks A, Mikheev A, et al. Enhanced sensitivity to 1-beta-D-arabinofuranosylcytosine and topoisomerase II inhibitors in tumor cell lines harboring activated ras oncogenes. Cancer Res. 1996;56:5211–5216. [PubMed] [Google Scholar]
- 31.Meyer M, Rubsamen D, Slany R, et al. Oncogenic RAS enables DNA damage- and p53-dependent differentiation of acute myeloid leukemia cells in response to chemotherapy. PLoS One. 2009;4:e7768. doi: 10.1371/journal.pone.0007768. [DOI] [PMC free article] [PubMed] [Google Scholar]
- 32.Nervi B, Ramirez P, Rettig MP, et al. Chemosensitization of acute myeloid leukemia (AML) following mobilization by the CXCR4 antagonist AMD3100. Blood. 2009;113:6206–6214. doi: 10.1182/blood-2008-06-162123. [DOI] [PMC free article] [PubMed] [Google Scholar]
- 33.Gale RE, Green C, Allen C, et al. The impact of FLT3 internal tandem duplication mutant level, number, size, and interaction with NPM1 mutations in a large cohort of young adult patients with acute myeloid leukemia. Blood. 2008;111:2776–2784. doi: 10.1182/blood-2007-08-109090. [DOI] [PubMed] [Google Scholar]
- 34.Shih LY, Huang CF, Wu JH, et al. Internal tandem duplication of FLT3 in relapsed acute myeloid leukemia: a comparative analysis of bone marrow samples from 108 adult patients at diagnosis and relapse. Blood. 2002;100:2387–2392. doi: 10.1182/blood-2002-01-0195. [DOI] [PubMed] [Google Scholar]
- 35.Schnittger S, Schoch C, Dugas M, et al. Analysis of FLT3 length mutations in 1003 patients with acute myeloid leukemia: correlation to cytogenetics, FAB subtype, and prognosis in the AMLCG study and usefulness as a marker for the detection of minimal residual disease. Blood. 2002;100:59–66. doi: 10.1182/blood.v100.1.59. [DOI] [PubMed] [Google Scholar]
- 36.Fernandez HF, Sun Z, Yao X, et al. Anthracycline dose intensification in acute myeloid leukemia. N Engl J Med. 2009;361:1249–1259. doi: 10.1056/NEJMoa0904544. [DOI] [PMC free article] [PubMed] [Google Scholar]
- 37.Ravandi F, Cortes JE, Jones D, et al. Phase I/II study of combination therapy with sorafenib, idarubicin, and cytarabine in younger patients with acute myeloid leukemia. J Clin Oncol. 2010;28:1856–1862. doi: 10.1200/JCO.2009.25.4888. [DOI] [PMC free article] [PubMed] [Google Scholar]
- 38.Wiederschain D, Kawai H, Gu J, Shilatifard A, Yuan ZM. Molecular basis of p53 functional inactivation by the leukemic protein MLL-ELL. Mol Cell Biol. 2003;23:4230–4246. doi: 10.1128/MCB.23.12.4230-4246.2003. [DOI] [PMC free article] [PubMed] [Google Scholar]
- 39.Wiederschain D, Kawai H, Shilatifard A, Yuan ZM. Multiple mixed lineage leukemia (MLL) fusion proteins suppress p53-mediated response to DNA damage. J Biol Chem. 2005;280:24315–24321. doi: 10.1074/jbc.M412237200. [DOI] [PubMed] [Google Scholar]
- 40.Neubauer A, Maharry K, Mrozek K, et al. Patients with acute myeloid leukemia and RAS mutations benefit most from postremission high-dose cytarabine: a Cancer and Leukemia Group B study. J Clin Oncol. 2008;26:4603–4609. doi: 10.1200/JCO.2007.14.0418. [DOI] [PMC free article] [PubMed] [Google Scholar]
- 41.Yin B, Kogan SC, Dickins RA, Lowe SW, Largaespada DA. Trp53 loss during in vitro selection contributes to acquired Ara-C resistance in acute myeloid leukemia. Exp Hematol. 2006;34:631–641. doi: 10.1016/j.exphem.2006.01.015. [DOI] [PubMed] [Google Scholar]
- 42.Vousden KH, Lu X. Live or let die: the cell's response to p53. Nat Rev Cancer. 2002;2:594–604. doi: 10.1038/nrc864. [DOI] [PubMed] [Google Scholar]
- 43.Janicke RU, Sohn D, Schulze-Osthoff K. The dark side of a tumor suppressor: anti-apoptotic p53. Cell Death Differ. 2008;15:959–976. doi: 10.1038/cdd.2008.33. [DOI] [PubMed] [Google Scholar]
Associated Data
This section collects any data citations, data availability statements, or supplementary materials included in this article.
Supplementary Materials
Flt3-ITD expression in MLL-ENL-induced leukemias. Western blot showing expression of the Flt3-ITD in MLL-ENL-induced leukemias is shown. Western blot showing increased phospho-STAT5 was performed in leukemia cells maintained in serum or starved for 4 hours and re-fed as indicated.
Flt3-ITD expressing cells have higher baseline γH2AX foci. A) Immunofluorescence staining for phospho-γ-H2AX. Cells were treated with the indicated therapy for 4 hours, fixed, permeabilized and stained with anti-γH2AX antibody. B) Quantitation of phospho-γ-H2AX foci. Cells were exposed to the indicated therapy for 4 hours. Nuclei were stained for phospho-γ-H2AX and scored on a scale of 0 to 3 for the amount of foci present (0=none, 1=few, 2=moderate, 3=many). Bar graphs represent the mean score for each condition. The experiment was repeated three times, a representative example is shown.
The Flt3-ITD is efficiently expressed in p53 null leukemias. MLL-ENL expressing leukemias were generated in p53 null FLCs and then infected with the Flt3-ITD expressing vector. A) Cytokine independent growth was assessed by flow cytometry in media that contained or lacked murine SCF, iL6 and iL3. B) Western blot with anti-Flt3 is shown.
Flt3-ITD expressing leukemias do not benefit from doxorubicin treatment. MLL-ENL and Flt3-ITD leukemia as in Figure 6A. Animals were injected with the leukemia and one week later imaged for luciferase activity (D1). Animals were then treated as indicated for 5 days and on day 6 were imaged again (D6). Representative images of treated and control mice are shown.