Abstract
An Independent Component Analysis (ICA) based approach has been developed to estimate the orientations of two or three crossing fibers in a voxel to conduct human brain streamline tractography from diffusion data acquired along 25 gradient directions at a b-value of 1000 s/mm2. The approach relies on unmixing signals from fibers mixed within, and spread over, a small cluster of 11-voxels. Simulation studies of diffusion data for 2–3 crossing fibers at signal-to-noise ratios of 15 and 30 suggest the accuracy to determine inter-fiber angles with ICA is similar to that attained by a Gaussian mixture and other multi-compartmental models but at two orders of magnitude faster computational speed. Compared to previous multi-compartmental models, ICA visually shows good recovery of fiber orientations and tracts in the crossing region of commonly available orthogonal and 60° phantom diffusion datasets. 3T MRI human studies show that in contrast to conventional streamline tractography and a multi-compartment model, ICA shows better recovery of the continuity of fronto-occipital tracts and cingulum from regions where these tracts are mixed with corpus callosum and other pathways.
Keywords: Independent Component Analysis (ICA), DTI, Multi-fiber tractography
INTRODUCTION
Streamline tractography in Diffusion Tensor Imaging (DTI) relies on a rank-2 tensor (3×3 matrix) model of a voxel’s diffusion field, where the diffusion field is defined as displacements of protons along directions in 3D space averaged over a given time. The tensor’s three eigenvalues are used to compute metrics such as fractional anisotropy (FA) and mean diffusivity (MD) (1–8). Tractography is initiated from a voxel by stepping along the direction of the eigenvector associated with the largest eigenvalue, and continued generally till either the FA falls below a specified threshold or the stepping direction shows an abrupt angular change exceeding a specified threshold (2–6). However, when multiple fibers (or tracts) cross in a voxel, the primary eigenvector obtained by DTI is likely to point in an erroneous direction -- biased toward the highest density fibers -- causing many tracts to propagate in the wrong direction.
Many strategies have been devised to solve the ‘fiber-crossing’ problem. The first step is to estimate the orientations of multiple fibers in a voxel. Tracts could then be propagated along the direction of each individual fiber. One such approach is diffusion spectrum imaging or DSI (9–12), which estimates orientations from p(r), the probability density function (PDF) of the diffusion field, by Fourier transforming samples S(q) in q-space given by:
| [1] |
where q = γGδ, γ is the gyromagnetic ratio, G the diffusion gradient, delta; the duration of the diffusion gradient pulses and S0 is the signal without the diffusion gradients. A simplification of DSI is q-ball imaging (13,14), which estimates the orientation distribution function (ODF) within a voxel by encoding only the angular portion of the PDF on the surface of a sphere. If the diffusion field of all single fibers within the human brain can be considered to be identical, the diffusion signal becomes a convolution of the ODF and the diffusion field of a single fiber. The ODF is recovered by a deconvolution operation (15–18) and fiber directions are selected from local maxima in the ODF under preset criteria.
Tuch et al. (10) used a multi-compartmental model to estimate parameters of multiple tensors mixed in a voxel. The diffusion signal was modeled as:
| [2] |
where fj is the volume fraction of the j-th compartment with diffusion tensor Dj, b = (γGδ)2 the b-value, t is the effective diffusion time and r is the direction of the diffusion gradient. However, this model and other similar models (19,20,21) become unstable with increasing number of parameters, and have difficulty converging for more than two fibers per voxel.
Behrens et al. (22) simplified the multiple tensor model by using the direction of the primary eigenvalue, instead of the full tensor, to represent the diffusion field as:
| [3] |
where d is the diffusivity and ‘V’ is a simplified representation of the diffusion tensor by a 3×3 matrix whose only non-zero term is the first eigenvalue, i.e.,
and rotates this simplified tensor to align with the direction of the j-th fiber. The first term in Eq. [3] is an isotropic diffusion term to model the diffusion of free water in the voxel.
We have investigated a novel approach where Independent Component Analysis (ICA) is used to recover the directions of individual fibers from a mixture of fibers within a voxel. ICA is commonly used to separate signals of multiple sources mixed within multiple sensors (23). Considering the sampled diffusion field of a fiber as the source and a voxel as the sensor, separating multiple sources mixed in multiple voxels becomes amenable to ICA. Assuming up to 3 fibers in a voxel, here we show how ICA can be used to estimate the orientations of individual fibers from the measured diffusion signal. Details of estimating orientations within the constraints imposed by ICA, simulation and phantom studies to develop and validate the methodology, and results of experimental studies with human data are presented in the following sections.
THEORY
The measurements xi = Si/Si0 for any voxel ‘i’ form a 1 × g vector for ‘g’ gradient directions. Assuming ‘k’ fibers cross over a small neighborhood of ‘n’ voxels (while maintaining their orientation), ‘n’ independent measurements x1…xn of the k sources s1…sk are obtained as (24):
| [4] |
where aij denote the mixing fraction of the j-th source in the i-th voxel. In vector-matrix notation x = As or s = A−1x, i.e., the sources, assumed independent, could be estimated by finding the right linear combination of the measurements xi. For example, the linear combination yj = Σwij xi would be an estimate of one of the sources if wij were one of the rows of A−1 However A−1 is unknown. The premise of ICA is that if sources are non-Gaussian, the linear combination wij that maximizes the non-Gaussianity of yj will recover a source (23). This is because sums of non-Gaussian random variables are closer to Gaussian than the original variables. Therefore, a linear combination of non-Gaussian variables will become maximally non-Gaussian when it equals one of the variables (23). Additional sources up to a specified level ‘k’ could be recovered similarly from ‘k’ maximally non-Gaussian linear combinations of xi provided k≤n.
For practical implementation, we consider a center voxel surrounded by n-1 voxels, start with a random set of wij, and maximize non-Gaussianity of Σwij xi. The fastICA (25) version 2.5 (http://www.cis.hut.fi/projects/ica/fastica/), which relies on an approximation of negentropy to maximize non-Gaussianity, was used. The approximate negentropy J(ν) of a random variable ν is a metric that is always positive for a non-Gaussian but zero for a Gaussian variable, and defined as:
| (5) |
where E denotes the expectation value, G is any non-quadratic function (G(ν)=logcosh(ν) was used in this work) and ν′ is a Gaussian variable with the same mean and variance as v (23). Multiple sources were estimated in parallel using symmetric orthogonalization. As the source magnitude and mixing fraction always appear as a product, individual source variance and aij or wij cannot be estimated by this version of ICA (23).
Two conditions must be met for ICA to be applicable: 1) the sources must be independent and 2) the sources must be non-Gaussian. Additionally, in our current implementation, the number of sources, i.e., the number of fibers in the voxel under consideration, must be specified.
As diffusion of water molecules is limited to approximately 10 microns around axons, and voxels are on the order of millimeters, it is unlikely that molecules diffusing around axons of one fiber will have any significant interaction or exchange with molecules diffusing around axons of another fiber. Thus, it is reasonable to assume that the sources are independent. Non-Gaussianity was established by a statistical analysis of experimental diffusion data as described below.
METHOD
Under Institutional Review Board (IRB) approval, DTI data were acquired from 12 healthy human volunteers on a 3T GE Signa HDx MRI using a multi-slice, twice refocussed sequence with 128×128 single-shot EPI (echo planar imaging) readout, 25 gradient directions with b=1000s/mm2, one b=0 image, TR/TE=8000ms/86.1ms, Field of View (FOV) 26cm, two averages, 4mm thick 28 contiguous axial slices covering the entire head with 2.03 × 2.03 × 4 mm3 voxels in approximately 7 minutes. Though isotropic voxels are generally preferable, 4mm thick slices were acquired to shorten the data acquisition time by a factor of 2 and reduce movement artifacts. The b=1000s/mm2 images were corrected for distortions and misregistration due to eddy currents and any movements using the eddy current correction module of FSL (The Oxford Centre for Functional Magnetic Resonance Imaging of the Brain Software Library: http://www.fmrib.ox.ac.uk/fsl/fdt). An FA map was reconstructed using an in-house developed DTI software incorporating a signal-to-noise-ratio (SNR) weighted multivariate least-squares fitting approach (26). Tracts within the corpus callosum (cc) likely to contain single fibers per voxel were extracted by a relatively high FA≥0.6 thresholded whole-brain streamline tractography. An example of these voxels and tracts is shown in Fig. 1a. Bootstrapping (100 trials) was used to measure the statistics of the normalized diffusion signal S/S0. At each trial, the negentropy was computed for 40 voxels selected randomly from among the FA≥0.6 identified cc voxels of 12 subjects (40×25 = 1000 data-points for 25 gradient directions). The computed mean negentropy was 2.6036 with a variance of 0.000108, confirming the non-Gaussianity of the sources (23). An example of the PDF of the normalized diffusion signal is presented in Fig. 1b.
Fig. 1.
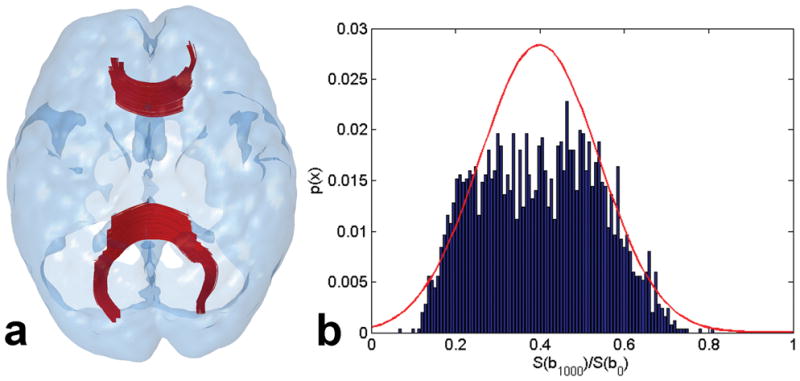
(a) An example of voxels with FA≥0.6 within the corpus callosum (cc) of a human subject. These voxels are assumed to contain one fiber per voxel. (b) An example of the PDF of the diffusion field measured by 25 gradients in 40 such voxels selected randomly from among 12 subjects. The PDF suggests non-Gaussianity of the diffusion measurements. For comparison, the corresponding Gaussian distribution is shown in red.
Simulation Studies
A Monte Carlo simulation study was conducted to evaluate the accuracy of ICA to recover up to 3 fibers in a voxel with diffusion data acquired at b=1000 s/mm2 from the same 25 gradient directions used in human studies. The mixture model of Eq. [2] was used to compute the multi-fiber synthetic data assuming diffusion within each compartment is fully described by a rank-2 tensor and the compartments are independent (10). Contributions from each compartment were summed along each gradient direction in proportion to the compartment’s volume fraction fj. The three eigenvalues of each tensor were chosen randomly from the population of corresponding three eigenvalues in the FA≤0.6 identified cc voxels of 12 subjects assumed to comprise a single fiber. The mean and standard deviation(sd) of the three eigenvalues were: 1.68(0.18), 0.37(0.07), and 0.275(0.075) × 0.001mm2/s, respectively.
Beginning with a random orientation for one fiber, the inter-fiber angles were selected randomly to lie within the 10–90° range and distributed equally within each 10° interval (1000 trials per 10° interval). For three fibers, the two inter-fiber angles were equal. Rician noise was added to create diffusion datasets with SNRs of 15 and 30. The fibers were modeled to cross over a small neighborhood of 11 voxels, 3×3 voxels in the x-y plane and one voxel above and below the center voxel along the z-axis. This particular neighborhood configuration was selected commensurate with the 2×2×4 mm3 voxel size. If data acquisition were isotropic, for example 2×2×2 mm3 voxels, a 3×3×3 neighborhood would be more appropriate. Random values in the range 0.1 to 0.9 were assigned to the mixing fractions fj of Eq.[2] such that Σfj = 1
The accuracy of recovering fiber orientations was assessed by the absolute error between the actual and estimated fiber orientations. ICA was compared to the Gaussian mixture model (GMX) of Eq.[2] and a simplified Behrens model (Behrens) where the isotropic term of Eq.[3] was dropped to become consistent with Eq.[2] used to generate synthetic data.
ICA was also applied to experimentally measured diffusion fields of two randomly selected voxels from among the FA≥0.6 identified cc voxels. The sources, sampled from regions such that their orientations would be >10° apart, were mixed in a cluster of 11 voxels.
The orientation of sources was kept constant within the 11-voxel neighborhood in the above studies. Additional studies were conducted to investigate the accuracy of ICA to recover the orientation of two fibers when one fiber bends by a given Δθ = 10, 20, 30 or 40° in 6/11 voxels (3 voxels on one side and 3 on the other side of the central voxel). The crossing angle within the central and the remaining 4 voxels of the neighborhood was fixed at 60°.
Application to a Crossing-Fiber Phantom dataset
ICA was also applied to the orthogonal and 60° crossing dataset created by the ISMRM Diffusion and Perfusion Study group (http://cubric.psych.cf.ac.uk/commondti). As the number of fibers per voxel must be specified in our current implementation of ICA, an F-test was applied to select the best-fitting number of fibers (either 1, 2 or more than 2) in each voxel (19). The F-test compares the residual error between the modeled and experimental data while accounting for the number of variables in each model at a specified statistical significance or p-value. To make the residue minimization computationally efficient, Behrens model was modified as:
| [5] |
under the constraint:
| [6] |
where fCSF and fGM represent the volume fractions, dCSF and dGM the diffusivities of CSF and gray matter (GM), respectively, and m=k, the number of fibers. Here we assume the diffusion profile of gray matter to be isotropic. As fCSF and fGM would be relatively small in the mostly white-matter voxels, minimizing the square of the residue Z, where
| [7] |
under the constraint
| [8] |
becomes computationally efficient as dWM may be estimated from the first eigenvalue of the FA≥0.6 identified cc fibers, DTI may be used to determine the orientation if the voxel is assigned one fiber, and ICA to determine the orientations of 2 or 3 fibers, leaving only fWMj as the unknowns. Thus, instead of commonly used non-linear optimization, model fitting can now be accomplished by linear least squares estimation, guaranteeing a global minimum. Small contributions from CSF and GM are accommodated by Eq.[8].
The p-value was chosen by testing it against the true number of fibers in voxels of the noise-free orthogonal fiber crossing data. Though it is possible that noise may affect the optimal choice of p-value, noise-free data were selected as they provide the best estimate of ground truth. Voxels lying on the vertical and horizontal center lines away from the crossing region were considered as single fiber voxels and those in the central crossing region were considered as containing two fibers. The accuracy of the F-test to correctly identify the number of fibers in these voxels as a function of p-values was: 83%, 84%, 93%, 84% and 62% at p≤0.01, 0.005, 0.001, 0.0005, and 0.0001, respectively. At the relatively low p-values, e.g., 0.0001, many voxels containing 1 fiber were incorrectly labeled as containing 2 or more fibers while at the relatively high p-values, e.g., 0.01, many voxels containing 2 fibers were incorrectly labeled as 1 fiber. Thus, p≤0.001 was selected for the phantom studies. The same p-value was used in human studies as it assigned one fiber to >90% of the FA≥0.6 identified cc voxels in 12 human subjects, consistent with the high likelihood of one fiber in these voxels.
Human Studies
Acquisition of diffusion data from 12 human volunteers using a 3T MRI system with 25 gradient directions has been described earlier. After an initial FA threshold (≥0.05) to remove voxels containing large fractions of CSF, GM and noise, a combined FA and MD threshold was derived from a k-means clustering approach relying on FA and MD as two features to segment the brain into three clusters corresponding to WM, GM and CSF. The centroid of the cluster with the lowest FA and highest MD in 5 healthy subjects was used to identify voxels likely to contain a large fraction of CSF. The mean (sd) values of FA and MD for this cluster in 5 subjects were 0.1(0.003) and 1.4(0.12)×10−3 mm2/s, respectively. All voxels with FA≤0.1 and MD≥0.0014 mm2/s were subsequently masked.
Commonly used streamline tractography (3–8) was modified to accommodate multiple orientations in voxels. One, two or three orientations were assigned to a seed located at the center of each voxel depending on the outcome of the F-test, and tracts were grown along each assigned direction (and at 180° to each direction) in 0.2mm steps using Euler’s method to recompute the propagation angle every 0.2mm. Though Runge-Kutta second or fourth order integration methods achieve higher accuracy than Euler’s method, the difference is relatively small (27). Euler’s method was therefore used as it is at least four times faster than Runge-Kutta. Additionally, as recomputing new orientations with ICA by interpolating b=0 and all b=1000s/mm2 images after each 0.2mm step would be computationally expensive, an interpolation of ICA precomputed orientation vectors in 6/8 nearest neighbors was used to update the orientation after each step. Six instead of commonly used 8 neighbors were selected to reduce eigenvector jitter by omitting the two ‘outlier’ neighbors showing the highest deflection with respect to the incoming tract direction. For neighbors assigned multiple orientations, the orientation corresponding to the smallest deflection with respect to the incoming tract was used in the interpolation. Tracts terminated either upon entering voxels that were identified by the FA and MD thresholds to contain a large fraction of CSF, or if the step-wise deflection or cumulative deflections in a voxel exceeded 45°.
From simulation studies, the total computation time to estimate orientations per voxel was more than 100-times faster with ICA than Behrens or GMX. It took approximately 10–15-min to estimate orientations in whole-brain voxels with ICA on an Intel Xeon Quad-core 2.66GHz workstation for approximately 60,000–80,000 voxels acquired in our 28-slice human brain study (2.03mm×2.03mm×4mm voxels).
RESULTS
The mean and sd of the absolute error between the actual and estimated inter-fiber angles for 2 and 3 fibers per voxel using GMX, Behrens, and ICA are summarized in Fig. 2 at SNRs=30 and 15. All three approaches show similar results except that GMX appears to show the smallest errors at relatively small inter-fiber angles (15–35° range), ICA appears to show the smallest errors at the intermediate to high angles (above 35°) for 2 fibers, whereas Behrens appears to show the smallest errors at angles above 65° for 3 fibers. Though the performances are similar, it is noteworthy that ICA was more than two orders of magnitude faster than the other two approaches. Results of ICA where one fiber bends by a small angle (ranging from 10–40°) in 6/11 voxels are shown in Fig. 2(e), suggesting that such bending added only an additional mean error of 1–10° to the estimate of orientation in the central voxel.
Fig. 2.
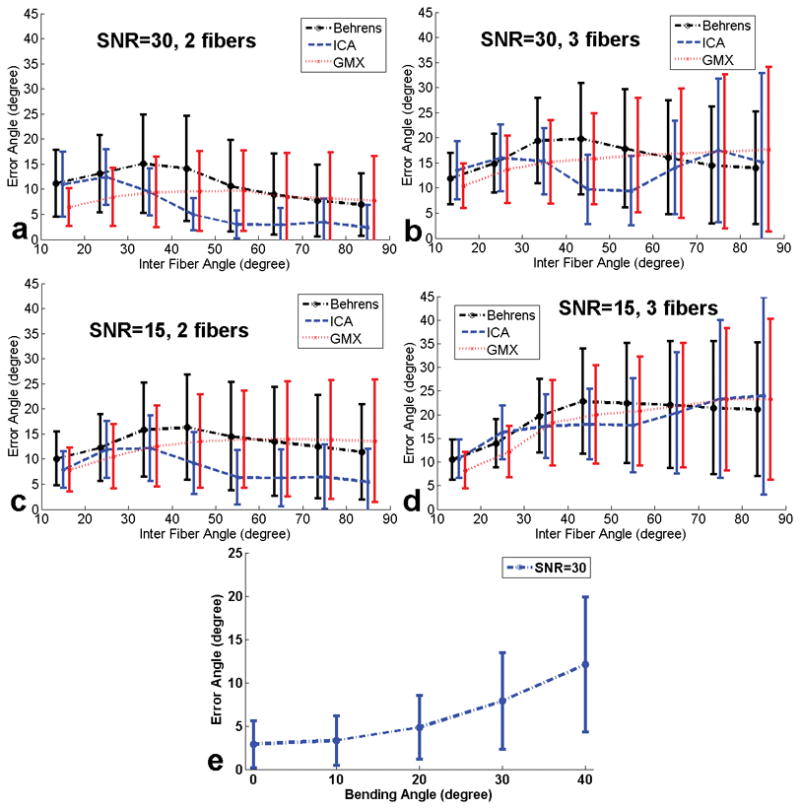
The mean and standard deviation of the absolute error between the actual and estimated inter-fiber angles for 2 and 3 fibers per voxel using the Gaussian Mixture model (GMX), Behrens model (Behrens), and ICA. (a) SNR=30, two fibers; (b) SNR=30, three fibers; (c) SNR=15, two fibers; (d) SNR=15, three fibers. (e) Error between the actual (60°) and ICA estimated crossing angle as a function of bending angle where one of two fibers bends in 6/11 voxels. The 0-degree error is for no bending.
Results of unmixing samples drawn from the cc voxels are presented in Fig. 3. The experimental profiles of two such sources are shown in Fig. 3a and the ICA unmixed profiles are shown in Fig. 3b. The mean(sd) of the correlation coefficient between the recovered and measured profiles and the error in the angle between the primary eigenvectors for 20 such samples were 0.98(0.006) and 3.44(2.03)°, respectively.
Fig. 3.
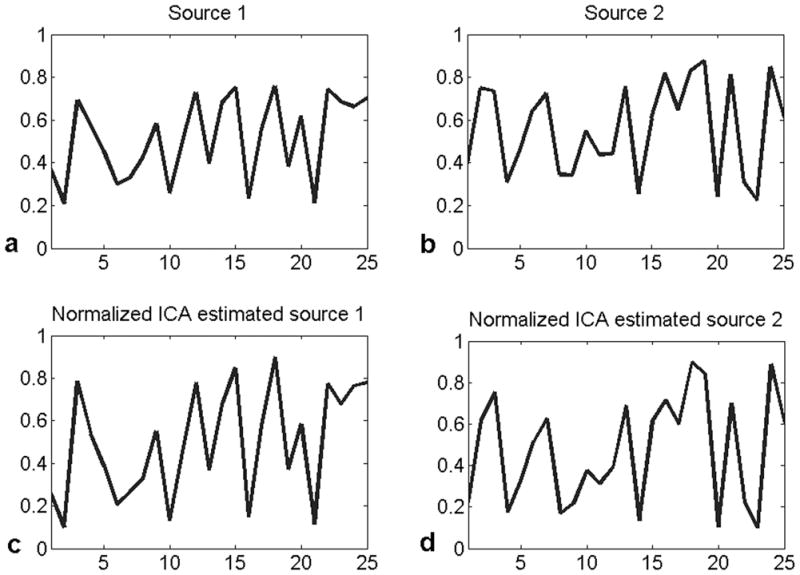
The 25-point diffusion measurements of two randomly picked cc sources with FA≥0.6 (a and b), and corresponding ICA recovered source profiles (c and d). The correlation coefficients between the recovered and measured profiles were 0.990 and 0.986 for these two sources and the corresponding errors in their orientations were 0.71° and 0.96°.
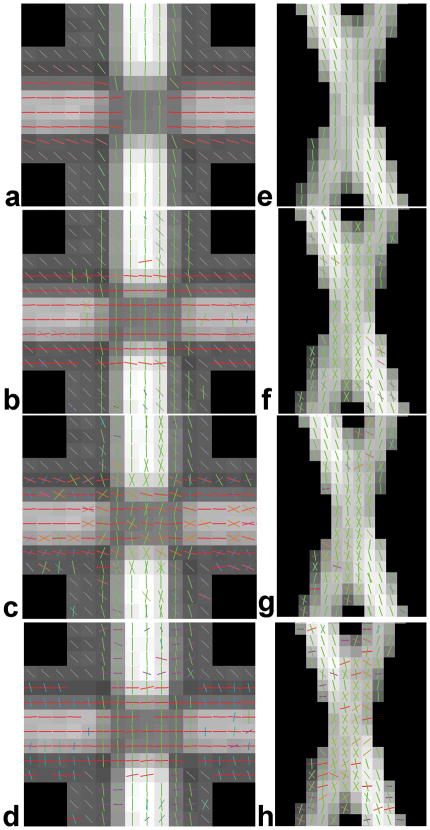
The fiber orientations in voxels of the SNR=30 orthogonal and 60° phantom data estimated by DTI, ICA, GMX and Behrens are shown in Fig. 4, where the same number of fibers were assigned to corresponding voxels in the multiple-fiber approaches. The SNR in the diffusion dataset was determined from the background in the b=0 image. The corresponding tractography results are presented in Fig. 5 where for ease of interpretation, tracts were filtered by two ROIs placed on each tract. As expected, there were no crossing tracts in DTI, instead tracts veered toward the higher FA region upon reaching the crossing area. Though similar to GMX and Behrens, ICA apparently recovered the crossing region in the orthogonal and 60° cases with least distortion.
Fig. 4.
Fiber orientations in voxels of the orthogonal and 60° data at SNR=30, determined by: (a,e) DTI, (b,f) ICA, (c,g) GMX and (d,h) Behrens. The color represents a blend of red, green and blue in proportion to the three orthogonal components of the orientation.
Fig. 5.
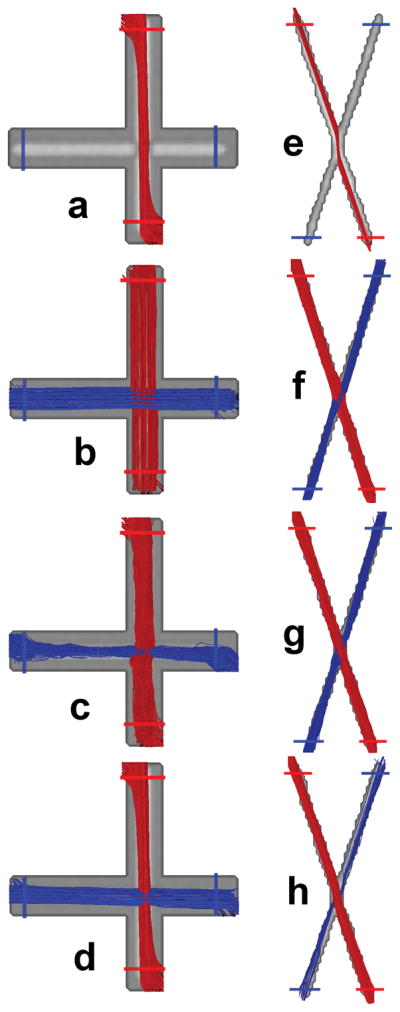
Tracts using the orthogonal and 60° data at SNR=30 sorted by two ROIs per tract as shown using: (a,e) DTI, (b,f) ICA, (c,g) GMX and (d,h) Behrens.
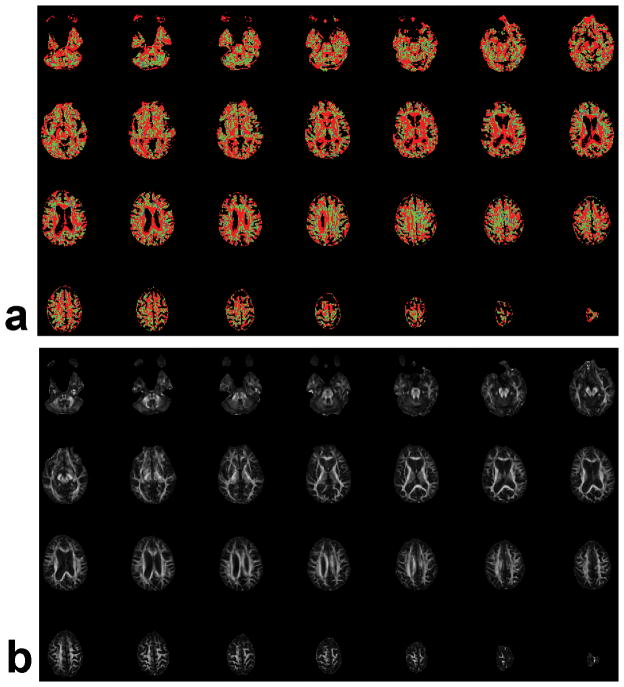
An example of the number of fibers assigned to all voxels of a whole-brain human study in 4mm thick contiguous slices using the F-test at p≤0.001, and the corresponding FA maps, is presented in Fig. 6. Apparently a large portion of the cc voxels and other high-FA regions are assigned 1 fiber, several other voxels are assigned 2 fibers but only a very few voxels are assigned 3 fibers.
Fig. 6.
(a) An example of the number of fibers assigned to all voxels of a whole-brain human study in 4mm thick contiguous slices using p≤0.001 in conjunction with an F-test. Red: 1 fiber; green: 2 fibers; blue: 3 fibers; and (b) FA maps of the same slices.
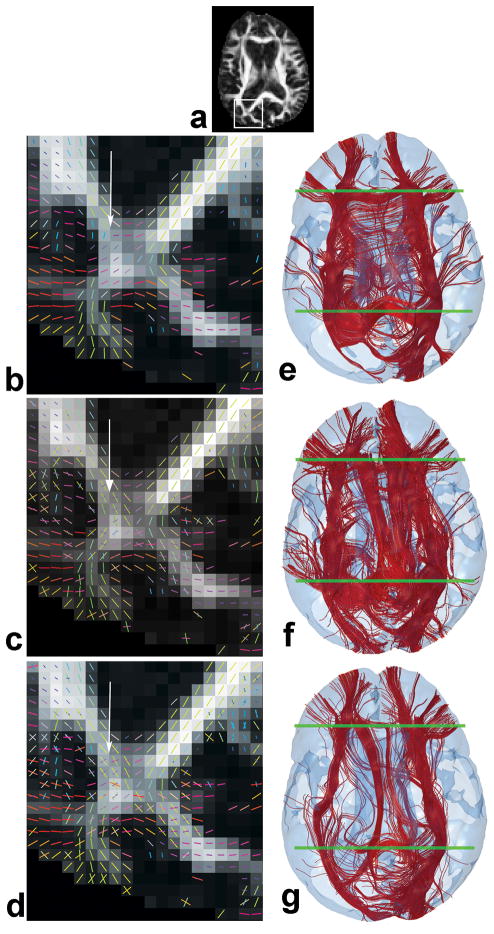
The performance of ICA was compared to DTI and Behrens in a known crossing region highlighted in Fig 7a where the splenium of the cc intersects with the posterior fronto-occipital tracts. Behrens was selected as it is more stable and faster than GMX. The single fiber eigenvectors from DTI and the multiple fiber orientations from Behrens and ICA in the highlighted region are shown in Figs. 7b–d respectively, indicating that the DTI fronto-occipital streamline would be disrupted in the crossing region as most of it would veer toward the splenium. The tractography results shown in Figs. 7e–f where two ROIs (as shown) were used to extract fronto-occipital tracts from whole-brain tractography, vividly confirm the steering of almost all fronto-occipital tracts toward the splenium in DTI (Fig. 7e), partial separation between the fronto-occipital and splenium with Behrens (Fig. 7f), but almost complete separation with ICA (Fig. 7g) conforming to known anatomy. Moreover, portions of the thalamic tracts and cc body are mixed with the left fronto-occcipital tracts in DTI and to a lesser extent in Behrens such that they survive filtering by the ROIs meant to isolate the fronto-occipital tracts only, thereby compromising the accuracy of identifying and quantifying fronto-occipital tracts (left hemisphere of Figs. 7e and f). However, these mixed tracts are separated by ICA and thus filtered out by the two ROIs, resulting in much better recovery of the complete fronto-occipital tracts as shown in Fig. 7g.
Fig. 7.
(a) A highlighted (rectangular) region in the FA map where the splenium and posterior fronto-occipital tracts intersect. Fiber orientations in this region estimated by: (b) DTI, (c) Behrens and (d) ICA are shown using the same color coding as Fig. 4. Arrows indicate a mixing region. Results of sorting the fronto-occipital tracts from whole-brain tractography using two planar ROIs indicated by green boundaries and the orientations estimated by: (e) DTI, (f) Behrens and (g) ICA. The ICA tracts show good separation between the fronto-occipital tracts and the splenium and other pathways.
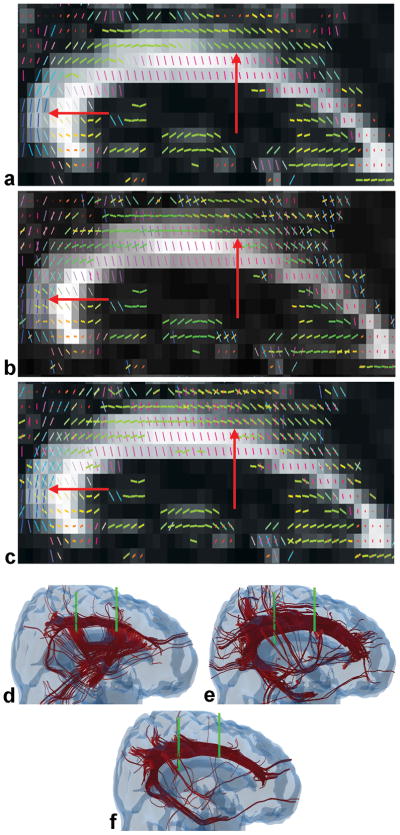
Another example from a different subject is presented in Fig. 8, highlighting a region where the cingulum fibers are mixed with the body of the cc. The eigenvectors from DTI and the multiple fiber orientations from Behrens and ICA are shown in Figs. 8a–c respectively, suggesting a disruption in the continuity of the DTI tracked cingulum bundle in regions where the cc and cingulum fibers are mixed. The tractography results show incomplete recovery of the cingulum with DTI after ROI sorting to extract the cingulum (Fig. 8d). However, a significantly larger portion of the cingulum, up to the hippocampal areas, is recovered with Behrens or ICA (Figs. 8e and f). Though the perfomance of ICA and Behrens are similar, ICA was approximately two orders of magnitude faster than Behrens. Moreover, several 3-fibers voxels did not converge with Behrens and were then assigned 2 fibers.
Fig. 8.
Sagittal slices (left to right, posterior to anterior) showing fiber orientations (color coded as in Fig. 4) estimated by (a) DTI, (b) Behrens and (c) ICA in a region where the cingulum and cc tracts merge. The 2:1 aspect ratio conforms to the 4mm thick axial slices acquired with 2mm in-planar resolution. Arrows indicate a merging region. Sorted cingulum tracts from whole-brain tractography using two planar ROIs (green boundaries) and orientations from: (d) DTI, (e) Behrens and (f) ICA. The ICA tracts show better separation of the cingulum tracts from the cc tracts than DTI or Behrens, and continuity of the cingulum to the hippocampal regions.
DISCUSSION
This work describes a novel fastICA approach to estimate the orientations of up to 3 fibers per voxel in diffusion data acquired from only 25 gradient directions at one nonzero b-value (b =1000s/cm2) in approximately 7min, thus making it clinically viable. Though preliminary results have been presented at ISMRM conferences (28,29), this is the first comprehensive report of tractography incorporating up to 3 fibers per voxel where ICA is used to estimate multiple orientations per voxel. A previous approach called “modified mixture density ICA” estimated up to 2 fibers per voxel by adapting parameters of specific nonlinear functions to minimize errors between the resulting PDFs and a model of the PDF (30). Even though the previous ICA approach was tested successfully with preliminary human data from six gradient directions and four nonzero b-values, its application remains limited due to its computational complexity and slow convergence and no whole-brain tractography has been reported. The current fastICA formulation is more than a factor of 100 faster than previous mixture model approaches including those that rely on estimating parameters of a Gaussian mixture model, and provides an alternative to other techniques such as probabilistic and higher-order tensor tractography, which generally tend to be computationally intensive. Compared to ICA, q-space approaches including deconvolution are also computationally intense and generally require >30min data acquisition time with specialized pulse sequences not available at many clinical installations. Additionally, deconvolution approaches require an accurate model of the diffusion field of a fiber and rapidly become unstable with noise (31). ICA not only provides a simple and viable alternative to conduct streamline tractography incorporating up to 3 fibers per voxel in a clinical setting without requiring any specialized pulse sequences, but more importantly, could be used to process already existing routinely acquired clinical DTI data in many labs.
Our work suggests that ICA is capable of recovering the correct orientation of individual fibers (i.e., their eigenvectors if modeled as a rank-2 tensor) when multiple fibers are mixed in a voxel, but not their original eigenvalues. This is because the profiles or shapes of sources recovered by ICA show a high correlation with respect to the original sources, but their individual variance, bias level, and true mixing ratios are not recoverable by ICA (23). The high correlation implies that the location of a peak in an individual source profile is recoverable, which corresponds to the orientation of a fiber.
A disadvantage of ICA is that it requires the same sources (i.e., fibers with the same orientation) to be mixed in different ratios in several voxels, where the number of voxels must be at least equal to, but preferably greater than, the number of sources. Commensurate with the acquisition voxel dimensions and ICA requirement, an 11-voxel neighborhood was used in this work in the form of a 3×3 cluster in the x–y plane and one voxel above and below the center voxel along the z-axis, where the voxel under consideration was at the center of the cluster. Thus, it is implicitly assumed that changes in fiber orientations with tract propagation occur in a piecemeal manner only, such that the orientations within a specific 11-voxel cluster do not change significantly. A simulation study where one of two fibers was modeled to bend by a constant angle Δθ in 6/11 voxels of the neighborhood added only 1–10° error (for Δθ ranging from 10–40°) to the estimate of the orientation angle in the central voxel. Due to the orientation-change threshold (typically 45°) used to terminate tracts, larger bending angles would not have much impact. In general, significant changes in the orientation of tracts within all or most of the 11-voxel neighborhood would be incompatible with ICA assumptions and require further work to evaluate their impact on the results.
In some situations, fibers may not cross over all the voxels in the neighborhood cluster, for example, if the central voxel were at the boundary of a tract. We addressed this possibility by removing 3 outer voxels from the 3×3 cluster and found no significant changes in the orientation error from using data in the remaining voxels. It is hoped that questions regarding the optimal number of voxels and configuration of the neighborhood cluster will be addressed in future work.
Acknowledgments
The authors thank Dr. Jeong-Won Jeong for his assistance with the GMX simulation studies, and Mr. Darryl Hwang and Mr. Bryce Wilkins for their helpful comments. This work is supported in part by grants NIA-NIH P50 AG05142 and NIH-MH RO1 53213.
References
- 1.Basser PJ, Mattiello J, LeBihan D. MR diffusion tensor spectroscopy and imaging. Biophys J. 1994;66:259–267. doi: 10.1016/S0006-3495(94)80775-1. [DOI] [PMC free article] [PubMed] [Google Scholar]
- 2.Conturo TE, Lori NF, Cull TS, Akbudak E, Snyder AZ, Shimony JS, McKinstry RC, Burton H, Raichle ME. Tracking neuronal fiber pathways in the living human brain. Proc Natl Acad Sci USA. 1999;96:10422–10427. doi: 10.1073/pnas.96.18.10422. [DOI] [PMC free article] [PubMed] [Google Scholar]
- 3.Jones DK, Horsfield MA, Simmons A. Optimal strategies for measuring diffusion in anisotropic systems by magnetic resonance imaging. Magn Reson Med. 1999;42:515–525. [PubMed] [Google Scholar]
- 4.Mori S, Crain BJ, Chacki VP, van Zijl PC. Three-dimensional tracking of axonal projections in the brain by magnetic resonance imaging. Magn Reson Med. 1999;42:515–525. [Google Scholar]
- 5.Mori S, Kauffman WE, Pearlson GD, Crain BJ, Stieltjes B, Solaiyappan M, van Zijl PC. In vivo visualization of human neural pathways by magnetic resonance imaging. Ann Neurol. 2000;47:412–414. [PubMed] [Google Scholar]
- 6.Basser PJ, Pajevic S, Pierpaoli C, Duda J, Aldroubi A. In vivo fiber tractography using DT-MR data. Magn Reson Med. 2000;44:625–632. doi: 10.1002/1522-2594(200010)44:4<625::aid-mrm17>3.0.co;2-o. [DOI] [PubMed] [Google Scholar]
- 7.LeBihan D, Mangin J-F, Poupon C, Clark CA, Sabina P, Nicolas M, Chabriat H. Diffusion tensor imaging: concepts and applications. J Magn Reson Imaging. 2001;13:534–546. doi: 10.1002/jmri.1076. [DOI] [PubMed] [Google Scholar]
- 8.Mori S, Kaufmann WE, Davatzikos C, Stirltjes B, Amodei L, Fredericksen K, Pearlson GD, Melhem ER, Solaiyappan M, Raymond GV, Moser HW, van Zijl PC. Imaging cortical association tracts in the human brain using diffusion-tensor-based axonal tracking. Magn Reson Med. 2002;47:215–223. doi: 10.1002/mrm.10074. Direct Link. [DOI] [PubMed] [Google Scholar]
- 9.Wedeen VJ, Reese TG, Tuch DS, Weigel MR, Dou JG, Weiskoff RM, Chessler D. Mapping fiber orientation spectra in cerebral white matter with Fourier transform diffusion MRI. Proceedings of the 8th Annual Meeting of ISMRM; Denver. 2000. p. 82. [Google Scholar]
- 10.Tuch DS, Reese TG, Wiegell MR, Makris N, Belliveau JW, Wedeen VJ. High angular resolution diffusion imaging reveals intravoxel white matter fiber heterogeneity. Magn Reson Med. 2002;48:577–582. doi: 10.1002/mrm.10268. [DOI] [PubMed] [Google Scholar]
- 11.Lin CP, Wedeen VJ, Chen JH, Yao C, Tseng WI. Validation of diffusion spectrum magnetic resonance imaging with manganese-enhanced rat optic tracts and ex vivo phantoms. Neuroimage. 2003;19:482–495. doi: 10.1016/s1053-8119(03)00154-x. [DOI] [PubMed] [Google Scholar]
- 12.Wedeen VJ, Hagmann P, Tseng WYI, Reese TG, Weisskoff RM. Mapping complex tissue architecture with diffusion spectrum magnetic resonance imaging. Magn Reson Med. 2005;54:1377–1386. doi: 10.1002/mrm.20642. [DOI] [PubMed] [Google Scholar]
- 13.Tuch DS, Reese TG, Wiegell MR, Wedeen VJ. Diffusion MRI of complex neural architecture. Neuron. 2003;40:885–895. doi: 10.1016/s0896-6273(03)00758-x. [DOI] [PubMed] [Google Scholar]
- 14.Tuch DS. Q-ball imaging. Magn Reson Med. 2004;52:1358–1372. doi: 10.1002/mrm.20279. [DOI] [PubMed] [Google Scholar]
- 15.Tournier JD, Calamante F, Gadian DG, Connelly A. Direct estimation of the fiber orientation density function from diffusion-weighted MRI data using spherical deconvolution. Neuroimage. 2004;23:1176–1185. doi: 10.1016/j.neuroimage.2004.07.037. [DOI] [PubMed] [Google Scholar]
- 16.Anderson AW. Measurement of fiber orientation distributions using high angular resolution diffusion imaging. Magn Reson Med. 2005;54:1194–1206. doi: 10.1002/mrm.20667. [DOI] [PubMed] [Google Scholar]
- 17.Alexander DC. Multiple-fiber reconstruction algorithms for diffusion MRI. Ann N Y Acad Sci. 2005;1062:113–133. doi: 10.1196/annals.1340.018. [DOI] [PubMed] [Google Scholar]
- 18.Tournier JD, Fernando C, Connelly A. Robust determination of the fiber orientation distribution in diffusion MRI: non-negativity constrained super-resolved spherical deconvolution. Neuroimage. 2007;35:1459–1472. doi: 10.1016/j.neuroimage.2007.02.016. [DOI] [PubMed] [Google Scholar]
- 19.Kreher BW, Schneider JF, Mader I, Martin E, Hennig J, Il’yasov KA. Multitensor approach for analysis and tracking of complex fiber configurations. Magn Reson Med. 2005;54:1216–1225. doi: 10.1002/mrm.20670. [DOI] [PubMed] [Google Scholar]
- 20.Hosey T, Williams G, Ansorge R. Inference of multiple fiber orientations in high angular resolution diffusion imaging. Magn Reson Med. 2005;54:1480–1489. doi: 10.1002/mrm.20723. [DOI] [PubMed] [Google Scholar]
- 21.Jian B, Vemuri BC, Ozarslan E, Carney PR, Mareci TH. A novel tensor distribution model for the diffusion-weighted MR signal. Neuroimage. 2007;37:164–176. doi: 10.1016/j.neuroimage.2007.03.074. [DOI] [PMC free article] [PubMed] [Google Scholar]
- 22.Behrens TEJ, Woolrich MW, Jenkinson M, Johansen-Berg H, Nunes RG, Clare S, Matthews PM, Brady JM, Smith SM. Characterization and propagation of uncertainty in diffusion-weighted MR imaging. Magn Reson Med. 2003;50:1077–1088. doi: 10.1002/mrm.10609. [DOI] [PubMed] [Google Scholar]
- 23.Oja E, Hyvarinen A, Karhunen J. Independent component analysis. New York: Wiley Interscience; 2001. EBSCO LinkSource. [Google Scholar]
- 24.Singh M, Wong CW. Recovery of multiple fibers per voxel by ICA in DTI tractography. Proceedings of the Annual Engineering in Medicine and Biology Conference; New York, NY: EMBS; 2006. pp. 735–738. [DOI] [PubMed] [Google Scholar]
- 25.Hyvärinen A, Oja E. A fast fixed-point algorithm for independent component analysis. Neural Comput. 1997;9:1483–1492. [Google Scholar]
- 26.Basser PJ, Pierpaoli C. Microstructural and physiological features of tissues elucidated by quantitative-diffusion-tensor MRI. J Magn Reson. 1996;111:209–219. doi: 10.1006/jmrb.1996.0086. [DOI] [PubMed] [Google Scholar]
- 27.Lazar M, Alexander AL. An error analysis of white matter tractography methods: synthetic diffusion tensor field simulations. Neuroimage. 2003;20:1140–1153. doi: 10.1016/S1053-8119(03)00277-5. [DOI] [PubMed] [Google Scholar]
- 28.Singh M, Wong CW. Whole-brain tractography incorporating ICA based crossing-fiber orientations. Proceedings of the Joint 15th Annual Scientific Meeting of ISMRM and European Society of Magnetic Resonance in Medicine and Biology; Berlin, Germany. 2007. p. 899. [Google Scholar]
- 29.Singh M, Wong CW. ICA based multi-fiber tractography. Proceedings of the 17th Annual meeting of ISMRM; Hawaii. 2009. [Google Scholar]
- 30.Kim S, Jeong JW, Singh M. Estimation of multiple fiber orientations from diffusion tensor MRI using independent component analysis. IEEE Trans Nucl Sci. 2005;52:266–273. [Google Scholar]
- 31.Jian B, Vemuri BC. A unified computational framework for deconvolution to reconstruct multiple fibers from diffusion weighted MRI. IEEE Trans Med Imaging. 2007;26:1464–1471. doi: 10.1109/TMI.2007.907552. [DOI] [PMC free article] [PubMed] [Google Scholar]


