

Abstract
Pathologic assessment of colorectal adenomas, a complex task with significant inter-observer variability, typically defines the scheduling of surveillance colonoscopies following removal of adenomas. We have characterized the activity levels of pro- and active matrix metalloproteinase-2 and matrix metalloproteinase-9 in colorectal adenomas and carcinomas, as potential markers of pathologic progression during colorectal tumorigenesis. Endogenous fully activated matrix metalloproteinase-2, in particular, has been studied less frequently in adenomas due to difficulties in detection. For this report, tissues (n=119) from 51 individuals were extracted and assayed on gelatin zymograms with digital standardization to nanogram quantities of purified active controls. Resulting data were assessed by graphical and multinomial logit regression analyses to test whether matrix metalloproteinase-2 or matrix metalloproteinase-9 activities could discriminate among four different types of colorectal tissue (normal mucosa, adenomas with or without high grade dysplasia and invasive carcinomas). Active matrix metalloproteinase-2 successfully discriminated among these tissue categories. Median activity for active matrix metalloproteinase-2 increased in a stepwise fashion with pathologic progression from normal mucosa to adenoma without high grade dysplasia to adenoma with high grade dysplasia to cancer. Although pro-matrix metalloproteinase-2 and pro-matrix metalloproteinase-9 activities could discriminate to some extent among tissue categories, those effects did not contribute additional information. Active matrix metalloproteinase-2 activity correlated significantly with histopathologic assessment of colorectal tissues. The ability of active matrix metalloproteinase-2 to distinguish adenomas with high grade dysplasia from adenomas without high grade dysplasia may be particularly useful in predicting future colorectal cancer risk for an individual, thus optimizing scheduling of surveillance colonoscopies.
Keywords: active MMP-2, colorectal adenomas, high grade dysplasia, tumor progression
INTRODUCTION
Pathologic features of colorectal adenomas are used to define the extent to which a lesion has progressed towards malignancy. Such information may predict the risk of future colorectal cancer and determine the frequency of surveillance colonoscopy for that individual. However, a debate among pathologists has raised questions about the usefulness and value of pathologic characteristics for determining risk of subsequent advanced neoplasms (1–3). In particular, sorting adenomas by the presence or absence of high grade dysplasia is highly valued and yet ill-defined (lacking universal definitions and quantitation of dysplasia). Inconsistencies in diagnosis and lack of objective criteria for pathologic features of colorectal adenomas (3) highlight the importance of identifying new biomarkers that might improve the prediction of malignant potential in an adenoma.
In the current study, we have analyzed pro- and active forms of the matrix metalloproteinases, MMP-2 and MMP-9, for their ability, either individually or as a group, to discriminate among pathologically defined stages of colorectal adenoma and to diagnose early colorectal cancers. Our recent report showed that activity levels for pro- and active MMP-2 and pro-MMP-9 were all significantly higher in colorectal cancers than normal mucosa. Yet we found that active MMP-2 activity levels were, by far, a more effective indicator of the presence of invasive cancer than pro-MMP-2 or pro-MMP-9 (4). A receiver operator characteristic (ROC) curve from that data on 269 patient-matched pairs of normal colorectal mucosa and carcinoma provided a cut-off value for active MMP-2 activity levels of 44 SDU/mg protein (3-times normal levels) that would permit detection of colorectal cancer with an estimated sensitivity of 84% and estimated specificity of 93% (4). Extrapolating from these results, we hypothesized that the active form of MMP-2 activity levels might also identify high grade dysplasia or “early colorectal cancer” within an advanced stage adenoma. To address this hypothesis, we have analyzed colorectal adenomas with and without HGD for comparison to normal colorectal mucosa and invasive cancers from the same individuals. Our goal was to determine whether levels of active MMP-2, pro-MMP-2 or pro-MMP-9 activities, either as single markers or together, could distinguish among different types of primary colorectal tissue obtained at surgical resection, including normal mucosa, adenomas without and with high grade dysplasia and cancer. We also analyzed a set of 6 adenomas from 4 individuals with familial polyposis coli (FAP) to determine whether a germline mutation in the APC gene might be responsible for triggering early changes in levels of MMP-2 or MMP-9 activities in colorectal adenomas, as reported for MMP-7 activity in adenomas from individuals with FAP (5).
MATERIALS AND METHODS
Patient and Tissue Samples
Patient-matched tissue sets of normal colon mucosa, adenomas with or without high grade dysplasia and carcinoma were obtained by surgical resection. Samples from 51 individuals included 40 colorectal adenomas from 34 subjects (median age: 69; range 16–92; 12 female, 22 male) of which 34 adenomas came from 30 individuals without familial adenomatous polyposis (FAP) and the remainder from individuals with FAP. Included in 30 tissue sets containing adenomas from non-FAP individuals were 11 sets for which normal mucosa, adenoma (with or without HGD) and cancer were all removed at surgery from a given individual. Zymogram assay results for an additional 15 matched normal/cancer pairs without adenomas were analyzed to illustrate typical MMP-2 and MMP-9 banding patterns in cancers. Normal mucosa/cancer pairs were also analyzed from 2 individuals with probable attenuated FAP based on a clinical diagnosis of colorectal cancer with multiple adenomas (but fewer than 100) identified at older ages (59 and 65 years old respectively) than classic FAP (6). Each of these individuals had greater involvement of right than left colon, which is also typical of attenuated FAP.
Information on pathological characteristics and size of adenomas as well as pathological staging of carcinomas was obtained from surgical pathology reports. Among the 34 adenomas from individuals without FAP, 16 showed high grade dysplasia (HGD) while 18 did not have HGD. Among those adenomas without HGD, there were eight tubular adenomas (TA), six tubulovillous adenomas (TVA) and four villous adenomas (VA). Among the adenomas from 4 individuals with FAP, there were five TA, one TVA and no HGD. We obtained one cancer each (but no adenomas) from the two individuals with probable attenuated FAP. There were also 12 patient-matched carcinomas (one Stage I, nine Stage II, one Stage III and one Stage IV cancer) obtained from the non-FAP individuals whose adenomas were being studied.
Cancer staging was done in accordance with the American Joint Committee on Cancer (AJCC) Tumor Node Metastasis (TNM) (7), with stage I cancers defined as invading into submucosa or muscularis propria (T1, T2), stage II cancers defined as having spread through muscularis propria into subserosa, pericolic or perirectal tissues (T3) or directly into other organs or structures or perforating visceral peritoneum (T4) without involving lymph nodes, stage III cancers (any T) as having regional lymph node metastases and stage IV cancers (any T) as having distant metastases, commonly to the liver or lungs. Normal mucosa was selected as the appropriate patient-matched control tissue as it contains the epithelium from which carcinomas arise.
Normal mucosa samples were obtained at least 5–10 cm from tumors and separated from submucosa, muscle layer, serosa and surrounding fat prior to being snap frozen and stored at −80°C. Thirty-four percent of the samples came from Boston University Medical Center while 66% came from the Cooperative Human Tissue Network (CHTN), all collected in accordance with human research protocols approved by the Boston University Medical Center Institutional Review Board. Matched pairs were numbered sequentially as they arrived, irrespective of site of origin. CHTN samples were snap frozen, sent on dry ice from the Midwestern (Ohio), Eastern (Pennsylvania) and Southern (Alabama) divisions and stored at −80°C immediately upon arrival. To test whether gelatinase activity levels in tissue samples obtained locally from Boston Medical Center differed from those sent from a distance through CHTN we used a two-tailed t-test to assess whether there was a difference in mean activity levels in the two sets of normal samples (8).
Tissue Extraction
To minimize variation, each set of normal mucosa, adenoma and/or matched carcinoma was extracted and assayed at the same time. To achieve consistent detection of endogenous active MMP-2 in particular, an extraction method was used that optimized cell lysis with minimum auto-degradation in stored samples (9). Tissue samples (60–80 mg) were homogenized in 500ul of distilled, deionized water, frozen and thawed three times, and centrifuged (50 min at 4°C at 17,210 g) in a Sorvall 5B centrifuge. Supernatants were removed and protein content determined (10) using bovine serum albumin as a standard.
Gelatin Zymography
Tissue extracts were analyzed on gelatin zymograms for identification of gelatinolytic type IV collagenases, including all pro-and active MMP-2 and MMP-9 bands. Zymograms were performed as described by Rao et al (11) with minor modifications (12). Briefly, 25 μg soluble protein were electrophoresed on a commercially prepared 10% SDS-PAGE gel (8×8×0.1cm) containing gelatin (1 mg/ml) (Invitrogen/GIBCO, Grand Island, NY, USA). Gels were subjected to two 30-min washes in 2.5% Triton X-100 prior to development of enzyme activity bands in substrate buffer (50mM Tris-HCl, 10 mM CaCl, 0.15M NaCl, 0.05% NaAzide, pH 7.5) for 18 hours. Resulting gelatinolytic enzymes were detected as transparent bands of digested gelatin against a Coomassie blue-stained gel background.
Molecular weight standards (30,000–200,000; Sigma, St. Louis, MO USA) were electrophoresed with samples to identify band sizes for different MMP forms. To verify the sizes of activated MMP forms on zymograms, several samples were also treated with 1mM p-aminophenylmercuric acetate (APMA, Sigma, St. Louis, MO USA) for 1.5 hr at room temperature before gelatin zymography was performed (13). To ensure that we were measuring MMP activities, enzyme specificity was tested in both normal and cancer samples by incubating sample gel slices in different proteolytic inhibitors as described (4,12), including 10 mM EDTA (Fisher, Fairlawn, NJ USA) 100mM E-64 (Sigma), 200uM phenylmethylsulfonyl fluoride (PMSF) (Sigma), 1ug/ml pepstatin (Sigma) and 1,10 phenanthroline (Sigma, St. Louis, MO USA). In addition, to confirm identity of specific gel bands and to standardize activity measurements, purified active gelatinase controls for active MMP-2 (human recombinant active MMP-2), pro-MMP-2 (human synovial fibroblast proenzyme MMP-2) which is separated from a non-covalent 1:1 complex with TIMP-2 and activated in the presence of SDS during gel electrophoresis (14) and human neutrophil MMP-9 (all from Calbiochem, La Jolla, CA USA) were electrophoresed next to the tissue extracts, as detailed below. Purified standards were diluted in recommended buffers with the addition of BSA (5 μg/ul) (Sigma, St. Louis MO USA) to increase enzyme stability during storage.
To control for intrinsic genetic variability in normal banding patterns in different individuals and for sample handling, all matched sets of tissues from the same individual were run side-by-side on gelatin zymograms. A constant amount of soluble protein was loaded into each gel slot. As an additional control for loading, the bottom section (2–4 cm) of each gel was cut off before the gelatinase assay and stained with Coomassie Blue to permit detection of a low molecular weight protein that is relatively constant across samples and does not demonstrate a cancer-specific change from normal to cancer tissue (15). Precise gel buffer pH was important in generating sharp gel bands. Careful protein loading per lane and extensive gel washing before the substrate incubation and after Coomassie Blue staining contributed to assay reproducibility.
Band Quantification
Computer-assisted imaging employed Total Lab software (`Phoretix ID Quantifier'; Nonlinear Dynamics Ltd., Newcastle upon Tyne, UK; www.nonlinear.com) to score each MMP band in activity units, based on band area × pixel intensity with resulting activity measured in “Total Lab Units” (TLU). Purified commercial controls (Calbiochem, EMD Biosciences, La Jolla, CA USA) were also used to standardize MMP-2 or MMP-9 enzyme activity in mUnits /mg soluble tissue protein with resulting activity based on commercially defined measurements of purified MMP-2 or MMP-9 controls. For this report, commercial activity units for active MMP-2 are designated “TPH units” (thiopeptolide hydrolysis units) based on the control for active MMP-2, defined as having 9 × 10³ μUnits activity/ng protein (Calbiochem, EMD Biosciences, La Jolla, CA USA) in a thiopeptolide hydrolysis assay (16). Commercial activity units for pro-MMP-2 and pro-MMP-9 (Calbiochem, EMD Biosciences, La Jolla, CA USA) were designated “SPS units” (synthetic peptide substrate units) based on pro-MMP-2 control activity (190×10−3 μUnits/ng protein) against dinitrophenyl-linked synthetic peptide substrate 2,4-DNP-Pro-Gln-Gly-Ile-Ala-Gly-Gln-D-Arg-OH or purified MMP-9 control activity (2.07 μUnits/ng protein) against the same synthetic peptide substrate (17)
Although Total Lab imaging software permitted digital assessment of gel bands and standardization to commercial standards, this methodology was limited by the dynamic range of computer imaging in measuring samples across a broad spectrum of activity on a single gel for normal versus adenoma or cancer samples. Accurate comparisons were determined by serial dilution of a sample to generate the weakest complete band for each activity, defined arbitrarily as 1 serial dilution unit (SDU), then measured by computer imaging with reference to purified controls to generate activity units for MMP-2 and MMP-9 that can be interconverted and compared to similar activity measurements made in other laboratories. For serial dilution units (SDU) the activity levels in the original undiluted sample are defined by the dilution required for a given sample to generate the weakest complete band of activity for a particular gelatinase form (with controls for this definition coming from computer imaging of purified standards and samples).
Thus, we have defined MMP bands in 3 types of unit, including commercial activity units (either TPH or SPS units), Total Lab imaging units (TLU) and serial dilution units (SDU), which are interconvertible as each can be referenced to the other and to external standards. Data for figures and tables have typically been given in serial dilution units for this report as these units can readily and universally be calculated for each marker and also can be standardized to commercial activity units or converted to Total Lab imaging units using the data given in Table 1.
Table 1.
Normal, adenoma, high grade dysplasia and cancer: Mean MMP activity/mg protein expressed in 3 types of units for patient-matched tissues from 30 individuals (no FAP cases)
| Tissue | Active MMP-2 Activity | Pro-MMP-2 Activity | Pro-MMP9 Activity | ||||||
|---|---|---|---|---|---|---|---|---|---|
| SDU | TPH μU | TLU | SDU | SPSμU | TLU | SDU | SPSμiU | TLU | |
| Normal (n=30) | 14.2 | 532.5 | 19.2×10³ | 147.6 | 0.554 | 704.1×10³ | 190.8 | 24.2 | 1640.9×103 |
| Ad w/o HGD (n=18) | 31.8 | 1,192.5 | 43.0 ×10³ | 172.0 | 0.645 | 820.4×10³ | 337.3 | 42.8 | 2900.8×103 |
| Ad with HGD (n=16) | 63.3 | 2,373.8 | 85.7 ×x103 | 178.5 | 0.669 | 851.5×10³ | 581.3 | 73.8 | 4999.2×103 |
| Cancer (n=12) | 127.0 | 4,762.5 | 171.8 ×10³ | 264.3 | 0.991 | 1260.7x103 | 726.7 | 87.2 | 6249.6×103 |
*SDU, serial dilution units (defined by serial dilution of sample required to detect minimal complete visible band); TPH (μU, thiopeptolide hydrolysis activity in microunits; SPS μU, synthetic peptide hydrolysis activity in microunits against the dinitrophenyl-linked synthetic peptide substrate 2,4-DNP-Pro-Gln-Gly-Ile-Ala-Gly-Gln-D-Arg-OH; TLU, Total Lab units, computer imaging units in band area × pixel intensity as defined by Nonlinear Dynamics Total Lab software.
Statistical Methods
As our aim was to analyze MMP-2 and MMP-9 activities in matched tissue sets containing at least one adenoma, final statistical analyses for the current study were derived only from cases that had patient-matched adenomas. To assess levels of MMP-2 and MMP-9 activities during colorectal tumor progression, we measured each activity in tissue sets of patient-matched normal mucosa (N), adenomas without high grade dysplasia (A), adenomas with high grade dysplasia (A/HGD) and cancers (C) from 30 individuals, without known familial risk of colorectal cancer. Resulting data were analyzed using exploratory graphical and multinomial logit (logistic regression) analyses (8,18). Panels of horizontal schematic plots were used to display sample distributions of activity levels in 4 tissue types for each of three marker enzymes (active MMP-2, pro-MMP2, and pro-MMP-9). To test the hypothesis that one, or a combination, of activities could discriminate among different individual types of colorectal tissue, we employed multinomial logit analysis. We treated tissue classification as a four-level categorical outcome and investigated whether outcome could be predicted effectively by activity levels of the three markers. In these analyses, we defined normal tissue as the “reference” category and used multinomial logit analyses to conduct three simultaneous pair-wise comparisons of adenoma without HGD vs. normal, adenoma with HGD vs. normal and cancer vs. normal. We then tested whether tissues in each pair could be effectively discriminated from each other based on enzyme levels. In follow-up analyses that involved pair-wise comparisons of tissues in sub-samples of the data, we use binomial logit analysis. In fitting these statistical models, we estimated robust standard errors to account for clustering of 75 tissue samples among only 30 patients.
In order to determine sensitivity and specificity of each gelatinase marker for determining either HGD or cancer in individual samples, receiver operating characteristic curves (ROC) were plotted for active MMP-2, pro-MMP-2 and pro-MMP-9 activities (8).
To compare gelatinase activity levels with respect to tissue procurement sites, we used a two-tailed t-test to assess whether there was a difference between mean active MMP-2 activities in the tissue samples that were obtained locally (from Boston Medical Center) and those obtained distantly (through the Cooperative Human Tissue Network).
RESULTS
MMP-2 and MMP-9 activities in normal and tumor tissues
Distinctive banding patterns and changes in activity levels were observed for the individual MMP-2 and MMP-9 activities analyzed in multiple sets of patient-matched normal and tumor tissue (Figs 1 and 2). Standard size markers (M) were run together with samples to determine molecular mass of individual bands of activity on SDS/PAGE gelatin gels (Fig 1a). All activity levels were assayed on zymogram gels and digitally quantified for subsequent data analyses.
Figure 1.
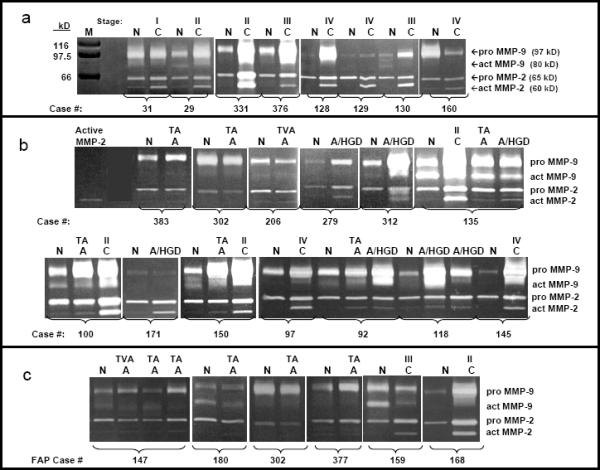
1a. MMP-2 and MMP-9 activities in 8 matched pairs of normal and cancer tissues. Gelatin zymograms for eight pairs of patient-matched normal mucosa (N) and colorectal cancer (C) extracts with Coomassie blue stained protein markers (M) of defined molecular mass to the left. Active MMP-2 was detected as a 60 kD band showing stronger activity in all cancer samples compared to matched normal mucosa. Pro-MMP-2, detected as a 65 kD band, was present in all samples, with higher activity in 6/8 cancers compared to matched normal mucosa. Active MMP-9 activity was detected as a weak 80 kD band in two normal mucosa samples (N29 and N130). Pro-MMP-9 activity was detected as a 97 kD band demonstrating a wide range of variation in activity levels from almost non-detectable (N129) to very high levels (C331) and increased activity in 5/8 cancer samples compared to normal mucosa. Cancer stage is designated above each cancer tissue (Stage I, S I; Stage II, S II; Stage III, S III; Stage IV, S IV).
1b. MMP-2 and MMP-9 activities in 13 matched sets of normal, adenoma without and with high grade dysplasia and cancer tissues. Gelatin zymograms for sets of normal mucosa tissues (N) with patient-matched adenomas without HGD (A) and/or adenomas with high grade dysplasia (A/HGD) and/or colorectal cancer (C) with purified active MMP-2 standard in the far left lane. All samples with the same case number were removed simultaneously from a given individual. Adenomas without HGD (A) are also designated as TA (tubular adenoma), TVA (tubulovillous adenoma) or VA (villous adenoma). Cancer samples (C) are also designated by stage, as described for Fig 1a. The 60 kD active MMP-2 activity was very low or not detectable in a majority of normal mucosa extracts, despite clear detection of pro-MMP-2 and pro-MMP-9. Higher levels of active MMP-2 activity were detected in many colorectal adenomas without HGD, adenomas with HGD, and cancer compared to normal. Changes in active MMP-2 levels in different tissues removed at surgery from a single subject (Cases 92, 100, 135 and 150) illustrate a step-wise increase in active MMP-2 activity with progression from normal colorectal mucosa to adenoma without HGD to adenoma with HGD to carcinoma. Levels of 65 kD pro-MMP-2 activity, while present in normal mucosa at much higher levels than active MMP-2, did not change much in colorectal adenomas, with or without high grade dysplasia, but did increase in most carcinomas. Pro-MMP-9 activity levels varied dramatically from case to case, being higher in some adenomas and cancers than matched normal (Cases 92, 100, 135, 145, 150, 279 and 312), showing minimal changes by tissue type in other cases (Case 171) and were sometimes lower in adenoma or cancer compared to normal (Cases 206 and 302).
1c. MMP-2 and MMP-9 activities in normal and adenoma tissues from 4 cases of FAP and in normal and cancer tissues from 2 cases of attenuated FAP. Gelatin zymograms for sets of normal mucosa tissues (N) with patient-matched adenomas without HGD (A) and/or colorectal cancer (C). Adenomas without HGD (A) are also designated as TA (tubular adenoma), TVA (tubulovillous adenoma) or VA (villous adenoma). Cancer samples (C) are also designated by stage, as described for Fig 1a. The 60 kD active MMP-2 activity was very low or not detectable (Cases 180, 302, 377 and 2 of 3 adenomas from Case 147) or very low (1 adenoma from Case 147) in all adenomas. Higher levels of active MMP-2 activity were detected in the 2 cancers from cases 159 and 168 compared to normal. Levels of 65 kD pro-MMP-2 activity also did not change much in colorectal adenomas (Cases 180, 302 and 2 of 3 adenomas from Case 147) but did increase in both carcinomas compared to normal. Pro-MMP-9 activity levels again varied being higher in some adenomas and cancers than matched normal (Cases 147, 377 and 168) with minimal changes by tissue type in other cases (Case 180) and were sometimes lower in adenoma or cancer compared to normal (Cases 302 and 159).
Figure 2.

2a. Zymogram patterns on duplicate gels. Reproducibility of gelatin zymogram banding patterns is illustrated for the same 3 cases (normal and cancer extracts for cases 278 and 279; normal, adenoma and cancer extracts for case 150) electrophoresed on different gels on different days. Samples were stored at −80°C between gel runs. A Coomassie blue stained loading control, as described in the methods section, is shown below each gel.
2b. Zymogram patterns for re-extracted and reassayed samples. Reproducibility of gelatin zymogram banding patterns is illustrated for 6 samples from the same 3 pairs (normal and cancer extracts from cases 91 and 128; normal and adenoma extracts from case 334) that were reextracted and assayed twice.
2c. Standard curve of purified active MMP-2 control. Graphs show gelatin zymography data for four serial dilutions of a purified commercial standard of active MMP-2. Gelatin zymogram results are shown below the graph. Defined activities are given for the purified standard (Calbiochem) in TPH units (thiopeptide hydrolysis units) based on the amount of protein loaded in that lane. Band activity levels were then determined by computer-assisted image analysis using Total Lab software (Nonlinear Dynamics) and resulting data in Total Lab Units (TLU) graphed to generate a curve. Total Lab Units (TLU) represent the activity band in units of intensity in pixels × band area, as plotted on the Y-axis versus commercial activity units for the standard on the X-axis.
2d. Representative serial dilution: Defining serial dilution units (SDU) on a zymogram gel. Tissue extracts (25 mg/lane) of normal mucosa (N174) and carcinoma (C174) for Case 174 were run in undiluted form (N 174, C 174) next to serial dilutions of the cancer sample for Case 174 as labeled above each lane (1:2 through 1:100). For each MMP activity band, the number of serial dilution units (SDU) in a given band for a given lane is shown below that lane. The weakest visible complete band of pro-MMP-9 activity (seen in the 1:50 dilution) was designated 1 SDU of MMP-9 activity with the SDUs for pro-MMP-9 bands in other lanes defined by the known dilution of sample in that lane. Similarly, the weakest complete band of MMP-2 (in the 1:10 dilution lane for active MMP-2) was designated 1 SDU of MMP-2 activity with SDUs for the remaining active MMP-2 (or proMMP-2) bands in other lanes defined similarly by the known dilution of sample in that lane.
Matched tissue sets illustrate a step-wise increase in active MMP-2 activity levels as well as changes in pro-MMP-2 and pro-MMP-9 activities with progression of colorectal tumorigenesis from normal mucosa to adenoma without HGD to adenoma with HGD to carcinoma (e.g. Fig 1b, cases 100, 135 and 150). In contrast, the 80 kD active MMP-9 band was present in fewer than half of the samples analyzed and demonstrated no consistent change with tumor progression (e.g. see Fig 1B) and was not evaluated further. A consistent increase in levels of the 60 kD active MMP-2 activity was observed in colorectal cancer samples versus normal colorectal mucosa, with less dramatic cancer versus normal increases in the 65 kD pro-MMP-2 in most cases and broad variation for pro-MMP-9 including elevated MMP-9 activity in some cancers compared to normal but little change in other cancers (Fig 1a). MMP-2 and MMP-9 activities were also characterized in samples from 6 familial adenomatous polyposis (FAP) cases, including 4 normal mucosa and 6 patient-matched adenomas from 4 individuals plus normal mucosa and matched carcinoma from 2 individuals with probable attenuated FAP (Fig 1c) and the resulting data evaluated statistically as described below.
Assay Controls
To test the reproducibility of gelatinolytic banding patterns, independent assays were run on different days for 24 matched tissue sets. These duplicate assays, illustrated in Fig 2a for three sets of patient matched tissues, including normal/cancer and normal/adenoma/cancer combinations, showed a strong correlation coefficient (0.86; p<0.01). A slightly lower, but still strong, correlation (0.79; p<0.01) was measured for duplicate assays on 29 tissue sets that were re-extracted as well as re-assayed, with minimal tissue heterogeneity revealed by reextraction (illustrated for 3 matched sets in Fig 2b). In addition, we have measured no statistically significant differences in mean active MMP-2 activities between samples of normal tissues obtained locally (BUMC) and those obtained distantly (CHTN) (p=0.91, n=34)
A further assay control involved the treatment of samples with 1mM APMA, resulting in activation to lower molecular weight bands as expected (13). Metalloproteinase inhibitors, EDTA and phenanthroline inhibited gelatinolytic bands on our zymogram gels, confirming that these bands were due to metalloproteinase activities (4). No inhibitors for other classes of proteolytic enzyme, including cysteine (E-64), serine (PMSF) or aspartyl (pepstatin) resulted in inhibition of these bands.
Quantitation of MMP-2 and MMP-9 Activity Levels
Purified standards of active MMP-2, pro-MMP-2 and MMP-9 with defined activity units and protein concentrations were diluted over a specific range and assayed on gelatin zymograms. Individual bands were quantified by image analysis using Total Lab software with resulting data graphed in Total Lab Units (TLU) vs commercially defined μU of activity, as illustrated for active MMP-2 (Fig 2c) and previously reported as well for pro-MMP-2 and pro-MMP-9 (Murnane et al, 2009). Measurements in TLU of active MMP-2, pro-MMP-2 and pro-MMP-9 resulted in linear standard curves over a 4- to 5-fold range but were not linear over a 10-fold range of activity. To improve measurement of gelatinase activities over a broad range observed in normal, adenoma and cancer samples (>200-fold for some comparisons in Fig 1), serial dilution of samples was done to further define activity units (SDU), illustrated for Case 174 (Fig 2d) which had very high activities in the cancer (C174) compared to matched normal tissue (N174). The active MMP-2 band in C174 contained 10 SDU of activity while the pro-MMP-9 band contained 50 SDU. Using data from activity bands in multiple cases (n = 363 bands), the estimated correlation for measurements in TLU by imaging software versus measurements of the same bands evaluated independently in SDU was 0.8 (p<0.01).
Known quantities of commercial standards for active MMP-2, pro-MMP-2 and pro-MMP-9 were electrophoresed on gelatin zymograms next to colorectal tissue extracts (4). These standards confirmed the location of specific activities and provided external controls with defined activity for comparison to unknown samples. Purified controls together with computer imagining and serial dilution measurements made it possible to calculate enzyme activity for each gelatinase in 3 types of interconvertible units/mg protein for different types of tissues including normal mucosa, adenomas without high grade dysplasia, adenomas with high grade dysplasia and colorectal carcinomas (Table 1). For this adenoma study, only cases containing at least one adenoma were included in these calculations.
In addition to activity measurements for each gelatinase, estimates of protein content/mg total soluble protein in normal and cancer tissues could be approximated by comparison of average activity units per mg protein (Table 1) to purified commercial standards. Thus, mean protein concentrations for the individual markers in normal mucosa, adenomas without and with high grade dysplasia and colorectal carcinoma extracts for these 30 non-FAP cases were estimated at 59, 132.4, 263.8 and 529.2 pg active MMP-2/mg total soluble protein; estimated at 2.9, 3.4, 3.5 and 5.2 ng pro-MMP-2/mg total soluble protein and estimated at 11.7, 20.7, 35.7 and 42.1 ng pro-MMP-9/mg total soluble protein respectively. These calculations assume equivalent specific activities for purified standards and corresponding proteins within a tissue extract and therefore may overestimate the MMP protein content within tissue samples as purified control proteins may have lost activity during purification while the same proteins within an extract are often stabilized by the presence of other proteins.
Graphical Analyses
In Figure 3a–c, we present three panels of horizontal boxplots displaying the distributions of activity levels in 75 tissue samples for active MMP-2, pro-MMP-2, and pro-MMP-9 with respect to tissue classifications [Normal, Adenoma without HGD (Adenoma), Adenoma with high grade dysplasia (HGD) or Cancer] arrayed along the vertical axis. These plots demonstrate that median activity levels and variations in range for all three activities are systematically larger with progression from normal to cancer. However, the relative magnitudes of differences in median enzyme activity levels from one tissue type to the next are not identical across markers. Median levels for active MMP-2 (Fig 3a) step up in almost equal increments with progression from normal to adenoma without HGD, adenoma without HGD to adenoma with HGD and adenoma with HGD to cancer. In contrast, median levels of the pro-MMP-2 activity (Fig 3b) do not appear to discriminate between normal and adenoma samples, although some differences are apparent between adenomas with and without HGD or between adenomas with HGD and cancer. Median levels of the pro-MMP-9 activity (Fig 3c), while showing some increases with progression do not discriminate significantly among tissue types except for clearly elevated activity in cancers. These data indicate that levels of active MMP-2 activity successfully discriminated among the tissue types and that the other two enzymes were less successful.
Figure 3. Box plots of active MMP-2, pro-MMP-2 and pro-MMP-9 activities.

MMP-2 and -9 activities for each of four different types of colorectal tissues in patient-matched sets of tissue extracts (Normal colon mucosa, n = 30; Adenomas without HGD (designated Adenoma), n = 18; Adenomas with HGD (designated HGD), n = 16; Cancer, n = 11) are graphed in serial dilution units/mg protein. Median activity levels are represented by a solid vertical line intersecting the central box of each plot.
3a. Median levels of active MMP-2 activity increase in a step-wise pattern with progression from normal to adenoma without HGD to adenoma with HGD to cancer.
3b. Median pro-MMP-2 activity levels show an increase in adenoma with HGD versus adenoma without HGD and another increase in cancers.
3c. Median pro-MMP-9 activity levels increase slightly at each stage but show the greatest increase in carcinomas.
Multinomial logit analysis
Our multinomial logit analyses strongly support the conclusions of the graphical plots in Fig 3 and confirm that active MMP-2 activity levels can discriminate among the four types of tissue. More importantly, these analyses demonstrate that although pro-MMP-2 and pro-MMP-9 activities are able to discriminate to some extent among tissue types, their effect is weak. Two fitted multinomial logit models that support these claims are provided in Table 2. In model M1, we include the main effect of active MMP-2 levels as a predictor (discriminator) of tissue type. As the pattern of coefficients for Model M1 indicates, active MMP-2 activity levels distinguished adenoma without HGD from normal (p=.003), adenoma with HGD from normal (p= .000), and cancer from normal (p=.000). We then used a general linear hypothesis test to examine whether MMP-2 activity levels would distinguish adenoma without HGD from adenoma with HGD and adenoma with HGD from cancer. We confirmed that active MMP-2 activity levels did clearly distinguish adenomas with HGD from those without HGD (p= .007). Active MMP-2 levels also distinguished adenomas with HGD from cancers samples but at a somewhat higher P value (p=0.104). The likely explanation for the slightly weaker pattern is that there were just 12 cancers versus 18 adenomas without HGD and 16 adenomas with HGD in our set of patient-matched tissues. When we add predictors representing the main effects of pro-MMP-2 and pro-MMP-9 activities to form model M2, levels of active MMP-2 activity remain a statistically significant discriminator of normal mucosa from all other samples (p=.003; p=.001; p=.000, respectively). Comparing the goodness-of-fit statistics between nested models M1 and M2 confirms that simultaneous addition of the pro-MMP-2 and pro-MMP-9 activity levels as predictors to the model for these distinctions resulted in no statistically significant improvement in prediction once active MMP-2 had been controlled (χ2=9.48; df=6, p=0.15). To aid in the interpretation of our multinomial logit analyses in Table 2, Model M1, we used the fitted results to calculate the predicted probability that a tissue sample with a particular MMP-2 activity level is normal, adenoma without HGD, adenoma with HGD or cancer. The predicted probabilities are displayed graphically in Figure 4.
Table 2.
Parameter estimates (robust standard errors) and approximate p-values from two fitted multinomial logit models that discriminate among colorectal tissue types using active MMP-2, pro-MMP-2 and pro-MMP-9 activity levels
| Fitted Multinomial Logit Model |
||
|---|---|---|
| M1: Main effect of Active MMP-2 | M2: Main effect of Active MMP-2, controlling for the main effects of Pro-MMP-9 & Pro-MMP-2 | |
| Adenoma (A) vs. Normal (N): | ||
| Intercept | −1.315*** (0.329) | −1.149** (0.504) |
| Active MMP-2 | 0.037** (0.012) | 0.050** (0.017) |
| Pro-MMP-2 | −0.005 (0.003) | |
| Pro-MMP-9 | 0.001 (0.001) | |
| High Grade Dysplasia(HGD) vs. Normal (N): | ||
| Intercept | −2.798*** (0.628) | −2.046** (0.716) |
| Active MMP-2 | 0.066*** (0.017) | 0.095*** (0.030) |
| Pro-MMP-2 | −0.013 (0.008) | |
| Pro-MMP-9 | 0.001 (0.001) | |
| Cancer (C) vs. Normal (N): | ||
| Intercept | −4.494*** (1.196) | −3.606** (1.316) |
| Active MMP-2 | 0.084*** (0.021) | 0.114*** (0.033) |
| Pro-MMP-2 | −0.014 (0.008) | |
| Pro-MMP-9 | 0.001 (0.001) | |
| −2LL | 154.18 | 144.70 |
| Pseudo-R2 Statistic | 0.269 | 0.314 |
p<.05;
p<.01;
p<.001;
tissue samples, n=79, patients, n=30
Figure 4. Multiple Regression.

Estimated probabilities of declaring a colorectal tissue sample as either normal, adenoma without HGD, adenoma with HGD or cancer graphed with respect to levels of active MMP-2 activity (SDU/mg) in that sample. At any given value a comparison of these probabilities permits prediction of the most probable diagnosis of the tissue as one of these four tissue types.
We also supplemented the multinomial logit regression analyses by generating receiver operator characteristic (ROC) curves on the group of patient matched samples being characterized for this study to determine the sensitivity and specificity of the individual MMP-2 and MMP-9 activities for their respective abilities to discriminate sets of 2 tissue types, including adenomas without HGD versus adenomas with HGD and adenomas with HGD versus cancers. ROC curves showed that active MMP-2 activity levels ≥ 56 SDU/mg could distinguish adenomas with HGD from those without HGD with a sensitivity of 69% and a specificity of 78%. In addition, active MMP-2 activity levels ≥ 80 SDU/mg could distinguish cancers from adenomas with HGD with a sensitivity of 79% and a specificity of 69%. Neither pro-MMP-2 nor pro-MMP-9 was as effective as active MMP-2 in making such distinctions among these colorectal tissue types.
Active MMP-2 Activity in FAP Cases
Extrapolating from Figure 4 data also makes it possible to interpret information on the 10 normal and adenoma tissue samples from patients with classic FAP. These cases were not included in the analytic sample used to fit the multinomial models in Table 2. However, based on Fig 4, each of the four normal mucosa samples from FAP cases had levels of active MMP-2 activity resembling normal mucosa from non-FAP cases. Yet our predictions from Fig 4 would also categorize 6/6 FAP adenomas without HGD as normal. These results suggest that the presence of a germline APC mutation does not trigger increased active MMP-2 activity levels in either normal mucosa or adenomas without HGD from FAP individuals. Despite this difference in active MMP-2 levels in adenomas without HGD from non-FAP (where levels are higher than normal) and FAP cases (where levels are not higher than normal), the cancer samples from two individual cases with probable attenuated FAP (Fig 1c) demonstrated significantly increased active MMP-2 activity levels typical of cancers from non-FAP individuals. These results indicate that the presence of a mutant APC gene does not by itself result in increased active MMP-2 activity levels in either normal mucosa or adenomas without HGD, but that active MMP-2 activity levels are elevated in cancers from individuals with probable attenuated FAP just as they are in sporadic colorectal cancers.
MMP Activities and Adenoma Size
We also asked whether levels of these different MMP-2 or MMP-9 activities would predict adenoma size, using our sample of 30 adenomas (both with and without HGD) from non-FAP individuals that ranged from 0.3 to 15 cm. None of the Pearson correlation coefficients estimating the relationship between activity levels and adenoma size was statistically significant. However, the majority of adenomas analyzed for this study were relatively large (87 % were ≥1 cm) which could prevent a strong test comparing large (≥1cm) vs. small (<1cm) adenomas with respect to activity levels.
In supplementary binomial logit analyses we also tested whether levels of each marker enzyme could distinguish large adenomas (≥1 cm) with HGD from large adenomas without HGD. Results indicate that levels of active MMP-2 activity did distinguish between these two conditions (p=.017) in large adenomas, while levels of pro-MMP-2 and pro-MMP-9 activities did not.
Discussion
Despite a formal recommendation by the US Multi-Society Task Force on colorectal cancer and the American Cancer Society (19) that a pathologic diagnosis of “high grade dysplasia” contributes to predicting future cancer risk and can be used to plan the frequency of follow-up colonoscopies, there is currently no precise definition of HGD (2, 20). A lack of consistency and objective criteria for pathologic assessment of colorectal adenomas underscores the importance of identifying new biomarkers that might help in the identification of malignant potential within a given adenoma. We have attempted to address this issue by determining whether active MMP-2, pro-MMP-2 or pro-MMP-9 activities either alone or in combination effectively discriminate among various colorectal lesions, in particular between adenomas with and without HGD.
MMP-2 and MMP-9 Activity Levels in Colorectal Adenomas
Results from our data analyses demonstrate increases in activity levels over normal for all three markers during progression from normal mucosa to carcinoma. However, changes in pro-MMP-2 and pro-MMP-9 were not sufficiently distinctive at each stage of progression to discriminate among each of four different types of colorectal tissue (normal mucosa, adenoma without HGD, adenoma with HGD and cancer). Active MMP-2 activity levels, in contrast, could be employed quite accurately to sort out tissue types. A particularly useful observation was that active MMP-2 activity was significantly elevated in adenomas defined as having HGD compared to those without HGD. Since adenomas with HGD are thought to contain “cancerous cells” that have not yet invaded through the basement membrane, these results provide strong evidence that active MMP-2 is capable of detecting very early cancers present within advanced adenomas.
To our knowledge, this is the first report of increased levels of active MMP-2 activity in typical colorectal adenomas with or without HGD. Metalloproteinases have often been characterized in cancers rather than adenomas because these enzymes traditionally have been associated with invasion and metastasis rather than premalignant tumorigenesis. Yet MMPs are also known for activation cleavages of many proteins in pathways related to angiogenesis, growth control and inflammation as well as invasion and metastasis (21). Thus, it is not surprising that a role for several MMPs has been documented in early colorectal tumor progression including MMP-7, which is upregulated in 50–80% of adenomas (21, 22).
As illustrated in Figures 1 and 2 of our current study, pro-MMP-9 activity levels are also elevated in some adenomas, with or without HGD, confirming previous reports describing increased MMP-9 in adenomas as detected by immunohistochemical staining (23, 24), RT-PCR (23) or activity assays (25). Gimeno-Garcia and colleagues (25) reported that pro-MMP-9 was progressively elevated at every step of colorectal progression, from non-advanced colorectal adenomas (defined by these authors as <1 cm) to advanced colorectal adenomas (defined as ≥ 1 cm) as well as in adenomas with high grade dysplasia. In our current study, we have observed some increases in both pro-MMP-2 and pro-MMP-9 activity levels with adenoma progression but neither pro-MMP-2 nor pro-MMP-9 levels were as effective as active MMP-2 in discriminating among the different pathologic stages.
Despite published reports for elevated MMP-7 and MMP-9 levels in adenomas, there are almost no corresponding reports of active MMP-2 in colorectal adenomas, although studies have frequently shown increased active MMP-2 activity levels in cancers (26, 27). Negative results for detection of active MMP-2 activity in adenomas may very well reflect the difficulties of assaying small adenoma samples for a marker present at low concentrations. We measured an average of 3 pg of active MMP-2 in 25 mg soluble protein (amount loaded per gel slot) which is close to the lower limits of sensitivity (2pg) reported for detection of any MMP-2 activity in purified standard controls (28). However, active MMP-2 activity at levels close to those of cancers has been detected in 4 flat-depressed adenomas (25) although that same report described no increased active MMP-2 activity in 118 more typical adenomas, including 11 with high grade dysplasia. The authors, however, suggested that their study may have been limited by small biopsy specimens obtained at colonoscopy (only 3–5 mg total tissue assayed per case). Their samples were also extracted in a buffer containing an array of proteinase inhibitors (25), often used to prevent generalized protein degradation. While a reversible metalloproteinase inhibitor such as EDTA is largely removed during gel electrophoresis, this protocol may, nonetheless, have minimized detection of active MMP-2 activity in adenomas, where activity levels are already quite low, while still permitting some detection in samples with intrinsically higher activity levels (e.g. cancers).
In our current study we have also utilized surgically excised adenomas rather than biopsy specimens and thus obtained larger adenomas (only 4 were <1cm in size) which are easier to extract and study. While it is possible that the specific activity of active MMP-2 may also increase with adenoma size, we did not find a strong correlation between adenoma size and active MMP-2 activities. Our study, however, had too few small adenomas (<1cm in size) to make valid comparisons of activity levels based on size. Yet specific samples in our study suggest that size alone will not predict active MMP-2 activity levels as the smallest adenoma we analyzed (a 0.3 cm tubular adenoma with HGD) demonstrated levels that were 6-fold higher than normal while a large (8.5cm) tubular adenoma without high grade dysplasia had no detectable active MMP-2 activity.
Assay Methodologies
To analyze our data we used a multinomial logit approach which is the equivalent of a more traditional discriminant analysis. Each approach is designed to discriminate among all four categories of tissue simultaneously, limiting the Type I error that would accumulate in multiple pair-wise comparisons and capitalizing on the statistical power present in the full sample. In addition, multinomial logit analysis avoids reliance on the assumption of multivariate normality among the predictors that is required of the classical discriminant analysis and thus allows us to predict the probability with which each tissue type would occur at any given value of an enzyme level. From these probabilities, we can deduce the range of enzyme levels over which any particular diagnosis is the most probable.
Based on the fitted multinomial logistic regression model described here, and illustrated in Figure 4, when the level of active MMP-2 activity exceeds 50 SDU/mg we would predict the presence of high grade dysplasia in a colorectal carcinoma. This 50 SDU/mg cut-off value is very close to that defined in our previous study (≥ 44 SDU active MMP-2 activity/mg) as the cut-off for detection of cancer with a sensitivity of (84%) and specificity of (93%). However, in the previous study we only examined two tissue types (normal colorectal mucosa and carcinoma) without any adenomas, which is an easier comparison given more dramatic differences between normal and cancer tissues. Yet active MMP-2 activity levels in the current set of tissues, that includes adenomas as well as normal and cancer tissues, were still able to provide useful discriminatory information about the tissue types. Among our samples that had a pathologic diagnosis of “adenoma without high grade dysplasia,” we also identified 3/15 tissues (20%) as having active MMP-2 activity levels ≥50 SDU/mg which, based on multinomial regression analyses, are likely to contain as yet undetected high grade dysplasia or “early cancer” within the adenoma These results provide an example of the potential use of active MMP-2 activity as an independent marker of cancer within an adenoma that might otherwise not be diagnosed as having HGD.
The use of an ROC curve did permit determination of values at which we can estimate sensitivity and specificity for this marker in a comparison of two tissue types. When we applied an ROC curve calculation to the most interesting distinctions among combinations of 2 similar tissues, we found that a value for active MMP-2 of 56 SDU/mg could distinguish the presence of high grade dysplasia in a colorectal adenoma with a sensitivity of 69% and a specificity of 78% compared to an adenoma without high grade dysplasia. In addition, at a value of 80 SDU/mg, the active MMP-2 could identify the presence of cancer with a sensitivity of 79% and a specificity of 69% in comparison to adenomas with HGD.
APC mutation and activation of MMP-2
An APC mutation is one of the most consistent molecular changes observed in colorectal cancers (29). Detected in more than 50% of simple adenomas (30), it is considered an early change in colorectal tumorigenesis. With subsequent tumor progression the frequency of an APC mutation increases to approximately 75% in sporadic colorectal carcinomas. In rare individuals with familial adenomatous polyposis (FAP) a germ line mutation in the APC gene has been inherited in every body cell.
Given the frequency of the APC mutations in sporadic colorectal cancers and its frequent appearance in adenomas, we tested whether presence of a germline APC mutation might trigger increased levels of MMP-2 or MMP-9 activities in normal mucosa or adenomas of individuals with FAP compared to non-FAP cases. Previous studies have shown that in patients with FAP, MMP-7 is constitutively overexpressed in all polyps, regardless of size or dysplasia, although this was not true in sporadic adenomas from non-FAP cases (22, 31). Our studies, however, for MMP-2 and MMP-9 activities in FAP colorectal samples showed a different pattern for these particular MMPs. Analysis of activities in normal mucosa samples from FAP cases showed no significant increases, indicating that a germline APC mutation by itself does not trigger increased MMP-2 or MMP-9 activity levels. In addition, although we had observed increased active MMP-2 activity levels in sporadic adenomas from non-FAP cases, such increases were not observed in adenomas from FAP individuals. Nonetheless, cancers from 2 individuals with probable attenuated FAP demonstrated active MMP-2 activity levels typical of sporadic colorectal cancer and well above the cut offs for cancer as defined by our models. These results suggest that active MMP-2 activity levels are neither caused by nor limited by the presence of germline APC gene mutations. This observation together with our previous report (4) demonstrating a very high frequency of increased active MMP-2 activity levels in colorectal cancers (95% showed increased active MMP-2 activity, on average 10-fold), suggests that the activation of MMP-2 may reflect an important end result in formation of colorectal cancers, irrespective of the particular molecular pathway by which a colorectal cancer has been generated.
Mechanisms of MMP-2 Activation
Given that active MMP-2 levels will distinguish colorectal adenomas with and without high grade dysplasia, measurement of the protein responsible for MMP-2 activation might predict the risk of cancer developing within a colorectal adenoma even earlier than in adenomas with high grade dysplasia. To test this possibility, we used immunoblots of extracts from two cases to obtain preliminary data on protein levels for the membrane-type 1 matrix metalloproteinase (MT1-MMP or MMP-14), which is known to activate MMP-2 within a tri-molecular complex of MT1-MMP/TIMP2/pro-MMP-2 (32–35). We predicted a positive correlation between MT1-MMP protein levels and active MMP-2 activity levels based on published reports (36) that had described increased mean mRNA levels for MT1-MMP (37) and immunohistochemical staining of MT1-MMP protein (38) in colorectal cancers versus normal mucosa. Our results, however, demonstrated MT1-MMP protein levels that were dramatically lower overall in the two cancers compared to the matched normal mucosa despite the fact that each case had higher active MMP-2 activity in cancer than normal (Murnane lab, unpublished data). Although this result, confirmed by reassay, challenged our initial hypothesis that MT1-MMP protein levels would increase in colorectal cancers versus normal mucosa, our observation is supported by other reports. Ornstein and Cohn (39) found increased or decreased MT1-MMP expression in individual cancers versus normal tissues but no significant difference overall (p=0.23) for MT1-MMP mRNA levels in 22 matched normal/colorectal cancer pairs. Kikuchi and colleagues only detected positive immunohistochemical staining for MT1-MMP protein in less than half of primary colorectal carcinomas (n=92) and metastatic lesions (n=20) (40). Data from many laboratories suggest that MT1-MMP protein levels may not necessarily correlate with MMP-2 activity levels due to involvement of additional molecules in the activation of MMP-2.
Recent literature indicates that the MT1-MMP/TIMP-2/pro-MMP-2 complex defines just one of several possible mechanisms for in vivo activation of MMP-2. In a review of MMP catalytic activities, Ra and Parks (41) suggest that TIMP-2 but not MT1-MMP is required for MMP-2 activation, as TIMP-2 null mice have been shown to lack pro-MMP-2 activation while a similar deficiency of MT1-MMP had almost no effect (if any) on pro-MMP-2 activation (35). Additional reports show that pro-MMP-2 can combine with MT2-MMP (MMP-15) or MT3-MMP (MMP-16) as well as with MT1-MMP (MMP-14) and that each of these protein duos can form ternary complexes with either TIMP-2 or TIMP-3 to activate MMP-2 (42,43). Some combinations are more effective than others. Zhao and colleagues (43) demonstrated that while TIMP-3 can enhance the MT3-MMP activation of MMP-2, full activation of pro-MMP-2 required TIMP-2. Yet even though TIMP-2 has been shown in several studies to be required for full MMP-2 activation, English et al (44) demonstrated that even TIMP-2 may not be required if both TIMP-2 and TIMP-3 are missing at the same time (i.e. in a TIMP 2−/− and TIMP 3−/− cell line). Under these circumstances an accumulation primarily of intermediate MMP-2 occurred together with some fully activated MMP-2.
In addition to well-documented roles for MT-MMP/TIMP complexes in MMP-2 activation, further alternatives have been reported, including activation by other proteases such as mast cell chymase-4 (a serine proteinase) (45) or by oxidants generated by leukocytes or other cells known to both activate (via oxidation of the prodomain thiol followed by autocatalytic cleavage) and subsequently inactivate MMPs (41) A number of pro-MMPs have also been shown to be activated by reactive oxygen species (ROS) in vitro, including pro-MMP-2 by peroxynitrate (46). A study by Kim and colleagues has demonstrated pro-MMP-2 activation in HT-1080 cells via the generation of ROS and ERK activation (47) but additional work is needed to document more directly the mechanisms for in vivo activation of MMP-2 by ROS
Thus, no single protein seems absolutely required for MMP-2 activation. This would explain the observation of elevated MMP-2 activity in cancers that might have either a gain, a loss or no change in a particular MT-MMP or TIMP level and would suggest that the balance of expression of these various MT-MMPs and TIMPs within a given cancer may be the primary determinant of MMP-2 activation status with some additional factors also capable of modifying active MMP-2 activity levels. Differences in the mechanisms of activation of MMP-2 for individual cancers may define distinctive categories of these cancers possibly reflecting, in turn, the well-known alternative molecular pathways by which colorectal carcinomas can develop (48,49).
Irrespective of activation mechanism, the significant upregulation of active MMP-2 activity in adenomas with high grade dysplasia as well as the high frequency of elevation of active MMP-2 activity in cancers—occurring in 95% of colorectal carcinomas (4)—suggest that active MMP-2 activity may be critically important in colorectal malignancies.
Conclusions
Our observations indicate that active MMP-2 activity levels, in addition to identifying colorectal cancers, as previously described, can provide a measure of the risk of cancer within adenomas, and can be used to discriminate between adenomas with high grade dysplasia and adenomas without high grade dysplasia.
Acknowledgments
Tissues were obtained through Boston Medical Center and the Cooperative Human Tissue Network (CHTN). We would like to acknowledge Dr. Michael J. O'Brien and the pathologists, residents and fellows of the Department of Pathology and Laboratory Medicine at Boston University School of Medicine for assistance in obtaining tissue samples. This work was funded by grants from the NIH: R21 CA81515 and R21 CA100837 (M.J. Murnane) and from the Cancer Research and Prevention Foundation (M.J. Murnane).
Funding: This study was funded by NIH grants R21 CA81515 and R21 CA100837 (MJM) and by a Cancer Research and Prevention Foundation grant (MJM)
Footnotes
Publisher's Disclaimer: This is a PDF file of an unedited manuscript that has been accepted for publication. As a service to our customers we are providing this early version of the manuscript. The manuscript will undergo copyediting, typesetting, and review of the resulting proof before it is published in its final citable form. Please note that during the production process errors may be discovered which could affect the content, and all legal disclaimers that apply to the journal pertain.
REFERENCES
- 1.Rex DK, Goldblum JR. PRO: Villous elements and high grade dysplasia help guide post-polypectomy colonoscopic surveillance. Am J Gastroenterol. 2008;103:1327–1329. doi: 10.1111/j.1572-0241.2008.02005_2.x. [DOI] [PubMed] [Google Scholar]
- 2.Appelman HD. CON: High-grade dysplasia and villous features should not be part of the routine diagnosis of colorectal adenomas. Am. J. Gastroenterol. 2008;103:1329–1331. doi: 10.1111/j.1572-0241.2008.02005_3.x. [DOI] [PubMed] [Google Scholar]
- 3.Odze R. A balancing view: Pathologist-clinician interaction is essential. Am. J. Gastroenterol. 2008;103:1331–1333. doi: 10.1111/j.1572-0241.2008.02005_4.x. [DOI] [PubMed] [Google Scholar]
- 4.Murnane MJ, Cai J, Shuja S, McAneny D, Klepeis V, Willett JA. Active MMP-2 effectively identified the presence of colorectal cancer. Int. J. Cancer. 2009;125:2893–2902. doi: 10.1002/ijc.24682. [DOI] [PMC free article] [PubMed] [Google Scholar]
- 5.Heslin MJ, Yan J, Johnson MR, Weiss H, Diasio RB, Urist MM. Role of Matrix Metalloproteinases in Colorectal Carcinogenesis. Annals Surg. 2001;233:786–792. doi: 10.1097/00000658-200106000-00008. [DOI] [PMC free article] [PubMed] [Google Scholar]
- 6.Kumar V, Abbas A, Fausto N. Robbins and Cotran Pathologic basis of disease. 7th Edition Elsevier Saunders; Philadelphia, PA: 2005. p. 862. [Google Scholar]
- 7.American Joint Committee on Cancer . Manual for staging cancer. 3rd edition J.B. Lippincott: Philadelphia; Philadelphia, PA: 1988. [Google Scholar]
- 8.Rosner B. Duxbury. Duxbury; Pacific Grove CA: 2000. Fundamentals of biostatistics. [Google Scholar]
- 9.Nichols EA, Ruddle FH. A review of enzyme polymorphism, linkage and electrophoretic conditions for mouse and somatic cell hybrids in starch gel. J. Histochem. 1973;21:1066–1081. doi: 10.1177/21.12.1066. [DOI] [PubMed] [Google Scholar]
- 10.Lowry OH, Rosebrough NJ, Farr AL, Randall RJ. Protein measurement with the Folin phenol reagent. J Biol Chem. 1951;193:265–275. [PubMed] [Google Scholar]
- 11.Rao JS, Steck PA, Mohanam S, Stetler-Stevenson WG, Liotta L, Sawaya R. Elevated levels of Mr 92,000 type IV collagenase in human brain tumors. Canc Res. 1993;53:2208–2211. [PubMed] [Google Scholar]
- 12.Murnane MJ, Shuja S, Del Re E, Cai J, Iacobuzio-Donahue C, Klepeis V. Characterizing human colorectal carcinomas by proteolytic profile. In vivo. 1997;11:209–216. [PubMed] [Google Scholar]
- 13.Itoh Y, Binner S, Nagase H. Steps involved in activation of the complex of pro-matrix metalloproteinase 2 (progelatinase A) and tissue inhibitor of metalloproteinases (TIMP)-2 by 4-aminophenylmercuric acetate. Biochem J. 1995;308:645–651. doi: 10.1042/bj3080645. [DOI] [PMC free article] [PubMed] [Google Scholar]
- 14.Birkedal-Hansen H, Taylor RE. Detergent-activation of latent collagenase and resolution of its component molecules. Biochem Biophys Res Comm. 1982;107:1173–1178. doi: 10.1016/s0006-291x(82)80120-4. [DOI] [PubMed] [Google Scholar]
- 15.Murnane MJ, Cai J, Shuja S, Cote L, DelRe E, Iacobuzio-Donahue C, Kim K, Sheahan K. Changing patterns of proteolytic expression with colorectal tumor progression. In: Suzuki M, Hiwasa T, editors. Proteases involved in cancer. Monduzzi Editore; Bologna, Italy: 1994. pp. 1–11. Bologna. [Google Scholar]
- 16.Xia T, Akers K, Eisen AZ, Seltzer JL. Comparison of cleavage site specificity of gelatinases A and B using collagenous peptides. Biochim Biophys Acta. 1996;1293:259–66. doi: 10.1016/0167-4838(95)00259-6. [DOI] [PubMed] [Google Scholar]
- 17.Kolkenbrock H, Hecker-Kia A, Orgel D, Kinawi A, Ulbrich N. Progelatinase B forms from human neutrophils. Complex formation of monomer/lipocalin with TIMP-1. Biol. Chem. 1996;377:529–533. doi: 10.1515/bchm3.1996.377.7-8.529. [DOI] [PubMed] [Google Scholar]
- 18.Hosmer DW, Lemeshow S. Applied logistic regression. 2nd edition. John Wiley & Sons; New York, NY: 2000. New York, NY. [Google Scholar]
- 19.Winawer SJ, Zauber AG, Fletcher RH, Stillman JS, O'Brien MJ, Levin B, Smith RA, Lieberman DA, Burt RW, Levin TR, Bond JH, Brooks D, Byers T, Hyman N, Kirk L, Thorson A, Simmang C, Johnson D, Rex DK, et al. Guidelines for colonoscopy surveillance after polypectomy: A consensus update by the US Multi-Society Task Force on Colorectal Cancer and the American Cancer Society. Gastroenterology. 2006;130:1872–85. doi: 10.1053/j.gastro.2006.03.012. [DOI] [PubMed] [Google Scholar]
- 20.Riddell RH, Petras RE, Williams GT, Sobin LH. Atlas of tumor pathology, tumors of the intestines, American Registry of Pathology. Chapter 3. American registry of pathology; Washington, DC: 2002. Epithelial neoplasms of the intestines; pp. 85–100. Washington, DC. [Google Scholar]
- 21.Newell KJ, Witty JP, Rodgers WH, Matrisian LM. Expression and localization of matrix-degrading metalloproteinases during colorectal tumorigenesis. Mol Carcinog. 1994;10:199–206. doi: 10.1002/mc.2940100404. [DOI] [PubMed] [Google Scholar]
- 22.Kirimlioglu H, Kirimlioglu V, Yilmaz S, Sagir V, Coban S, Turkmen E, Hilmioglu F. Role of matrix metalloproteinase-7 in colorectal adenomas. Dig Dis Sci. 2006;51:2068–2072. doi: 10.1007/s10620-005-9070-4. [DOI] [PubMed] [Google Scholar]
- 23.Herszenyi L, Sipos F, Galamb O, Solymosi N, Hritz I, Miheller P, Berczi L, Molnar B, Tulassay Z. Matrix metalloproteinase-9 expression in the normal mucosa-adenoma-dysplasiaadenocarcinoma sequence of the colon. Pathol Oncol Res. 2008;14:31–37. doi: 10.1007/s12253-008-9004-5. [DOI] [PubMed] [Google Scholar]
- 24.Daniel P, Wagrowska-Danilewicz M, Danilewicz M, Stasikowska O, Malecka-Panas E. Transforming growth factor beta 1 and metalloproteinase-9 overexpression in colorectal cancer (CC) and adenoma. Int J Colorectal Dis. 2007;22(10):1165–72. doi: 10.1007/s00384-007-0296-9. [DOI] [PubMed] [Google Scholar]
- 25.Gimeno-Garcia AZ, Santana-Rodriguez A, Jimenez A, Parro-Blanco A, Nicholas-Perez D, Paz-Cabrera C, Diaz-Gonzalez F, Medina C, Diaz-Flores L, Quintero E. Up-regulation of gelatinases in the colorectal adenoma-carcinoma sequence. European J Cancer. 2006;42:3146–3252. doi: 10.1016/j.ejca.2006.06.025. [DOI] [PubMed] [Google Scholar]
- 26.Parsons SL, Watson SA, Collins HM, Griffin NR, Clarke PA, Steele RJ. Gelatinase (MMP-2 and 9) expression in gastrointestinal malignancy. Brit J Cancer. 1998;78:1495–1502. doi: 10.1038/bjc.1998.712. [DOI] [PMC free article] [PubMed] [Google Scholar]
- 27.Baker EA, Bergin FG, Leaper DJ. Matrix metalloproteinases, their tissue inhibitors and colorectal cancer staging. Br J Surg. 2000;87:1215–21. doi: 10.1046/j.1365-2168.2000.01531.x. [DOI] [PubMed] [Google Scholar]
- 28.Kleiner DE, Stetler-Stevenson WG. Quantitative zymography: detection of picogram quantities of gelatinases. Anal Biochem. 1994;218:325–329. doi: 10.1006/abio.1994.1186. [DOI] [PubMed] [Google Scholar]
- 29.Fodde R, Smits, Clevers H. APC, signal transduction and genetic instability in colorectal cancer. Nature Rev, Cancer. 2001:55–67. doi: 10.1038/35094067. [DOI] [PubMed] [Google Scholar]
- 30.Hermsen M, Postma C, Baak J, Weiss M, Rapallo A, Sciutto A, Roeman G, Arends J-W, Williams R, Giaretti W, De Goeij A, Meijer G. Colorectal adenoma to carcinoma progression follows multiple pathways of chromosomal instability. Gastroenterol. 2001;123:1109–1119. doi: 10.1053/gast.2002.36051. [DOI] [PubMed] [Google Scholar]
- 31.Takeuchi N, Ichikawa Y, Ishikawa T, Momiyama N, Hasegawa S, Nagashima Y, Miyazaki K, Koshikawa N, Mitsuhashi M, Shimada H. Matrilysin gene expression in sporadic and familial colorectal adenomas. Mol Carcinog. 1997;24:177–187. [PubMed] [Google Scholar]
- 32.Caterina JJ, Yamada S, Caterina NC, Longenecker G, Holmback K, Shi J, Yermovsky AE, Engler JA, Birkedal-Hansen H. Inactivating mutation of the mouse tissue inhibitor of metalloproteinases-2 (TIMP-2) gene alters proMMP-2 activation. J Biol Chem. 2000;275:26416–26422. doi: 10.1074/jbc.M001271200. [DOI] [PubMed] [Google Scholar]
- 33.Hernandez-Barrantes S, Toth M, Bernardo MM, Yurkova M, Gervasi DC, Raz Y, Sang QA, Fridman R. Binding of active (57 kDa) membrane type 1-matrix metalloproteinase (MT1-MMP) to tissue inhibitor of metalloproteinase (TIMP)-2 regulates MT1-MMP processing and pro-MMP-2 activation. J Biol Chem. 2000;275:12080–9. doi: 10.1074/jbc.275.16.12080. [DOI] [PubMed] [Google Scholar]
- 34.Strongin AY, Collier I, Bannikov G, Marmer BL, Grant GA, Goldberg GI. Mechanism of Cell Surface Activation Of 72-kDa Type IV Collagenase. J Biol Chem. 1995;270:5331–5338. doi: 10.1074/jbc.270.10.5331. [DOI] [PubMed] [Google Scholar]
- 35.Wang Z, Juttermann R, Soloway PD. TIMP-2 is required for efficient activation of proMMP-2 in vivo. J Biol. Chem. 2000;275:26411–26415. doi: 10.1074/jbc.M001270200. [DOI] [PMC free article] [PubMed] [Google Scholar]
- 36.Zucker S, Vacirca J. Role of matrix metalloproteinases (MMPs) in colorectal cancer. Cancer and Metastasis Rev. 2004;23:101–117. doi: 10.1023/a:1025867130437. [DOI] [PubMed] [Google Scholar]
- 37.Sardinha TC, Nogueras JJ, Xiong H, Weiss EG, Wexner SD, Abramson S. Membrane-type 1 matrix metalloproteinase mRNA expression in colorectal cancer. Dis Colon Rectum. 2000;43:389–395. doi: 10.1007/BF02258307. [DOI] [PubMed] [Google Scholar]
- 38.Malhotra S, Newman E, Eisenberg D, Scholes J, Wieczorek R, Mignatti P, Shamamian P. Increased membrane type 1 matrix metalloproteinase expression from adenoma to colon cancer: a possible mechanism of neoplastic progression. Dis Colon Rectum. 2002;45:537–543. doi: 10.1007/s10350-004-6236-7. [DOI] [PubMed] [Google Scholar]
- 39.Ornstein DL, Cohn KH. The balance between activation and inhibition of matrix metalloproteinase-2 is altered in colorectal tumors compared to normal colonic epithelium. Dig Dis Sci. 2002;47:1821–1830. doi: 10.1023/a:1016456914723. [DOI] [PubMed] [Google Scholar]
- 40.Kikuchi R, Noguchi T, Takeno S, Kubo N, Uchida Y. Immunohistochemical detection of membrane-type-1-matrix metalloproteinase in colorectal carcinoma. Br J Cancer. 2000;83:215–218. doi: 10.1054/bjoc.2000.1195. [DOI] [PMC free article] [PubMed] [Google Scholar]
- 41.Ra H-J, Parks WC. Control of matrix metalloproteinase catalytic activity. Matrix Biol. 2007;26:587–596. doi: 10.1016/j.matbio.2007.07.001. [DOI] [PMC free article] [PubMed] [Google Scholar]
- 42.Morrison CJ, Butler GS, Bigg HF, Roberts CR, Soloway PD, Overall CM. Cellular activation of MMP-2 (gelatinase A) by MT2-MMP occurs via a TIMP-2-independent pathway. J Biol Chem. 2001;276:47402–47410. doi: 10.1074/jbc.M108643200. [DOI] [PubMed] [Google Scholar]
- 43.Zhao H, Bernardo MM, Osenkowski P, Sohail A, Pei D, Nagase H, Kashiwagi M, Soloway PD, DeClerck YA, Fridman R. Differential Inhibition of MT3-MMP and MT1-MMP by TIMP-2 and TIMP-3 Regulates Pro-MMP-2 Activation. J Biol Chem. 2004;279:8592–8601. doi: 10.1074/jbc.M308708200. [DOI] [PubMed] [Google Scholar]
- 44.English JL, Kassiri Z, Koskivirta I, Atkinson SJ, Di Grappa M, Soloway PD, Nagase H, Vuorio E, Murphy G, Khokha R. Individual Timp Deficiencies Differentially Impact Pro-MMP-2 Activation. J Biol Chem. 2006;281:10337–10346. doi: 10.1074/jbc.M512009200. [DOI] [PubMed] [Google Scholar]
- 45.Tchougounova E, Lundequist A, Fajardo I, Winberg JO, Abrink M, Pejler G. A key role for mast cell chymase in the activation of pro-matrix metalloprotease-9 and pro-matrix metalloprotease-2. J Biol Chem. 2005;280:9291–9296. doi: 10.1074/jbc.M410396200. [DOI] [PubMed] [Google Scholar]
- 46.Okamoto T, Akaike T, Nagano T, Miyajima S, Suga M, Ando M, Ichimori K, Maeda H. Activation of human neutrophil procollagenase by nitrogen dioxide and peroxynitrite: a novel mechanism for procollagenase activation involving nitric oxide. Arch Biochem Biophys. 1997;342:261–74. doi: 10.1006/abbi.1997.0127. [DOI] [PubMed] [Google Scholar]
- 47.Kim K-H, Cho YS, Park J-M, Yoon S-O, Kim K-W, Chung A-S. Pro-MMP-2 activation by the PPARg agonist, ciglitazone, induces cell invasion through the generation of ROS and the activation of ERK. FEBS Lett. 2007;581:3303–3310. doi: 10.1016/j.febslet.2007.06.012. [DOI] [PubMed] [Google Scholar]
- 48.Ogino S, Goel A. Molecular classification and correlates in colorectal cancer. J Mol Diagn. 2008;10:13–27. doi: 10.2353/jmoldx.2008.070082. [DOI] [PMC free article] [PubMed] [Google Scholar]
- 49.Soreide K, Nedrebo BS, Knapp JC, Glomsaker TB, Soreide JA, Korner H. Evolving molecular classification by genomic and proteomic biomarkers in colorectal cancer: potential implications for the surgical oncologist. Surg Oncol. 2009;18:31–50. doi: 10.1016/j.suronc.2008.06.006. [DOI] [PubMed] [Google Scholar]