Abstract
To visualize Ca2+-dependent protein–protein interactions in living cells by fluorescence readouts, we used a circularly permuted green fluorescent protein (cpGFP), in which the amino and carboxyl portions had been interchanged and reconnected by a short spacer between the original termini. The cpGFP was fused to calmodulin and its target peptide, M13. The chimeric protein, which we have named “pericam,” was fluorescent and its spectral properties changed reversibly with the amount of Ca2+, probably because of the interaction between calmodulin and M13 leading to an alteration of the environment surrounding the chromophore. Three types of pericam were obtained by mutating several amino acids adjacent to the chromophore. Of these, “flash-pericam” became brighter with Ca2+, whereas “inverse-pericam” dimmed. On the other hand, “ratiometric-pericam” had an excitation wavelength changing in a Ca2+-dependent manner. All of the pericams expressed in HeLa cells were able to monitor free Ca2+ dynamics, such as Ca2+ oscillations in the cytosol and the nucleus. Ca2+ imaging using high-speed confocal line-scanning microscopy and a flash-pericam allowed to detect the free propagation of Ca2+ ions across the nuclear envelope. Then, free Ca2+ concentrations in the nucleus and mitochondria were simultaneously measured by using ratiometric-pericams having appropriate localization signals, revealing that extra-mitochondrial Ca2+ transients caused rapid changes in the concentration of mitochondrial Ca2+. Finally, a “split-pericam” was made by deleting the linker in the flash-pericam. The Ca2+-dependent interaction between calmodulin and M13 in HeLa cells was monitored by the association of the two halves of GFP, neither of which was fluorescent by itself.
Application of green fluorescent protein (GFP)-based fluorescence resonance energy transfer (FRET) allows to visualize protein heteromerization and conformational changes in single living cells (1). Whereas FRET utilizes two GFP mutants having different colors, we have developed single GFPs sensitive to physiologically relevant substrates (e.g., calcium ions in the present study).
Wild-type GFP (WT-GFP) has a bimodal absorption spectrum with two peak maxima, at 395 and 475 nm, corresponding to the protonated and the deprotonated states of the chromophore, respectively (2). The ionization state is modulated by a proton network, comprising an intricate network of polar interactions between the chromophore and several surrounding amino acids. In contrast to WT-GFP, the chromophore of most GFP variants titrates with single pKa values, indicating that the internal proton equilibrium has been disrupted as a result of an external manipulation (3). One of the variants is the yellow fluorescent protein (YFP). It has a T203Y substitution that is responsible for the red-shift emission at 528 nm (2). It has been predicted that the tyrosine introduced at position 203 would be involved in a π-stacking interaction with the chromophore (4), which has been demonstrated by x-ray crystallography (5).
Within the rigid “β -can” structure (6) of GFP variants, Baird et al. (7) found a site that would tolerate circular permutations where two portions of the polypeptide are flipped around the central site. With obvious clefts in the β-can, the chromophore of the circularly permuted GFPs (cpGFP) seemed to be more accessible to protons outside of the proteins. The use of cpGFP might be interesting for converting the interaction signal between two protein domains into a change in the electrostatic potential of the chromophore; in other words, to transduce the information of the interaction into a fluorescent signal.
Here we used cpYFP that was fused to calmodulin (CaM) and M13, a 26-residue peptide derived from the CaM-binding region of the skeletal muscle myosin light-chain kinase (8). The Ca2+-bound CaM (Ca2+-CaM) and M13 peptide forms a stable and compact complex. The solution structure of the complex has been determined by multidimensional NMR (9). The fluorescence properties of the chimeric protein consisting of M13, cpYFP, and CaM changed according to the Ca2+-dependent interaction between CaM and M13. Furthermore, the behavior of the spectral changes was varied by mutations which could affect the proton network of the cpYFPs. Complex mechanisms of the Ca2+-sensing and availability of the proteins for in vivo Ca2+ imaging will be discussed.
Materials and Methods
Gene Construction.
The cDNA of cpEYFP(V68L/Q69K) was constructed by three separate PCRs. First, the cDNA of the 3′ portion of EYFP(V68L/Q69K) (10) was amplified with a sense primer containing a PstI site, and a reverse primer encoding a peptide linker GGSGG. Second, the cDNA of the 5′ portion of EYFP(V68L/Q69K) was amplified with a sequence encoding the peptide linker GGSGG and a KpnI site to the 5′ and 3′ ends, respectively. Finally, the entire cDNA of cpEYFP(V68L/Q69K) was amplified with the PstI and KpnI sites containing primers by using a mixture of the first and second PCR fragments as the template. The restricted product was cloned in-frame into the PstI/KpnI sites of pRSETB (Invitrogen), yielding cpEYFP(V68L/Q69K)/pRSETB. Then the cDNAs encoding M13 and CaM were amplified by using primers containing 5′ BamHI and 3′ PstI sites, and 5′ KpnI and 3′ EcoRI sites, respectively. The restricted PCR fragments were ligated to the 5′ and 3′ ends of cpEYFP(V68L/Q69K) gene in pRSETB to yield the construct of pericam for bacterial expression. The modification of the linkers and site-directed mutagenesis at 148 and 203 in cpEYFP(V68L/Q69K) were performed as described (11) to create flash-, ratiometric-, and inverse-pericams. The 5′ end of the pericam gene was modified by PCR to have a HindIII site followed by a Kozak consensus sequence (CCACCATG). The HindIII/EcoRI fragment encoding the pericam was subcloned in the mammalian expression vector pcDNA3 (Invitrogen). The cDNAs coding for M13-EYFP(V68L/Q69K)(145–238) and EYFP(V68L/Q69K)(1–144)-CaM were obtained from flash-pericam cDNA and cloned into pcDNA3. Ratiometric-pericam-mt and ratiometric-pericam-nu were obtained by extending the ratiometric-pericam cDNA at the 5′ end with the sequence encoding the N-terminal 12-aa presequence of subunit IV of cytochrome c oxidase (12), and at the 3′ end with the nuclear localization signal PKKKRKVEDA, respectively.
Protein Expression and in Vitro Spectroscopy.
Recombinant fluorescent proteins with polyhistidine tag at N terminus were expressed in Escherichia coli [JM109(DE3)], purified, and spectroscopically characterized as described (13).
pH- and Ca2+-Titrations.
pH titrations were performed by using a series of buffers prepared with pHs ranging from 4 to 12.5 as described (4). Ca2+ titrations were performed by reciprocal dilution of Ca2+-free and Ca2+-saturated buffers prepared by using O,O′bis(2-aminoethyl)ethyleneglycol-N,N,N′,N′tetraacetic acid (EGTA), N-(2-hydroxyethyl)ethylenediamine-N,N′,N′-triacetic acid (EDTA-OH), or nitrilotriacetic acid (NTA).
Mammalian Expression and Imaging.
Two or three days after cDNA transfection with Superfect (Qiagen, Chatsworth, CA), HeLa cells in Hanks' balanced salt solution buffer were imaged at 25°C on an Olympus IX-70 with a MicroMax-1300Y/HS interlined charge-coupled device camera (Roper Scientific, Tucson, AZ) controlled by METAFLUOR/METAMORPH 4.0 software (Universal Imaging, Media, PA). Single-wavelength imaging with flash-pericam, inverse-pericam, and split-pericam used a 475DF35 excitation filter, a 505 DRLP dichroic mirror, and an HQ525/50 emission filter. Dual-excitation imaging with ratiometric-pericam used two excitation filters (480DF10 and 410DF10), which were alternated by a filter changer (Lambda 10–2, Sutter Instruments, Novato, CA), a 505 DRLP-XR dichroic mirror, and a 535DF25 emission filter. Confocal images were carried out by using a Fluoview FV500 confocal laser scanning microscope (Olympus, Tokyo) with an argon-ion laser (Omnichrome; Melles Griot, Irvine, CA).
Results and Discussion
Development of Ca2+-Sensitive Circularly Permuted GFP Variants.
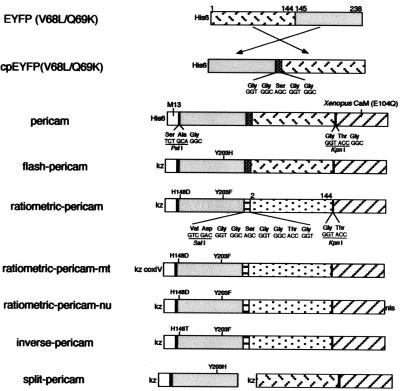
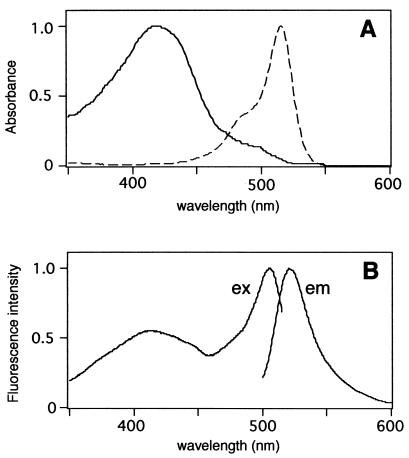
A YFP variant, EYFP(V68L/Q69K) (10) was subjected to circular permutation. The original N and C termini were linked through a pentapeptide linker GGSGG, rendering Y145 and N144 new N and C termini, respectively (Fig. 1). With a hexa-histidine tag (His-6-tag) attached at the N terminus, the circularly permuted YFP [cpEYFP(V68L/Q69K)] was expressed in E. coli and purified by using the His-6-tag. Spectra of purified proteins were all measured at pH 7.4 unless otherwise stated. The absorbance spectrum of cpEYFP(V68L/Q69K) shows a major peak at 420 nm with a small shoulder near 500 nm (Fig. 2A), contrasting with the original EYFP(V68L/Q69K) peaking predominantly at 514 nm (Fig. 2A; ref. 10). This blue-shift suggests that the chromophore was protonated in cpEYFP(V68L/Q69K). The excitation spectrum had two peaks at 417 and 506 nm (Fig. 2B), which was reminiscent of the bimodal excitation spectrum of WT-GFP (2). The protonated species of cpEYFP(V68L/Q69K) absorbing around 420 nm fluoresced, whereas protonated species of most YFPs do not (2).
Figure 1.
Schematic structures and sequences of pericams for expression in bacteria and mammalian cells. Sequences of linkers and amino acid substitutions are shown below and above the bars, respectively. His-6, the polyhistidine tag; kz, Kozak consensus sequence; nls, nuclear localization signal; coxIV, cytochrome c oxidase subunit IV targeting signal (12).
Figure 2.
(A) Absorbance spectra of EYFP(V68L/Q69K) (broken line) and cpEYFP(V68L/Q69K) (solid line). (B) Fluorescence excitation (ex) and emission (em) spectra of cpEYFP(V68L/Q69K), recorded at 530-nm emission and 485-nm excitation, respectively. All spectra were normalized to a maximum value of 1.0.
Our initial attempt was to connect the C terminus of CaM and N terminus of M13 with the N and C termini of cpEYFP(V68L/Q69K), respectively. However, the resulting chimera protein did not show any response to Ca2+ (data not shown). Then, CaM and M13 were interchanged: cpEYFP(V68L/Q69K) was fused to the C terminus of M13 through a tripeptide linker SAG, and through a GTG linker to the N terminus of CaM containing the E104Q mutation of the conserved bidentate glutamate in the third Ca2+ binding loop to glutamine (ref. 13; Fig. 1). Although the N terminus of CaM and the C terminus of M13 are 50 Å apart in their complex (9), the chimeric protein was fluorescent and showed Ca2+ sensitivity. The protein having a circularly permuted YFP and a CaM, was named “pericam.” When excited at 485 nm, the Ca2+-bound pericam showed an emission peak at 520 nm, 3 times brighter than the Ca2+-free pericam (data not shown). On the contrary, neither absorbance nor fluorescence spectrum of cpEYFP(V68L/Q69K) was sensitive to Ca2+ (data not shown).
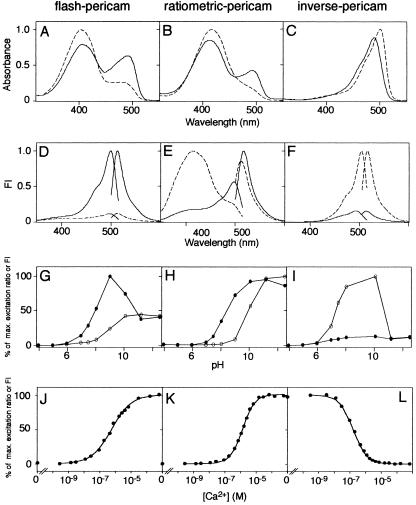
To obtain pericams with a larger dynamic range, several amino acids involved in the proton network were optimized. Substitution of His-203 for Tyr improved the dynamic range significantly. The new pericam, called “flash-pericam” (Fig. 1), exhibited an 8-fold increase in the fluorescence with Ca2+ (Fig. 3D). Together with two mutations that provide a better folding at 37°C (V163A and S175G), flash-pericam was designed to work as a single wavelength indicator of intracellular Ca2+. In the absence of Ca2+, flash-pericam exhibited similar absorbance spectrum to that of cpEYFP(V68L/Q69K) (Fig. 3A, broken line). On saturation with Ca2+, the 490-nm absorbance peak increased at the expense of the 400-nm peak (Fig. 3A, solid line), indicating that association of the Ca2+-CaM with M13 peptide caused ionization of the chromophore, which resulted in a leftward shift of the pH titration curve (Fig. 3G). It should be noted that when the pH was high enough to ionize the chromophore, the Ca2+-bound flash-pericam (at pH = 9) was about twice as bright as the Ca2+-free flash-pericam (at pH > 10). Besides the pH-titrability, therefore, the interaction between CaM and M13 might have direct steric effects on the chromophore, and change its ionization state or reduce its out-of-plane distortions that could result in enhanced radiationless decay. The latter possibility is likely, because Ca2+ binding to flash-pericam increased the quantum yield by several times as well as the molar extinction coefficient around 490 nm (Table 1). The pH titration curve in Fig. 3G also shows that the Ca2+-bound flash-pericam was alkaline-quenched (pH > 10), suggesting the collapse of such an incomplete β-can structure.
Figure 3.
In vitro properties of flash-pericam (A, D, G, and J), ratiometric-pericam (B, E, H, and K), and inverse-pericam (C, F, I, and L). Absorbance (A–C) and fluorescence excitation and emission (D–F) spectra of pericams. pH-dependency of normalized amplitudes in 514-nm emission peak (G), 516-nm emission peak (I), and excitation ratio of 495/410 (H). (A–I) The spectra and data points were obtained in the presence (solid line) and absence (broken line) of Ca2+ ion. (J–L) Ca2+ titration curves of pericams. FI, fluorescence intensity.
Table 1.
Spectral characterizations of flash-pericam, inverse-pericam, and ratiometric-pericam
| Name | Critical mutation* | Ca2+ | λabs (ɛ)†‡ | λem (Φ)‡§ | Kd for Ca2+ (n)‡¶ |
|---|---|---|---|---|---|
| Flash-pericam | T203H | − | 403 (26.8) | 514 (0.04) | 0.7 μM (0.7) |
| 488 (6.3) | |||||
| + | 410 (21.2) | 514 (0.20) | |||
| 494 (16.9) | |||||
| Ratiometric-pericam | H148D, T203F | − | 418 (24.1) | 511 (0.30) | 1.7 μM∥ (1.1) |
| 494 (4.1) | |||||
| + | 415 (20.5) | 517 (0.18) | |||
| 494 (10.3) | |||||
| Inverse-pericam | H148T, T203F | − | 503 (59.0) | 515 (0.64) | 0.2 μM (1.0) |
| + | 490 (44.0) | 513 (0.44) |
Substitutions from the primary sequence of EYFP(V68L/Q69K) are given as the single-letter code for the amino acid being replaced, its numerical position in the sequence, and the single-letter code for the replacement.
† λabs is the peaks of the absorbance spectrum in units of nanometers. ɛ in parentheses is the absorbance extinction coefficient in units of 103 M−1·cm−1.
‡ These properties were measured in 50 mM Hepes-KOH, pH 7.4.
§ λem is the peak of emission spectrum in units of nanometers. Φ in parentheses is the fluorescence quantum yield.
¶ Kd values for Ca2+ were measured from the fitted curves in Fig. 3. n in parentheses is the Hill coefficient.
∥ This value indicates
K (apparent
Kd).
Most YFPs have a tyrosine or a histidine at position 203 and contain nonfluorescent protonated species absorbing at around 400 nm (2). Also, fluorescence was hardly detectable when flash-pericam was excited at around 400 nm. On the other hand, phenylalanine at position 203 in YFP was shown to make the protonated species fluorescent. For example, excitation of YFP with Phe-203 at 400 nm gave rise to a predominant emission peak at 455 mm (14). Aiming for a dual-excitation ratiometric Ca2+ indicator, we introduced Phe-203 in flash-pericam. Again, the linkers and several amino acids proved critical to the optimization of protein folding and the Ca2+ sensitivity. After numerous constructs had been tested, “ratiometric-pericam” was derived from flash-pericam by introducing H203F, H148D, and F46L, deleting a glycine before CaM, and replacing the GGSGG linker with VDGGSGGTG, between the original N and C termini (Fig. 1). As was seen in flash-pericam, Ca2+ binding promoted ionization of the chromophore in ratiometric-pericam. Therefore, it exhibited a Ca2+-dependent change in the absorbance spectrum similar to flash-pericam (Fig. 3B), and the pH-titration curve was shifted leftwards with Ca2+ (Fig. 3H). In contrast to flash-pericam, however, ratiometric-pericam had a bimodal excitation spectrum peaking at 415 and 494 nm (Fig. 3E), and the relative intensities of green fluorescence (511 ≈ 517 nm) emitted when excited with 494 and 415 nm light was changed by about 10-fold between Ca2+-saturated and Ca2+-free forms (Fig. 3E). The excitation ratio (494/415) showed a monophasic Ca2+-dependency with an apparent dissociation constant (Kd) of 1.7 μM and a Hill constant of 1.1 (Fig. 3K).
During the semirandom mutagenesis on ratiometric-pericam, we found an interesting protein that had a substitution D148T (Fig. 1). In contrast to flash-pericam, the green fluorescence (513 ≈ 515 nm) emitted when excited at 500 nm decreased to 15% with Ca2+ (Fig. 3F). Thus, the protein has been named “inverse-pericam.” The binding of Ca2+ to inverse-pericam may have promoted the protonation of the chromophore. However, the following results indicate this was not the case. At pH 7.4, Ca2+ ion only blue-shifted the peak of absorbance spectrum from 503 to 490 nm, with a tiny hump around 400 nm unaltered (Fig. 3C); the Ca2+ binding did not affect the protonation state of the chromophore. Also, both the Ca2+-bound and Ca2+-free inverse-pericams were pH-titrated in a similar way; however, in the ionized states (pH > 8) the Ca2+-free protein was 7-fold brighter than the Ca2+-bound form (Fig. 3I). In fact, the quantum yield was decreased by 30% with Ca2+ binding (Table 1). These results suggest that the change in fluorescence intensity would be explained mostly by direct effects of the Ca2+-related structural change on the chromophore.
[Ca2+]i Imaging in HeLa Cells Expressing Pericams.
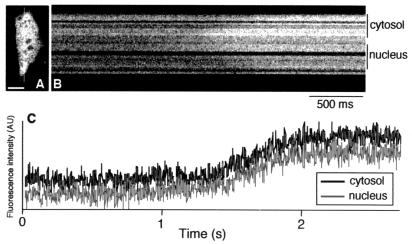
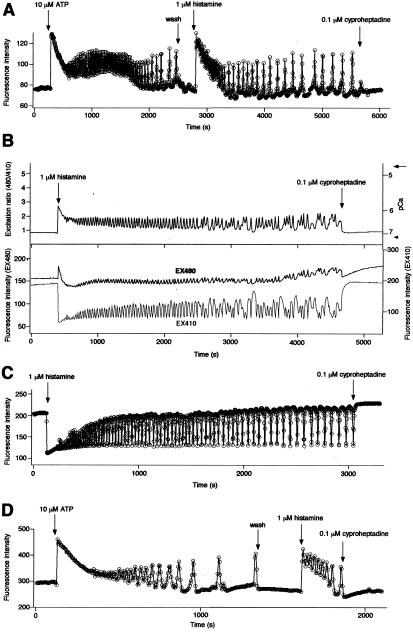
When each pericam was transfected into HeLa cells, the fluorescence was uniformly distributed throughout the cytosolic and nuclear compartments, but excluded from the nucleoli, as expected for a 44-kDa protein that can pass through the nuclear pores (e.g., see Fig. 4A). Thus, the pericams can report intracellular free Ca2+ concentrations ([Ca2+]is). Fig. 5 A, B, and C show receptor-stimulated [Ca2+]i oscillations in single HeLa cells expressing flash-pericam, ratiometric-pericam, and inverse-pericam, respectively. In each case, the response began with a large spike, became sinusoidal, then converted into transient spikes and gradually declining frequency.
Figure 4.
(A) A confocal image of a HeLa cell expressing flash-pericam. (B) A line-scanned image along a longitudinal line in A of the histamine-evoked Ca2+ propagation. (C) The time course of Ca2+ signals in the cytosol and nucleus; their areas are indicated on the right side of B. (Scale bar = 10 μm.)
Figure 5.
Typical [Ca2+]i transients and oscillations induced by receptor-stimulations in HeLa cells expressing flash-pericam (A), ratiometric-pericam (B), inverse-pericam (C), and split-pericam (D). The sampling interval was 3 ≈ 5 s. (B, Upper) Excitation ratios, 480 to 410 nm. The right-hand ordinate calibrates [Ca2+]i in pCa with Rmax and Rmin indicated by an arrow and arrowhead, respectively. (Lower) 480 nm (black line, left-hand scale) and 410 nm (gray line, right-hand scale) excitations.
Compared with the single-wavelength indicators (flash-pericam and inverse-pericam), ratiometric-pericam permits quantitative Ca2+ imaging that can cancel out artifacts caused by indicator concentration and cell thickness or movement. In the presence of Ca2+ ionophore, the application of a high concentration (5 mM) of extracellular Ca2+, then 1,2-bis(2-aminophenoxy)ethane-N,N,N′,N′-tetraacetate (BAPTA-AM) and O,O′bis(2-aminoethyl)ethyleneglycol-N,N,N′,N′tetraacetic acid (EGTA), gave the maximum and minimum ratios (Rmax and Rmin, respectively) for an in situ calibration (Fig. 5B, Upper). Whereas the amplitude of the first spike was about 3 μM, that of the subsequent spikes was below 1 μM. The relatively weak Ca2+ affinity allows for a more precise quantification of spike amplitudes than fura-2, the popular dual-excitation ratiometric Ca2+ indicator.
The time course of inverse-pericam (Fig. 5C) seems to be a symmetric image of the flash-pericam (Fig. 5A). However, inverse-pericam indicated relatively more sustained [Ca2+]i increases (Fig. 5C). This is consistent with the finding that inverse-pericam had a higher affinity for Ca2+ than did flash-pericam; their Kd values were 0.2 and 0.7 μM, respectively (Fig. 3 J and L and Table 1). One advantageous feature of inverse-pericam is that its Ca2+-free form has a high molar extinction coefficient and quantum yield at pH 7.4 (Table 1), which are almost comparable to those of enhanced GFP (2). Thus, despite the unusual characteristics of dimming with Ca2+, the use of inverse-pericam permits Ca2+ imaging with a satisfactory signal-to-noise ratio.
In the course of the improvement of pericams, folding efficiency at 37°C in mammalian cells was also an important factor. Inverse-pericam and ratiometric-pericam can be efficiently folded independently of temperature, whereas flash-pericam is better produced at 28–30°C.
Monitoring Protein Heterodimerization.
An intriguing question is whether the circularly permuted GFP variants can detect intermolecular associations. To address this, we split flash-pericam at the linker between the original N and C termini of EYFP(V68L/Q69K) (Fig. 1). The two proteins (“split-pericam”) were coexpressed in HeLa cells. Although the chromophore of GFP is made of the tripeptide 65–67, its formation requires the entire β-can structure (2). It was not clear, therefore, how efficiently the two peptide chains associated at the basal level of [Ca2+]i, and how much the mature chromophore was formed. Despite such uncertainty, split-pericam was able to monitor the reversible association between CaM and M13 peptide. The temporal profile almost reflected [Ca2+]i oscillations caused by ATP or histamine (Fig. 5D). However, split-pericam could not be used as a reliable Ca2+ indicator: CaM and M13 peptide being separate, they are fully subject to crossreaction with unlabeled CaM and CaM-binding proteins in cells. Our in vitro studies have revealed that the fused CaM and M13 in flash-pericam preferentially interact with each other (data not shown).
Permeability of the Nuclear Envelope to Ca2+ Ion.
It has been controversial whether nuclear free Ca2+ concentration ([Ca2+]n) is regulated independently of cytosolic free Ca2+ concentration ([Ca2+]c) (15). Comparative measurements of [Ca2+]n and [Ca2+]c have been carried out by using synthetic fluorescent chelators. However, the cytosolic signal is often contaminated by signals from intracellular organelles, such as endoplasmic reticulum, in which the chelators can be compartmentalized (16). The Ca2+-sensitive photoprotein aequorin has been localized specifically in nucleus and cytosol (17, 18), but it has proven difficult to image [Ca2+]n and [Ca2+]c in individual cells. To examine the propagation of Ca2+ waves, we transfected HeLa cells with flash-pericam cDNA and observed the signals by using high-speed confocal line-scanning microscopy equipped with an argon-ion laser. Fig. 4A shows an optically sectioned image of a cell expressing flash-pericam, which was always distributed throughout the cytosol and nucleus at the same protein concentration as mentioned above. Thus, the simple use of flash-pericam allowed us to compare the two Ca2+ concentrations without concern on the difference in Ca2+ buffering. A typical pattern of the Ca2+ propagation stimulated by histamine and detected by line-scanning is shown in Fig. 4B. The Ca2+ wave traveled along the line indicated in Fig. 4A. Fig. 4C gives the time course measurement of [Ca2+]n and [Ca2+]c after bath-application of 1 μM histamine. No obvious difference in temporal profiles between [Ca2+]n and [Ca2+]c was evident; similar results were obtained from the experiments using video-rate scanning two-photon excitation fluorescence microscopy (19) and fluorescent Ca2+ indicator proteins, cameleons (13).
Free Ca2+ Dynamics in Mitochondria.
Mitochondria are active participants in cellular Ca2+ signaling; they sequester Ca2+ from cytosolic microdomains of high Ca2+ concentration generated by the entry or release of Ca2+ from intracellular stores. Although it is interesting to know how the [Ca2+]c increases are relayed into mitochondria, only few studies have succeeded in simultaneous measurements of [Ca2+]c and [Ca2+]m (free Ca2+ concentration in mitochondria) in single intact cells (20). Synthetic fluorescent chelators are difficult to be differentially targeted. Thus, the measurements have used patch clamp procedures; for example, after accumulation of the permeant cation rhod-2 acetoxymethyl ester in mitochondria, other Ca2+ dyes conjugated with dextran were loaded by whole cell dialysis (21), where the mitochondria were not bathed in the natural cytoplasm. On the other hand, aequorin is easily targeted (22) but requires the incorporation of coelenterazine, is irreversibly consumed by Ca2+, and is difficult to image because its luminescence produces less than one photon per molecule.
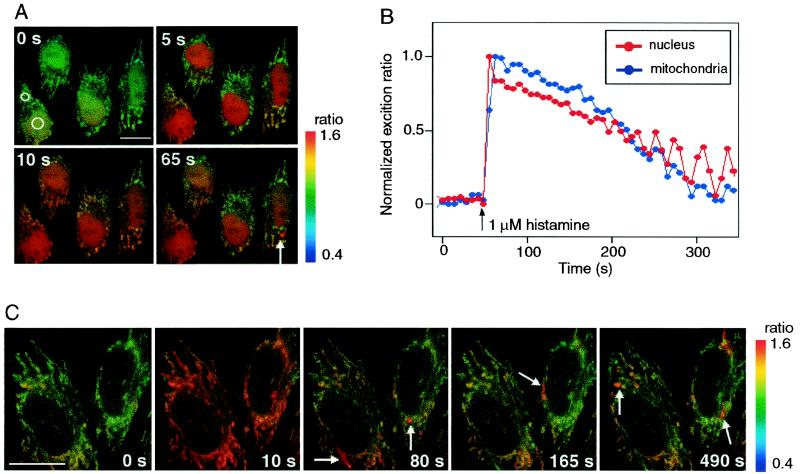
We measured [Ca2+]m and [Ca2+]n by using ratiometric-pericams targeted to mitochondria and nucleus, respectively, in HeLa cells. Based on our finding that Ca2+ signals passed freely from the cytosol to nucleus in HeLa cells, we measured [Ca2+]n as the extramitochondrial Ca2+ signal. This allows for simultaneous observations of intra- and extramitochondrial Ca2+ signals to be performed, which were well separated spatially. Fig. 6A shows four snapshots of a HeLa cell 0, 5, 10, and 65 s after perfusion with 1 μM histamine. The excitation ratios (480/410) measured in the two spots indicated in the 0 s image are overlaid (Fig. 6B). A sustained increase in [Ca2+]n was evoked, which was accompanied by a transient and synchronized increase in [Ca2+]m. However, the peak of [Ca2+]m lagged behind [Ca2+]n by 5 to 10 s, as reported in ref. 20. Although previous studies that compared [Ca2+]m and [Ca2+]n in whole cell patch mode reported delayed decrease in [Ca2+]m, the recovery of [Ca2+]m was rather fast in our experiments, consistent with the results of another experiment using intact cells (20). It is therefore possible that the Ca2+ extrusion from mitochondria might be regulated by cytosolic factors that were lost in the whole cell dialysis. Fig. 6A also shows that during the falling phase, some mitochondria transiently took up more Ca2+ than others as indicated by an arrow in the 65 s image. The local increases in [Ca2+]m were reproducibly observed. In two HeLa cells with only mitochondrially targeted ratiometric-pericam (Fig. 6C), the single mitochondria showing high [Ca2+]m were clearly imaged (indicated by arrows). Each of the [Ca2+]m rises appeared to last for about 10 s. Such different behaviors of mitochondrial populations in individual cells were revealed by a subcellular imaging of [Ca2+]m using aequorin (23).
Figure 6.
(A) A series of pseudocolored images of four HeLa cells that expressed ratiometric-pericam-nu and -mt. From the Left Upper to the Right Lower, 0, 5, 10, and 65 s after 1 μM histamine application. Small and a large circles in the leftmost cell are regions of interest for measurements of [Ca2+]n and [Ca2+]m, respectively. Their time courses are shown in B. (C) A series of pseudocolored images of two HeLa cells expressing ratiometric-pericam-mt. Arrows indicate subpopulations of mitochondria transiently exhibiting high [Ca2+]m. (Scale bar = 10 μm.)
Pericams Versus Other Genetically Encodable Ca2+ Indicators.
Two genetically encodable fluorescent Ca2+ indicators have been reported: cameleon (13) and camgaroo (7). Cameleon is a dual-emission ratiometric Ca2+ indicator that employs FRET with 2 GFP mutants of different color. Compared with cameleon, ratiometric-pericam shows greater responses to Ca2+. The 10-fold ratio of Rmax to Rmin of ratiometric-pericam inside HeLa cells (Fig. 5B), which is consistent with the excitation ratio (494/415) change obtained in vitro (Fig. 3E), is much greater than the 2-fold ratio of Rmax/Rmin of the improved yellow cameleon (10). Ratiometric-pericam also guarantees a sufficient signal-to-noise ratio, because it shows relatively high absorbance extinction coefficient and quantum yield, and efficient folding ability at 37°C. We previously failed somehow to target cameleon into mitochondrial matrix; in the present study, mitochondrially targeted ratiometric-pericam allowed us to monitor [Ca2+]m in single mitochondria.
Camgaroo is a Ca2+-sensitive EYFP that has an insertion of calmodulin at a central site, and becomes 7-fold brighter on saturation with Ca2+ like flash-pericam. However, because of its low affinity (Kd = 7 μM) for Ca2+, camgaroo cannot detect well the histamine-induced [Ca2+]i spikes of up to 2–3 μM. By contrast, flash-pericam has a reasonably high affinity (Kd = 0.7 μM) for Ca2+, thereby capable of sensing physiological changes in [Ca2+]i.
Here we demonstrate that it is possible to change dramatically the Ca2+-dependent behavior of pericam just by introducing subtle mutations in the amino acids close to the chromophore. Although in most cases pericam was randomly mutated, there were some rational mutations. One example was the substitution of phenylalanine for tyrosine at residue 203 (Y203F), for creating ratiometric-pericam. Crystallographic studies on the three pericams would give us more information for designing pericams with different behaviors or other cpGFP-based biosensors. Through more profound understanding on the proton network of GFP, cpGFPs should potentially become powerful tools, complementing the FRET technology.
Acknowledgments
We are grateful to G. S. Baird and R. Y. Tsien for fruitful discussions and critical comments on the manuscript, H. Mizuno and H. Hama for helpful advice, and C. Hara for technical assistance. This work was supported by grants from CREST (Core Research for Evolutional Science and Technology) of Japan Science and Technology (to A.M.), the Japanese Ministry of Education, Culture, Sports, Science, and Technology (to A.M.), Special Postdoctoral Researcher Program of The Institute of Physical and Chemical Research (Japan) (to T.N.), and President's Special Research Grant of The Institute of Physical and Chemical Research (Japan) (to T.N.).
Abbreviations
- GFP
green fluorescent protein
- cpGFP
circularly permuted GFP
- WT-GFP
wild-type GFP
- FRET
fluorescence resonance energy transfer
- YFP
yellow fluorescent protein
- CaM
calmodulin
References
- 1.Tsien R Y, Miyawaki A. Science. 1998;280:1954–1955. doi: 10.1126/science.280.5371.1954. [DOI] [PubMed] [Google Scholar]
- 2.Tsien R Y. Annu Rev Biochem. 1998;67:509–544. doi: 10.1146/annurev.biochem.67.1.509. [DOI] [PubMed] [Google Scholar]
- 3.Llopis J, McCaffery J M, Miyawaki A, Farquhar M G, Tsien R Y. Proc Natl Acad Sci USA. 1998;95:6803–6808. doi: 10.1073/pnas.95.12.6803. [DOI] [PMC free article] [PubMed] [Google Scholar]
- 4.Ormö M, Cubitt A B, Kallio K, Gross L A, Tsien R Y, Remington S J. Science. 1996;273:1392–1395. doi: 10.1126/science.273.5280.1392. [DOI] [PubMed] [Google Scholar]
- 5.Wachter R M, Elsliger M A, Kallio K, Hanson G T, Remington S J. Structure (London) 1998;6:1267–1277. doi: 10.1016/s0969-2126(98)00127-0. [DOI] [PubMed] [Google Scholar]
- 6.Yang F, Moss L G, Phillips G N., Jr Nat Biotechnol. 1996;14:1246–1251. doi: 10.1038/nbt1096-1246. [DOI] [PubMed] [Google Scholar]
- 7.Baird G S, Zacharias D A, Tsien R Y. Proc Natl Acad Sci USA. 1999;96:11241–11246. doi: 10.1073/pnas.96.20.11241. [DOI] [PMC free article] [PubMed] [Google Scholar]
- 8.Blumenthal D K, Krebs E G. Methods Enzymol. 1987;139:115–126. doi: 10.1016/0076-6879(87)39079-2. [DOI] [PubMed] [Google Scholar]
- 9.Ikura M, Clore G M, Gronenborn A M, Zhu G, Klee C B, Bax A. Science. 1992;256:632–638. doi: 10.1126/science.1585175. [DOI] [PubMed] [Google Scholar]
- 10.Miyawaki A, Griesbeck O, Heim R, Tsien R Y. Proc Natl Acad Sci USA. 1999;96:2135–2140. doi: 10.1073/pnas.96.5.2135. [DOI] [PMC free article] [PubMed] [Google Scholar]
- 11.Sawano A, Miyawaki A. Nucleic Acids Res. 2000;28:E78. doi: 10.1093/nar/28.16.e78. [DOI] [PMC free article] [PubMed] [Google Scholar]
- 12.Rizzuto R, Simpson A W, Brini M, Pozzan T. Nature (London) 1992;358:325–327. doi: 10.1038/358325a0. [DOI] [PubMed] [Google Scholar]
- 13.Miyawaki A, Llopis J, Heim R, McCaffery J M, Adams J A, Ikura M, Tsien R Y. Nature (London) 1997;388:882–887. doi: 10.1038/42264. [DOI] [PubMed] [Google Scholar]
- 14.Dickson R M, Cubitt A B, Tsien R Y, Moerner W E. Nature (London) 1997;388:355–358. doi: 10.1038/41048. [DOI] [PubMed] [Google Scholar]
- 15.Malviya A N, Rogue P J. Cell. 1998;92:17–23. doi: 10.1016/s0092-8674(00)80895-8. [DOI] [PubMed] [Google Scholar]
- 16.Brown G R, Kohler M, Berggren P O. Biochem J. 1997;325:771–778. doi: 10.1042/bj3250771. [DOI] [PMC free article] [PubMed] [Google Scholar]
- 17.Badminton M N, Campbell A K, Rembold C M. J Biol Chem. 1996;271:31210–31214. doi: 10.1074/jbc.271.49.31210. [DOI] [PubMed] [Google Scholar]
- 18.Brini M, Murgia M, Pasti L, Picard D, Pozzan T, Rizzuto R. EMBO J. 1993;12:4813–4819. doi: 10.1002/j.1460-2075.1993.tb06170.x. [DOI] [PMC free article] [PubMed] [Google Scholar]
- 19.Fan G Y, Fujisaki H, Miyawaki A, Tsay R K, Tsien R Y, Ellisman M H. Biophys J. 1999;76:2412–2420. doi: 10.1016/S0006-3495(99)77396-0. [DOI] [PMC free article] [PubMed] [Google Scholar]
- 20.Ricken S, Leipziger J, Greger R, Nitschke R. J Biol Chem. 1998;273:34961–34969. doi: 10.1074/jbc.273.52.34961. [DOI] [PubMed] [Google Scholar]
- 21.Babcock D, Herrington J, Goodwin P C, Park Y B, Hille B. J Cell Biol. 1997;136:833–844. doi: 10.1083/jcb.136.4.833. [DOI] [PMC free article] [PubMed] [Google Scholar]
- 22.Rutter G A, Burnett P, Rizzuto R, Brini M, Murgia M, Pozzan T, Tavare J M, Denton R M. Proc Natl Acad Sci USA. 1996;93:5489–5494. doi: 10.1073/pnas.93.11.5489. [DOI] [PMC free article] [PubMed] [Google Scholar]
- 23.Montero M, Alonso M T, Carnicero E, Cuchillo-Ibanez I, Albillos A, Garcia A G, Garcia-Sancho J, Alvarez J. Nat Cell Biol. 2000;2:57–61. doi: 10.1038/35000001. [DOI] [PubMed] [Google Scholar]


