

Abstract
Although blindness alters neocortical processing of non-visual tasks, previous studies do not allow clear conclusions about purely perceptual tasks. We used functional magnetic resonance imaging (fMRI) to examine the neural processing underlying tactile microspatial discrimination in the blind. Activity during the tactile microspatial task was contrasted against that during a tactile temporal discrimination task. The spatially-selective network included frontoparietal and visual cortical regions. Activation magnitudes in left primary somatosensory cortex and in visual cortical foci predicted acuity thresholds. Effective connectivity was investigated using multivariate Granger causality analyses. Bilateral primary somatosensory cortical foci and a left inferior temporal focus were important sources of connections. Visual cortical regions interacted mainly with one another and with somatosensory cortical regions. Among a set of distributed cortical regions exhibiting greater spatial selectivity in early blind compared to late blind individuals, the age of complete blindness was predicted by activity in a subset of frontoparietal regions, and by the weight of a path from the right lateral occipital complex to right occipitopolar cortex. Thus, many aspects of neural processing during tactile microspatial discrimination differ between the blind and sighted, with some of the key differences reflecting visual cortical engagement in the blind.
Keywords: Visual cortex, spatial cognition, plasticity, somatosensory, tactile spatial acuity, connectivity analysis
INTRODUCTION
A substantial body of work indicates that the neocortical processing underlying many non-visual tasks is altered by blindness. With respect to tactile inputs, such plasticity has been found in both somatosensory and visual cortex. Rodents deprived of vision at birth show altered somatosensory representations in the whisker barrel representation in somatosensory cortex (Rauschecker, Tian, Korte & Egert, 1992; Toldi, Farkas & Völgyi, 1994). Blind Braille readers demonstrate an expanded cortical sensory representation of the Braille-reading finger (Pascual-Leone & Torres, 1993), and blind subjects who use multiple fingers in concert to read Braille demonstrate disordered cortical somatotopy (Sterr, Müller, Elbert, Rockstroh, Pantev & Taub, 1998). Neonatal visual deprivation in rodents (Toldi, Rojik & Feher, 1994) and monkeys (Hyvärinen, Carlson & Hyvärinen, 1981) also results in the appearance of somatosensory responsiveness in occipital cortex, and occipital cortical areas are more metabolically active in early blind individuals than in the late blind or sighted (Veraart, De Volder, Wanet-Defalque, Bol, Michel & Goffinet, 1990).
The medial occipital cortex of blind subjects is active during Braille reading (Sadato, Pascual-Leone, Grafman, Ibanez, Deiber, Dold & Hallett, 1996). This activation occurs in early blind subjects (Cohen, Weeks, Sadato, Celnik, Ishii & Hallett, 1999; Sadato, Okada, Honda & Yonekura, 2002), whereas the late blind and sighted deactivate these regions (Sadato et al., 2002). Moreover, transcranial magnetic stimulation (TMS) over medial occipital cortex impaired the ability of early blind subjects to identify Braille or Roman characters (Cohen, Celnik, Pascual-Leone, Corwell, Faiz, Dambrosia, Honda, Sadato, Gerloff, Catala & Hallett, 1997), and infarction of bilateral occipital cortex caused alexia for Braille in an early blind person (Hamilton, Keenan, Catala & Pascual-Leone, 2000), suggesting that visual cortex is functionally involved in Braille reading in the early blind. However, it remained unclear whether the visual cortical activity associated with Braille reading depends on sensory or cognitive (including language-related) processes, since the aforementioned imaging studies employed rest-state controls. In a study of Braille reading that controlled for linguistic processes using an auditory word control, only the late blind recruited activity in early visual cortex, whereas the early blind did not (Büchel, Price, Frackowiak & Friston, 1998), suggesting that early visual cortical recruitment might actually arise from linguistic processing in the early blind. A number of subsequent studies lent strong support to this idea (Amedi, Floel, Knecht, Zohary & Cohen, 2004; Büchel, Price & Friston, 1998; Burton, Diamond & McDermott, 2003; Burton & McLaren, 2006; Burton, McLaren & Sinclair, 2006; Burton, Snyder, Conturo, Akbudak, Ollinger & Raichle, 2002; Burton, Snyder, Diamond & Raichle, 2002; Röder, Stock, Bien & Rösler, 2002).
While it is clear that visual cortex is involved in language processing in the blind, the nature of its involvement in somatosensory processes is much less certain. Investigations focussing on tactile perception (Burton, Sinclair & McLaren, 2004; Goyal, Hansen & Blakemore, 2006; Pietrini, Furey, Ricciardi, Gobbini, Wu, Cohen, Guazzelli & Haxby, 2004; Ptito, Moesgard, Gjedde & Kupers, 2005; Ricciardi, Vanello, Sani, Gentili, Scilingo, Landini, Guazzelli, Bicchi, Haxby & Pietrini, 2007; Sadato et al., 2002; Sadato, Okada, Kubota & Yonekura, 2004; Sadato, Pascual-Leone, Grafman, Deiber, Ibanez & Hallett, 1998; Sadato et al. 1996) were limited by the use of rest controls, so that it is impossible to know whether the observed visual cortical activations were due to sensory, linguistic or other cognitive processes. A recent study (Ptito, Fumal, Martens de Noordhout, Schoenen, Gjedde & Kupers, 2008) reported induction of tactile paresthesias in some early blind subjects during TMS over occipital cortex, but the significance of this finding for functional tactile perception is unclear. The aim of the present functional magnetic resonance imaging (fMRI) study was to investigate the neural processing underlying tactile microspatial discrimination in blind individuals. We were specifically interested in determining whether the relevant sensory processing, independent of linguistic or other cognitive factors, evoked activity in visual cortical areas, and whether this differed as a function of the age at which subjects became blind. To this end, activity during the tactile microspatial task was contrasted against that in a control condition requiring tactile temporal discrimination. We have previously employed this contrast to isolate activity specific for tactile microspatial discrimination in normally sighted subjects (Stilla, Deshpande, LaConte, Hu & Sathian, 2007). We also explored the effect of the age of blindness, and whether there were particular cortical regions whose magnitude of activation in individual subjects predicted individual tactile spatial acuity. Finally, we also studied effective connectivity during tactile microspatial discrimination in the blind.
METHODS
Subjects
Ten blind subjects participated in this study. Table 1 outlines the subject demographics and clinical histories. Five blind subjects were classed as early blind (EB); the other five were classed as late blind (LB). Two had minimal light perception: EB2 could perceive shadows and movement in the left eye and EB3 could perceive a very bright flash. None of the others had any light perception, and none had form perception, at the time of testing. The EB group comprised individuals blind from birth or who became totally blind by 3 years of age. The LB group consisted of people who became completely blind by age 10 or later. Most had some prior visual impairment in childhood: from birth in LB4 and LB5, and from age 7 in LB1 and LB3. Apart from visual impairments, all subjects were neurologically intact and free from calluses or injuries to the hands. All subjects in the EB group were right-handed according to the high validity subset of the Edinburgh handedness inventory (Raczkowski, Kalat & Nebes, 1974), while the handedness of the LB group varied. All but one blind subject (LB4) read Braille; the preferred Braille-reading hand varied, with some subjects using both hands. The study was approved by the Institutional Review Board of Emory University. Written informed consent was obtained from all the subjects, who either read a Braille version of the consent form or had it read aloud to them.
Table 1.
Demographics, clinical details and acuity thresholds of all subjects.
| Acuity threshold (mm) | ||||||||
|---|---|---|---|---|---|---|---|---|
| Subject | Age | Sex | Cause of blindness | Age at time of total blindness (yrs) | Dominant hand | Braille-reading hand | R | L |
| EARLY BLIND | ||||||||
| EB1 | 21 | M | optic nerve hypoplasia | Birth | R | L | 1.75 | 1.19 |
| EB2 | 30 | F | retinopathy of prematurity | 1.5 | R | R | 1.37 | 1.94 |
| EB3 | 56 | F | retinopathy of prematurity | Birth | R | L | 1.64 | 1.29 |
| EB4 | 21 | M | retinoblastoma | 1.5 | R | L | 1.19 | 0.45 |
| EB5 | 46 | F | retinopathy of prematurity | 3 | R | Both | 1.49 | 1.10 |
| Mean | 35 | 1.49 | 1.19 | |||||
| LATE BLIND | ||||||||
| LB1 | 54 | F | inverse retinitis pigmentosa | 44 | R | L | 1.94 | 0.53 |
| LB2 | 40 | M | retinal detachment | 34 | L | L | 1.60 | 1.87 |
| LB3 | 34 | M | Coates’ disease | 10 | R | R | 1.19 | 0.80 |
| LB4 | 43 | M | retinopathy of prematurity, glaucoma | R: 30; L: 40 | Ambidextrous | - | 1.30 | 1.12 |
| LB5 | 43 | M | retinopathy of prematurity, glaucoma | 15 | L | Both | 0.56 | 0.45 |
| Mean | 43 | 1.32 | 0.95 | |||||
Tactile stimulation
The tactile stimulator and tasks used have been described previously in detail (Stilla et al., 2007). A pneumatically driven, MRI-compatible stimulator (Figure 1A) presented stimuli to the index fingerpad, with the long axis of the array aligned along the finger. The finger was immobilized in the supine position (palmar side up) in a finger mold mounted on the base of the stimulator, using thick, double-sided adhesive tape which also served as padding for comfort. Compressed air directed through jets caused the stimulus plate to indent the fingerpad normally. The stimulation was computer-controlled using the Presentation software package (Neurobehavioral Systems, Inc., Albany, California). Contact force was held approximately constant at ~0.6 N. The tactile stimuli were plastic dot patterns raised 0.64 mm in relief from a square base-plate of 20 mm side. The prototypical stimulus was a linear array of three dots (0.3 mm diameter, 2 mm center-to-center spacing) centered on the base-plate. In the microspatial task, the central dot was offset to the left or right (Figure 1B) by a variable distance, ranging from 0.03–1.94 mm. The stimulus was applied to the fingerpad for 1 s duration, and subjects were asked to determine whether the central dot was offset to the left or right. The temporal task used an array without an offset of the central dot (Figure 1C), and stimulus duration was varied from 0.7–1.3 s (mean 1 s). Subjects indicated whether the contact duration was long or short.
Figure 1.

A. MRI-compatible pneumatic stimulator. Stimuli were mounted face-down on the square base-plate at the bottom of the drive shaft. The finger mold used to immobilize the finger was mounted on the base of the device. Arrows indicate direction of airflow. B: Stimulus configurations in spatial task; central dot in array was offset either to the right or left. C: Stimulus array for the temporal task used an array without spatial offset. (Reproduced, with permission, from Stilla et al., 2007).
Pre-scanning psychophysical testing
As detailed previously (Stilla et al., 2007), each subject took part in a pre-scanning session to psychophysically determine acuity thresholds on each hand. Acuity thresholds were expressed in terms of the offset corresponding to 75% correct spatial discrimination, determined by linear interpolation between the two values immediately spanning 75% correct. For subsequent scanning with each subject, the offset value closest to that yielding 90% correct accuracy for that subject was chosen, with the objective of achieving performance during scanning that was above threshold but below ceiling. Similarly, testing was conducted to select a duration-pair that yielded ~90% correct accuracy for use in subsequent scanning.
Functional imaging
As described previously (Stilla et al., 2007), subjects lay supine in the scanner with the arm to be stimulated extended and supinated. The arm was comfortably supported by foam padding, which also minimized transfer of vibration. The immobilized index finger was positioned appropriately relative to the pneumatic stimulator, which was stabilized at the scanner aperture by a vacuum bean bag. Foam blocks, as well as chin and forehead straps, were used to reduce head movement. Headphones conveyed audio cues and protected subjects’ hearing.
Subjects took part in two separate scanning sessions, one for each hand. A block design paradigm was utilized. Each functional run contained twelve stimulation blocks of 24-s duration: six blocks of the microspatial condition and six of the temporal condition, presented in a pseudo-random order. Each stimulation block contained eight, 3-s trials. Thus, there were 48 trials of each condition per run. Each run began and ended with an 18-s baseline period; baseline intervals of 18 s also separated stimulation blocks. Immediately preceding each stimulation block, subjects heard the cues “offset” or “duration” to instruct them which task would follow. Baseline periods were preceded by the cue “rest”. One subject in each group (EB1 and LB5) completed 2 runs per scan session, while the remaining subjects completed 4 runs per scan session. Subjects held a two-button fiberoptic response box in the non-stimulated hand, and used the second or third digit to respond “right” or “left” during the microspatial task, or “long” or “short” during the temporal task. Stimulus presentation was controlled, and responses recorded, using Presentation software.
MR scans were performed on a 3 Tesla Siemens Tim Trio whole body scanner (Siemens Medical Solutions, Malvern, PA), using a standard quadrature headcoil. T2*-weighted functional images were acquired using a single-shot gradient-recalled echoplanar imaging (EPI) sequence optimized for blood oxygenation level-dependent (BOLD) contrast. Twenty-one contiguous, axial slices of 5 mm thickness were acquired using the following parameters: repetition time (TR) 1500 ms, echo time (TE) 30 ms, field of view (FOV) 220 mm, flip angle (FA) 70°, in-plane resolution (IPR) 3.4×3.4 mm, in-plane matrix (IPM) 64×64. High-resolution anatomic images were acquired using a 3D magnetization-prepared rapid gradient echo (MPRAGE) sequence (Mugler & Brookman, 1990) consisting of 176 contiguous, sagittal slices of 1 mm thickness (TR 2300 ms, TE 3.9 ms, inversion time 1100 ms, FA 8°, FOV 256 mm, IPR 1×1 mm, IPM 256×256).
Analysis of imaging data
Image processing and analysis was performed using BrainVoyager QX v1.6.3 and v1.9.10 (Brain Innovation, Maastricht, Netherlands). Each subject’s functional runs were real-time motion-corrected utilizing Siemens 3D-PACE (prospective acquisition motion correction). Functional images were preprocessed utilizing sinc interpolation for slice scan time correction, trilinear-sinc interpolation for intra-session alignment (motion correction) of functional volumes, and high-pass temporal filtering to 1 Hz to remove slow drifts in the data. Anatomic 3D images were processed, co-registered with the functional data, and transformed into Talairach space (Talairach & Tournoux, 1988). For group analysis, the transformed data were spatially smoothed with an isotropic Gaussian kernel (full-width half-maximum 4 mm). Analyses were based on random effects, general linear models; hence, runs were normalized in terms of percent signal change, to optimize preservation of differences between individual effect sizes. Many activations contained multiple “hot spots” that were separable. Activations were localized with respect to 3D cortical anatomy with the aid of an MR sectional atlas (Duvernoy, 1999). Time-course graphs of the BOLD signal were used to confirm task-selectivity for all activations and verify differences or similarities between groups or hands.
A number of analyses were performed. The first was an overall, random effects analysis of activity specific for tactile microspatial discrimination, relative to tactile temporal discrimination, common across groups and hands. For this analysis, imaging data was pooled across both hands and both subject groups. Activations were considered significant if they survived correction for multiple comparisons within the cerebral cortical volume by the false discovery rate (FDR) approach (Genovese, Lazar & Nichols, 2002) implemented in BrainVoyager (q < 0.05). The second set of random effects analyses explored differences between groups and hands, using the interaction between task and group, or task and hand. Differences between hands were tested using data from the entire set of blind subjects. Since these were few, tests of differences between the two blind groups and all subsequent analyses were conducted on data pooled across hands. For these contrasts, correction for multiple comparisons within the cerebral cortical volume (p < 0.05) was achieved by imposing a threshold for the volume of clusters of contiguous voxels that each passed a significance threshold of p < 0.05, using a 3D extension (implemented in BrainVoyager) of a 2D Monte Carlo simulation procedure (Forman, Cohen, Fitzgerald, Eddy, Mintun & Noll, 1995).
Given the variable degree of childhood visual impairment in the LB group (see above), we conducted random effects analyses of covariance (ANCOVAs) to assess the potential effect of this variability on the spatially-specific activations revealed in the preceding analyses. We used the beta value for the spatial – temporal contrast to index the degree of spatial selectivity. The ANCOVAs were performed in BrainVoyager with respect to two variables: the age at which the subjects became totally blind, and the age of initial onset of any visual impairment. An additional ANCOVA was carried out to explore whether activation magnitudes in any areas predicted individual tactile acuity thresholds on the microspatial task. This ANCOVA employed the individual beta values for the spatial task relative to baseline, since the beta values for the temporal task were irrelevant to performance of the spatial task. This is consistent with our previous study of sighted subjects (Stilla et al., 2007), in which we simply investigated correlations between the beta values of spatially-selective foci rather than performing an ANCOVA. To permit comparisons between sighted and blind subjects, we also re-analyzed the data of Stilla et al. (2007) using the same ANCOVA approach to test for correlations between beta values in the spatial task and individual acuity threshold. The results of all the ANCOVAs were corrected for multiple comparisons within the cerebral cortical volume (p < 0.05) by the cluster approach outlined above.
Finally, we investigated effective connectivity in the blind using multivariate Granger causality analysis, which relies on cross-prediction between multiple time series. Thus, if future values of time series y(t) can be predicted from past values of time series x(t), then x(t) can be considered to have a causal influence on y(t) (Granger, 1969). Effective connectivity between a selected set of regions of interest (ROIs) can be assessed using a multivariate implementation of this approach to the time series of BOLD signal intensities from the ROIs (Deshpande, Hu, Stilla & Sathian, 2008; Stilla et al., 2007), as in our earlier study of sighted subjects (Stilla et al., 2007). In the present study, ROIs for this analysis were selected from areas activated in common across groups and hands on the primary analysis, as well as from the ANCOVAs. The time series data used for the Granger causality analysis were pooled across subjects and hands, averaged across voxels within each ROI, normalized across runs and subjects, and concatenated across all runs and subjects to form a single vector per ROI. As detailed previously (Deshpande et al., 2008; Stilla et al., 2007), multivariate autoregressive models of the time series were used to compute directed transfer functions for each potential interaction among the selected ROIs, thus generating a connectivity matrix; the statistical significance of path weights was determined using surrogate data. Individual path weights of significant connections were tested for correlations with individual tactile acuity thresholds and with the age of total blindness.
RESULTS
Psychophysical
Table 1 lists the acuity thresholds for all subjects. An ANOVA with factors of group (EB, LB) and hand (left, right) showed no significant effect of group (F1 = 0.92; p = 0.35) or hand (F1 = 2.37; p = 0.14), and no significant interaction (F1 = 0.03; p = 0.87). Comparing thresholds between Braille-reading and non-Braille-reading hands was complicated by the use of both hands in one EB and one LB subject; further, one LB subject did not read Braille. For the seven blind subjects who read Braille with a clear hand preference, there was no significant acuity threshold difference between Braille-reading and non-Braille-reading hands (t6 = −1.8; p = 0.12).
Mean accuracy during scanning for the EB group on the spatial task was 75% for the right hand and 69.2% for the left hand; on the temporal task, 91.6% (right hand) and 91.8% (left hand). An ANOVA with factors of task and hand revealed a significant effect of task (F1,4 = 18.6; p = 0.01) but not of hand (F1,4 = 0.6; p = 0.49); the interaction between task and hand was not significant (F1,4 = 0.4; p = 0.56). For the LB group, mean accuracy during scanning on the spatial task was 71.2% for the right hand and 70.8% for the left hand; on the temporal task, 90.3% (right hand) and 91.7% (left hand). An ANOVA with factors of task and hand revealed a nearly significant effect of task (F1,4 = 7.4; p = 0.053) but not of hand (F1,4 = 0.005; p = 0.95); the interaction between task and hand was not significant (F1,4 = 0.05; p = 0.83). To summarize, accuracy was better on the temporal than the spatial task in both groups, with no significant difference between hands or task-by-hand interaction in either group.
Imaging
Common activations across EB, LB groups
Regions that were selectively active during the tactile microspatial task in the entire group of blind subjects, across both hands, were identified on the spatial – temporal contrast. Figure 2 illustrates the major activations thus identified, while Table 2 lists details of all the activations seen on this contrast. Active somatosensory cortical loci were in the postcentral sulcus (PCS) bilaterally, which corresponds to Brodmann’s area (BA) 2 (Grefkes, Geyer, Schormann, Roland & Zilles, 2001) of primary somatosensory cortex (S1). Multiple bilateral posterior parietal foci were also active, in various regions along the intraparietal sulcus (IPS) and supramarginal gyrus (SMG). These included foci in the left anterior IPS (aIPS)/SMG, the left posterior IPS (pIPS), the right aIPS, the right mid-IPS, the right pIPS, and the right ventral IPS (vIPS). There was also activity in the left precuneus. Visual cortical activation was present in the right intra-occipital sulcus (IOS; probable V3A, see below) and right lateral occipital complex (LOC), as well as bilaterally in the fusiform gyrus (FG). Activity was also noted in frontal cortex: in the frontal eye fields (FEF) and ventral premotor cortex (PMv) bilaterally. There was more extensive activation in the right compared to the left hemisphere in posterior parietal and visual cortical regions.
Figure 2.
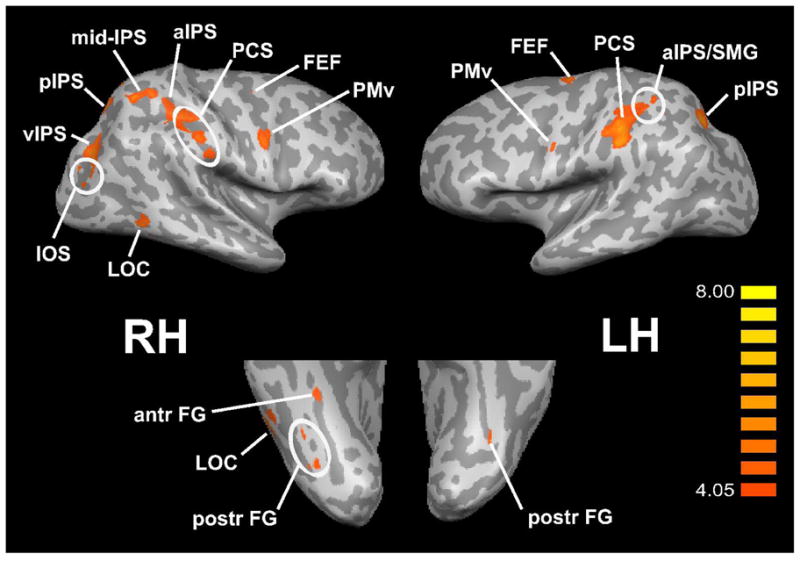
Common spatially-selective activations across EB, LB groups, displayed on inflated hemispheric representations. Top panels: lateral views; bottom panels: ventral views. RH: right hemisphere; LH: left hemisphere. Other abbreviations as in text. Color t scale on right.
Table 2.
Details of spatially-selective activations common across EB, LB groups, showing Talairach coordinates (x,y,z) and peak t values (tmax). Abbreviations as in text.
| Region | x | y | z | tmax |
|---|---|---|---|---|
| L FEF | −24 | −10 | 57 | 6.5 |
| R FEF | 27 | −7 | 46 | 4.1 |
| L PMv | −50 | 1 | 35 | 4.9 |
| R PMv | 53 | 0 | 31 | 5 |
| L PCS | −51 | −30 | 36 | 6.2 |
| L aIPS/SMG | −34 | −43 | 48 | 5.8 |
| L pIPS | −21 | −61 | 35 | 6.3 |
| L precuneus | −8 | −69 | 47 | 5.2 |
| R PCS | 52 | −31 | 39 | 4.9 |
| R aIPS | 35 | −36 | 38 | 5.2 |
| R mid-IPS | 27 | −56 | 51 | 5.5 |
| R pIPS | 15 | −68 | 47 | 5.1 |
| R vIPS | 30 | −76 | 19 | 5.7 |
| R IOS | 30 | −78 | 2 | 4.5 |
| R LOC | 48 | −54 | −9 | 5.5 |
| R antr FG | 39 | −39 | −11 | 5 |
| R postr FG (2 foci) | 44 | −57 | −19 | 4.8 |
| 30 | −70 | −17 | 4.6 | |
| L postr FG | −35 | −64 | −14 | 4.6 |
Differential activations between hands
Differences between hands in spatially-selective activations were investigated using the task-by-hand interaction, in data pooled across both blind groups. These differences were few, and favored the left hand. They were in cortex around the right central sulcus, including both precentral and postcentral gyri, and the right mid-IPS (Table 3, top). No regions showed significantly more spatially-selective activation for the right hand. Given these relatively minor differences, data were pooled across hands for all subsequent analyses.
Table 3.
Details of differential spatially-selective activations across hands and groups, showing Talairach coordinates (x,y,z) and peak t values (tmax). Abbreviations as in text.
| x | y | z | tmax | |
|---|---|---|---|---|
| LEFT HAND > RIGHT HAND | ||||
| R central sulcus | 40 | −25 | 53 | 2.8 |
| R mid-IPS | 24 | −59 | 49 | 2.9 |
| EB > LB | ||||
| SMA/pre-SMA | 4 | 2 | 46 | 4.3 |
| L FEF/PMd | −27 | −10 | 47 | 2.9 |
| R FEF/PMd | 25 | −11 | 51 | 2.8 |
| R postr cingulate | 11 | −28 | 42 | 2.9 |
| L PCG/PCS | −34 | −27 | 36 | 4 |
| L aIPS | −25 | −41 | 55 | 4.8 |
| L OP3 | −31 | −11 | 8 | 2.9 |
| L retro-insular | −30 | −32 | 15 | 2.9 |
| L antr insula | −27 | 24 | 4 | 2.6 |
| L IFG | −26 | 38 | 12 | 2.5 |
| R IFS | 41 | 36 | 13 | 3.3 |
| R antr insula | 38 | 23 | −3 | 3.2 |
| R OP3 | 37 | −5 | 6 | 3.4 |
| R PMv | 52 | 2 | 28 | 4 |
| R PCS | 54 | −22 | 33 | 4.7 |
| R aIPS | 33 | −38 | 51 | 3.5 |
| R pIPS | 13 | −66 | 49 | 6.2 |
| R POF | 10 | −79 | 34 | 4.2 |
| L POF | −11 | −75 | 34 | 3.8 |
| R IOS | 25 | −75 | 18 | 4.5 |
| L infra-calcarine | −9 | −67 | 0 | 3.2 |
| R PHG | 24 | −46 | 0 | 4.1 |
| R collateral sulcus | 22 | −54 | −15 | 3.7 |
| LB > EB | ||||
| L precuneus | −13 | −55 | 26 | 3.1 |
Differential activations between groups
Differences between groups in spatially-selective activations were investigated using the task-by-group interaction, in data pooled across hands.
A number of regions demonstrated significantly more spatially-selective activation in the EB group compared to the LB group (Figure 3, Table 3, middle). These included somatosensory cortical regions: a zone spanning the left postcentral gyrus (PCG) and PCS, the right PCS, bilateral parietal opercular areas in the field termed OP3 (Eickhoff, Grefkes, Zilles & Fink, 2007), and left retro-insular cortex. Posterior parietal foci identified on this analysis were in the aIPS bilaterally, the right pIPS and the right posterior cingulate. A number of visual cortical regions also emerged: in the parieto-occipital fissure (POF) bilaterally; in the IOS, collateral sulcus and parahippocampal gyrus (PHG) on the right; and in infra-calcarine cortex on the left. Overlaying these activation sites on flat maps (Figure 4) and comparing their locations with previously published reports of retinotopically mapped visual cortex (Burton, 2003; Grill-Spector & Malach, 2004; Orban, Van Essen & Vanduffel, 2004) suggest that the IOS site was in area V3A and the infra-calcarine site, in V1v/V2v. The POF sites were probably in area V6 (Pitzalis, Galletti, Huang, Patria, Committeri, Galati, Fattori & Sereno, 2006). Frontal cortical regions were also seen on this analysis: in a zone spanning the supplementary motor area (SMA) and pre-SMA, in bilateral zones spanning the FEFs and dorsal premotor cortex (PMd), bilaterally in the anterior insula, in the left inferior frontal gyrus (IFG), the right inferior frontal sulcus (IFS) and the right PMv.
Figure 3.
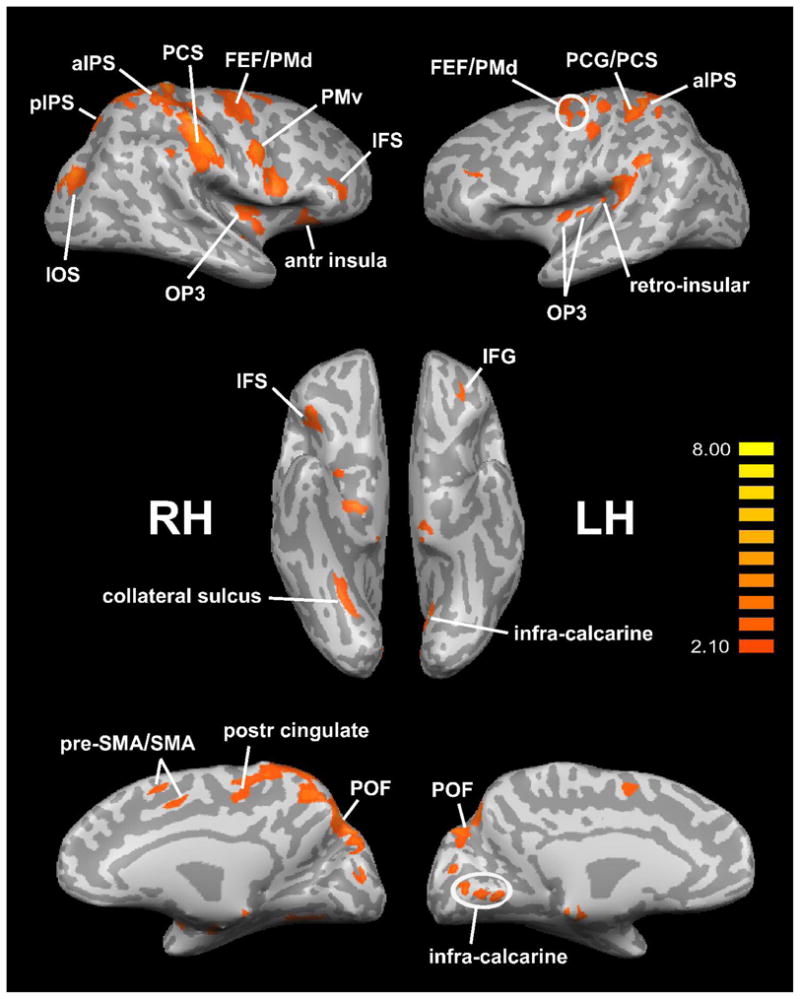
Spatially-selective activations EB > LB, displayed on inflated hemispheric representations. Top panels: lateral views; middle panels: ventral views; bottom panels: medial views. RH: right hemisphere; LH: left hemisphere. Other abbreviations as in text. Color t scale on right.
Figure 4.
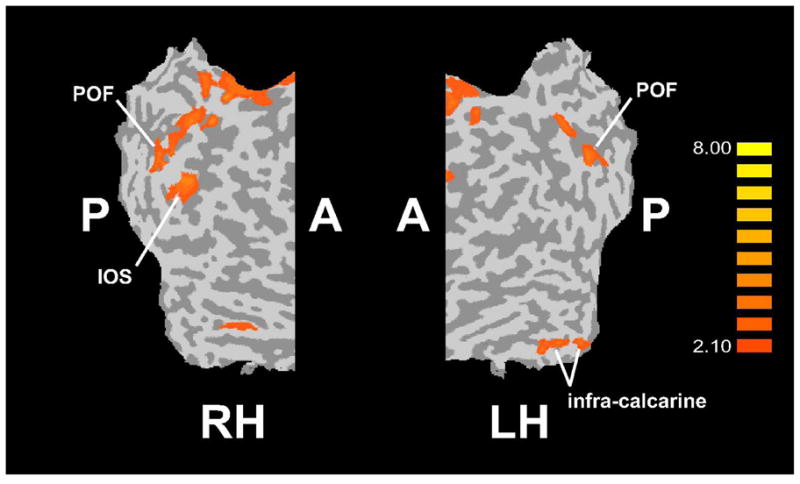
Visual cortical regions showing spatially-selective activations EB > LB, displayed on flat maps of right and left hemisphere (RH, LH). A: anterior; P: posterior; other abbreviations as in text. Color t scale on right.
The only area with significantly more spatially-selective activation in the LB group compared to the EB group was in the left precuneus (Table 3, bottom).
Effect of age at which subjects became blind
ANCOVA between spatially-selective activity and the age at which subjects became completely blind yielded four regions where the degree of spatial selectivity correlated significantly with the age of complete blindness (Figure 5, Table 4). These regions were all on the right, in the PCS, pIPS, FEF and medial PCG. The correlations were all negative, indicating that spatial selectivity in these regions tended to increase as the age of complete blindness decreased. The first three of these regions were also identified as demonstrating spatially-selective activation in the entire blind group, with greater spatial selectivity in the EB group relative to the LB group (see above). Figure 6 illustrates time-courses of the BOLD signal in each of these three areas, separately for the EB and LB groups. These graphs confirm that, for these three areas, the degree of spatial selectivity was substantially greater in the EB group than the LB group. A similar ANCOVA between the degree of spatial selectivity and the age of first onset of any visual impairment yielded no significant correlations.
Figure 5.
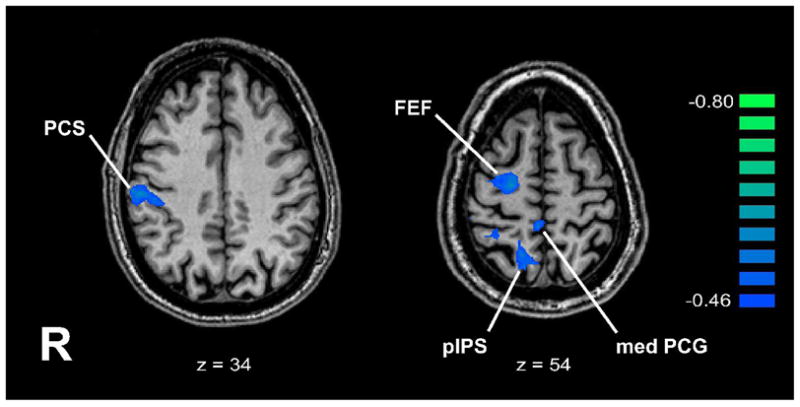
Regions where ANCOVA showed negative correlations between degree of spatial selectivity and age of total blindness, displayed on representative axial slices. Talairach z plane is indicated below each slice. R: right; other abbreviations as in text. Color r scale on right.
Table 4.
Details of regions where ANCOVA showed negative correlations between degree of spatial selectivity and age of total blindness, showing Talairach coordinates (x,y,z) and peak r values (rmax). Abbreviations as in text.
| x | y | z | rmax | |
|---|---|---|---|---|
| R FEF | 24 | −11 | 54 | −0.59 |
| R pIPS | 14 | −65 | 51 | −0.72 |
| R PCS | 55 | −22 | 34 | −0.61 |
| R med PCG | 4 | −40 | 58 | −0.61 |
Figure 6.

BOLD signal time-courses in regions where ANCOVA showed negative correlations between degree of spatial selectivity and age of total blindness. Error bars: SEM; abbreviations as in text.
Correlation between activation magnitude and acuity threshold
ANCOVA between activation magnitude in the spatial task and acuity threshold revealed a number of regions where there were significant negative correlations between these two variables (Figure 7, Table 5). The negative correlations indicate that activation magnitude was greater in those who had better acuity (lower thresholds). These regions were all in somatosensory or visual cortex. Two were in S1, both on the left: in the PCG comprising BA 3b/1 (Geyer, Schleicher & Zilles, 1999; Geyer, Schormann, Mohlberg & Zilles, 2000), and in the PCS (BA 2). The rest were in visual cortex: on the left, in the middle occipital gyrus (MOG), posterior and mid-FG, and inferior temporal gyrus (ITG); on the right, at the occipital pole (gyrus descendens), in the lingual gyrus (LG) and in the right LOC. Overlaying these regions on flat maps (Figure 8) and comparing their locations with published retinotopic maps (Burton, 2003; Grill-Spector & Malach, 2004; Orban, Van Essen & Vanduffel, 2004) suggests that the MOG locus was in area V3A, the occipitopolar locus in V1d/V1v/V2d, and the LG locus in V2v. Among the areas emerging on this analysis, the left PCS (BA 2 of S1) and left posterior FG loci showed significant spatially-selective activity in the entire blind group (Table 2). The right LOC focus identified on this analysis was posteromedial to the part of the LOC showing significant spatially-selective activity in the entire blind group. The left PCG (BA 3b/1 of S1), right occipitopolar (V1d/V1v/V2d), left ITG and right LOC foci all demonstrated spatially-selective activation in either EB or LB subjects, or both groups, although activations at these sites did not survive correction for multiple comparisons in the entire blind group and were not tested for statistical significance separately in each group. Figure 9 illustrates representative BOLD signal time-courses from some of these foci.
Figure 7.
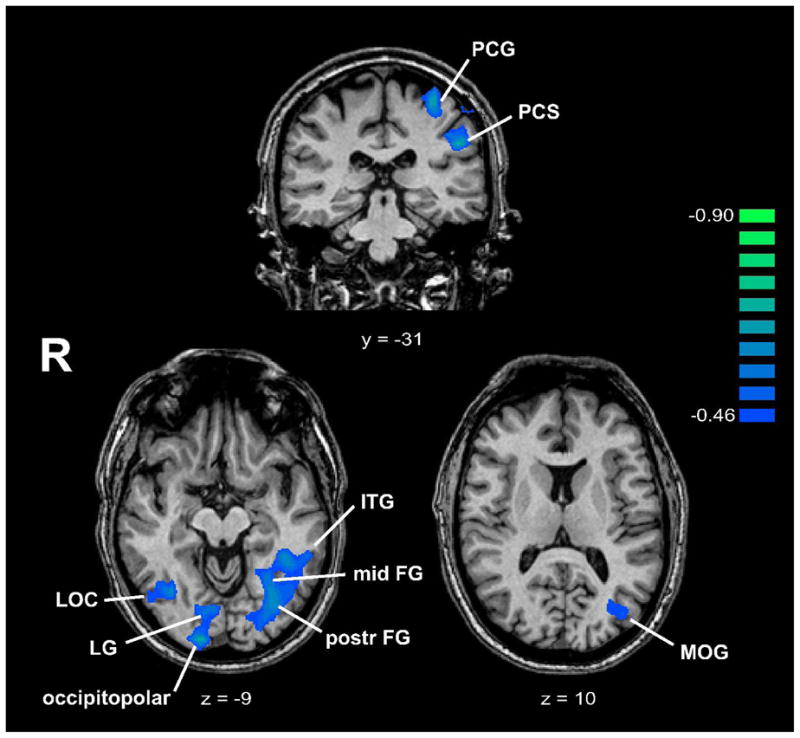
Regions where ANCOVA showed negative correlations between activation magnitude and acuity threshold, displayed on representative coronal/axial slices. Talairach y/z plane is indicated below each slice. R: right; other abbreviations as in text. Color r scale on right.
Table 5.
Details of regions where ANCOVA showed negative correlations between activation magnitude and acuity threshold, showing Talairach coordinates (x,y,z) and peak r values (rmax). Abbreviations as in text.
| x | y | z | rmax | |
|---|---|---|---|---|
| L PCG | −31 | −28 | 56 | −0.81 |
| L PCS | −49 | −31 | 31 | −0.71 |
| L MOG | −39 | −76 | 7 | −0.52 |
| L postr FG | −34 | −68 | −10 | −0.67 |
| L mid-FG | −29 | −55 | −7 | −0.62 |
| L ITG | −44 | −49 | −10 | −0.63 |
| R GD (occipitopolar) | 14 | −95 | −7 | −0.73 |
| R LG | 11 | −79 | −11 | −0.59 |
| R LOC | 39 | −62 | −7 | −0.61 |
Figure 8.

Visual cortical regions where ANCOVA showed negative correlations between activation magnitude and acuity threshold, displayed on flat maps of right and left hemisphere (RH, LH). A: anterior; P: posterior; other abbreviations as in text. Color r scale on right.
Figure 9.
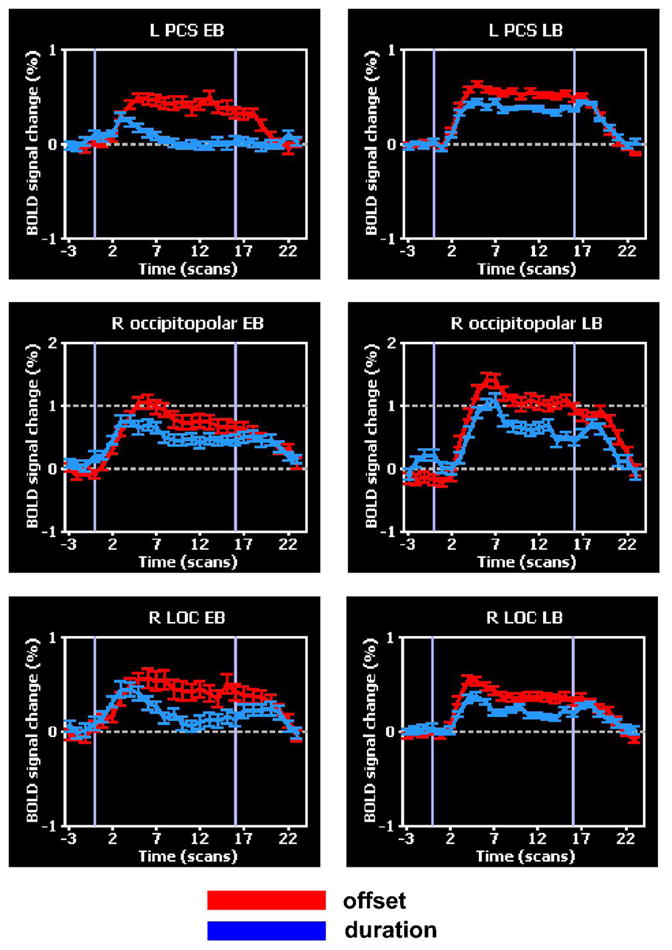
BOLD signal time-courses in regions where ANCOVA showed negative correlations between activation magnitude and acuity threshold. Error bars: SEM; abbreviations as in text.
Effective connectivity analysis
A set of fourteen ROIs was selected for multivariate Granger causality analyses of effective connectivity. They were intended to be representative of (i) regions showing spatially-selective activation, (ii) regions whose spatial selectivity correlated with the age of total blindness, and (iii) regions whose activation magnitude correlated with acuity threshold. Four ROIs were spatially-selective regions from Table 2: left FEF, left aIPS/SMG, left pIPS and right aIPS. Four were the right hemispheric regions from Table 4 where spatial selectivity correlated with the age of total blindness: FEF, pIPS, PCS and medial PCG. Note that the first three of these regions also showed spatially-selective activation in the entire blind group, with greater spatial selectivity in EB than LB subjects. The remaining six ROIs were from the regions where activation magnitude correlated with acuity threshold (Table 5). Two were somatosensory (left PCG, left PCS, corresponding to BA 3b/1 and BA 2, respectively, of S1) and four were visual (left posterior FG, left ITG, right occipitopolar and right LOC); of these, as noted earlier, the left PCS and left posterior FG loci were spatially-selective in the entire blind group.
The resulting connections are illustrated in Figure 10, while Table 6 lists the path weights of each connection, with significant paths shown in bold type. The arrows in Figure 10 refer to the direction of inferred causality, while the arrows beside each path weight in Table 6 reflect the tendency of the BOLD signal in the two ROIs linked by the path to co-vary (↑), i.e. both tending to increase or decrease together, albeit with a phase difference; or vary in opposite directions (↓), i.e. one tending to increase when the other tends to decrease, analogous to positive and negative correlations. We refer to these as “co-varying” and “anti-varying” paths, but this does not imply excitatory vs. inhibitory connections at the neuronal level, since our inferences of Granger causality are based on the hemodynamic response, whose relationship with excitatory vs. inhibitory synaptic activity is still uncertain (Stilla et al., 2007).
Figure 10.
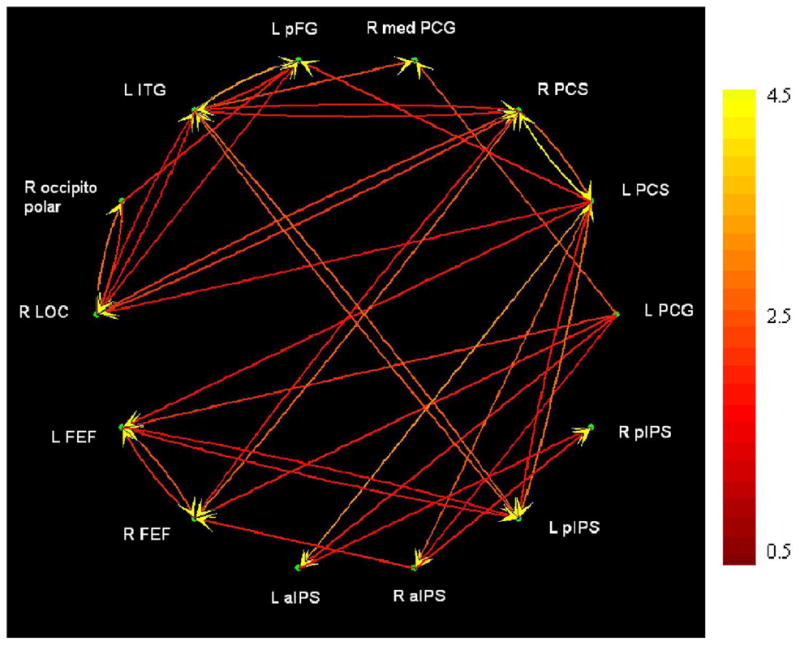
Effective connectivity as revealed by Granger causality analysis. The left aIPS focus also extended into the SMG. Abbreviations as in text. Color scale at right indicates path weights (arbitrary units).
Table 6.
Path weights (arbitrary units) of connections between ROIs, as revealed by multivariate Granger causality analysis. The left aIPS focus also extended into the SMG. Abbreviations as in text.
| L PCG | L PCS | R PCS | R medPCG | L pFG | L ITG | R occiptiopolar | R LOC | L FEF | R FEF | L aIPS | R aIPS | L pIPS | R pIPS | |
|---|---|---|---|---|---|---|---|---|---|---|---|---|---|---|
| L PCG | - | ↑0.36 | ↑0.31 | ↓0.27 | ↓0.00 | ↑0.21 | ↓0.08 | ↑0.09 | ↓0.45 | ↓0.07 | ↓0.05 | ↑0.14 | ↑0.02 | ↑0.01 |
| L PCS | ↑0.26 | - | ↑2.11 | ↓0.01 | ↑0.10 | ↑0.04 | ↓0.00 | ↑0.29 | ↑0.23 | ↑0.00 | ↑0.35 | ↑0.29 | ↑0.76 | ↑0.02 |
| R PCS | ↑0.43 | ↑4.89 | - | ↓0.03 | ↓0.00 | ↓0.80 | ↓0.03 | ↑1.31 | ↑0.01 | ↑0.79 | ↓0.00 | ↑0.14 | ↓0.05 | ↓0.01 |
| R medPCG | ↑1.81 | ↑0.05 | ↑0.12 | - | ↓0.00 | ↑1.56 | ↓0.02 | ↑0.00 | ↓0.04 | ↑0.01 | ↓0.01 | ↑0.00 | ↓0.18 | ↑0.20 |
| L pFG | ↑0.01 | ↑0.96 | ↑0.00 | ↑0.00 | - | ↑3.28 | ↓0.82 | ↑0.74 | ↓0.00 | ↓0.00 | ↑0.02 | ↑0.03 | ↑0.09 | ↓0.06 |
| L ITG | ↑0.29 | ↑0.09 | ↓0.78 | ↑0.22 | ↑0.83 | - | ↓0.03 | ↑0.68 | ↑0.12 | ↓0.03 | ↑0.01 | ↓0.01 | ↑1.97 | ↓0.00 |
| R occiptiopolar | ↑0.17 | ↑0.00 | ↑0.03 | ↓0.01 | ↑0.29 | ↑0.04 | - | ↑2.37 | ↓0.07 | ↑0.01 | ↑0.01 | ↑0.05 | ↑0.00 | ↓0.00 |
| R LOC | ↑0.15 | ↑0.62 | ↑1.35 | ↓0.00 | ↑0.12 | ↑0.78 | ↓1.28 | - | ↑0.07 | ↑0.04 | ↑0.01 | ↑0.06 | ↑0.05 | ↓0.00 |
| L FEF | ↑1.15 | ↑0.67 | ↑0.02 | ↓0.04 | ↓0.00 | ↑0.21 | ↓0.11 | ↑0.09 | - | ↑1.18 | ↓0.01 | ↑0.02 | ↑0.74 | ↑0.03 |
| R FEF | ↑0.87 | ↑0.09 | ↑2.09 | ↓0.06 | ↓0.00 | ↑0.20 | ↓0.10 | ↑0.33 | ↑1.87 | - | ↓0.02 | ↑0.82 | ↑0.24 | ↑0.00 |
| L aIPS | ↑0.83 | ↑3.04 | ↑0.03 | ↓0.02 | ↓0.01 | ↑0.03 | ↓0.02 | ↑0.04 | ↑0.04 | ↓0.03 | - | ↑0.00 | ↑0.39 | ↑0.36 |
| R aIPS | ↑0.59 | ↑2.06 | ↑0.32 | ↓0.00 | ↑0.02 | ↑0.02 | ↓0.12 | ↑0.25 | ↑0.03 | ↑0.41 | ↓0.00 | - | ↑0.01 | ↑0.42 |
| L pIPS | ↑0.04 | ↑2.33 | ↑0.10 | ↓0.11 | ↓0.01 | ↑2.11 | ↓0.00 | ↑0.06 | ↑0.61 | ↑0.05 | ↑0.14 | ↓0.01 | - | ↑0.15 |
| R pIPS | ↑0.15 | ↑0.39 | ↑0.20 | ↑0.18 | ↓0.04 | ↑0.02 | ↓0.01 | ↑0.01 | ↑0.16 | ↓0.00 | ↑0.50 | ↑0.75 | ↑0.38 | - |
Significant paths shown in bold.
Red: Somatosensory;
Blue: Visual;
Green: Frontoparietal;
Pink: Somatosensory ↔ Visual interaction;
Dark Yellow: Somatosensory ↔ Frontoparietal interaction;
Teal: Visual ↔ Frontoparietal interaction
Examining these connections reveals some interesting patterns: (1) The left PCS (BA2 of S1) was the most important source, with 7 significant outputs compared to only 2 significant inputs. Other ROIs that were important sources were the left PCG (BA 3b/1 of S1) and left ITG, with 5 significant outputs each, and the right PCS (BA2 of S1) which had 4 significant outputs. Thus, somatosensory cortical areas were the most prominent drivers in the circuit. (2) The likelihood of any ROI being a target was more even, with most ROIs receiving 2–4 inputs. (3) Most of the outputs of frontal (FEFs) and posterior parietal (IPS) ROIs were directed to another ROI in the FEF or IPS. (4) Most of the connections of visual cortical areas were with other visual or somatosensory cortical areas, whereas outputs of somatosensory cortical areas tended to be distributed to all other types of ROIs. (5) Most significant connections were co-varying. The right occipitopolar (V1d/V1v/V2d) region, however, had outputs that were anti-varying despite a majority of inputs that were co-varying, suggesting that activity in this region tended to be antiphased with that in its target areas.
Finally, we tested for correlations between path weights and acuity thresholds, and between path weights and the age of total blindness. Two paths had weights that significantly predicted acuity threshold: the path from left FEF to left pIPS (r = −0.56, p = 0.01) and the path from left PCS to right LOC (r = −0.48, p = 0.03). The former path linked ROIs whose activation magnitudes themselves did not predict acuity threshold, whereas the latter path linked ROIs whose whose activation magnitudes did predict acuity threshold. One path weight significantly predicted the age of total blindness, that for the path from right LOC to right occipitopolar cortex (r = −0.47, p = 0.04): the ROIs linked by this path had activation magnitudes that correlated with acuity threshold but not the age of total blindness. All these paths were co-varying.
DISCUSSION
Tactile spatial acuity
Acuity thresholds of the blind individuals in the present study were comparable to those of sighted subjects on the same task (Stilla et al., 2007). Although this appears contradictory to some earlier studies reporting superiority of blind over sighted subjects on various measures of tactile spatial acuity (Goldreich & Kanics, 2003; Grant, Thiagarajah & Sathian, 2000; Stevens, Foulke & Patterson, 1996; Van Boven, Hamilton, Kauffman, Keenan & Pascual-Leone, 2000), the present study was not designed explicitly to address this issue, and hence the apparent lack of difference between sighted and blind subjects on the measure used here should be viewed cautiously. It is worth noting, however, that the task used in the present study is purely spatial in nature, without contamination by potential intensity cues. Such intensity cues could have contributed to perceptual judgments on tasks where the blind were found to be superior: their ability to detect smaller gaps in bars or to judge the orientation of shorter bars (Stevens, Foulke & Patterson, 1996); and their lower thresholds for hyperacutely detecting that the central dot in a 3-dot array was laterally offset (Grant, Thiagarajah & Sathian, 2000). Given the known psychophysical and neurophysiological anisotropies of tactile acuity at the fingerpad (Wheat & Goodwin, 2000), lower grating orientation discrimination thresholds in the blind (Goldreich & Kanics, 2003; Van Boven et al., 2000) may also reflect use of intensity cues in addition to spatial cues. The issue of superior tactile acuity in the blind thus merits further study.
The present study showed no significant acuity differences between left and right hand, between Braille-reading or non Braille-reading hand, or between EB and LB subjects. Two previous studies also failed to find significant acuity differences between EB and LB subjects (Goldreich & Kanics, 2003; Grant, Thiagarajah & Sathian, 2000). While one study reported lower grating orientation discrimination thresholds on Braille-reading fingers (Van Boven et al., 2000), others found no differences on the same test between blind subjects who read Braille and those who did not (Goldreich & Kanics, 2003), and dot offset detection thresholds did not differ between the Braille-reading or non Braille-reading hand (Grant, Thiagarajah & Sathian, 2000). In the present study, acuity thresholds for the single LB subject who did not read Braille were within the range of those for Braille readers. Thus, whether Braille reading specifically affects tactile spatial acuity remains an open question.
Spatially-selective activations common across blind subjects
Although there were accuracy differences between tasks in the present study, favoring the temporal task, similar accuracy differences were also seen in our study of normally sighted subjects (Stilla et al., 2007). Some regions showed spatial selectivity in the blind (present study) as well as the normally sighted (Stilla et al., 2007). These included all the posterior parietal activations of the present study except that in the right ventral IPS (vIPS), and all the frontal cortical activations of the present study except that in the right PMv. Visual cortical regions that were found to be spatially selective were selectively and robustly active in the blind for the spatial task. In sighted subjects, the only visual cortical areas showing spatially selective activation were the LOC bilaterally, but the BOLD signal increases above baseline were only minimal and transient, being followed by longer-lasting signal decreases (Stilla et al., 2007), in contrast to the clear activation in blind subjects. The other visual cortical regions that were spatially selective in the blind were mostly deactivated (i.e., had largely negative BOLD signal changes) in the sighted, upon examination of unpublished imaging data from our earlier study of the sighted (Stilla et al., 2007). These were in right V3A and bilaterally in the FG. A few regions that showed spatially selective activity in the earlier study of the sighted (Stilla et al., 2007) were not found to be significantly active in the blind. These included the parietal opercular somatosensory cortical region termed OP3 by Eickhoff et al. (2007), which was bilaterally active in the sighted. This region did exhibit spatially selective activity in the blind, but the activity did not survive correction for multiple comparisons. This weaker OP3 activation in the entire blind group may in part reflect differential activity between EB and LB subjects (EB > LB). Activations in the LB subject who did not read Braille were qualitatively similar to those in the other subjects.
Correlations of activation magnitudes and path weights with acuity thresholds
Whereas in sighted subjects it was the right pIPS and neighboring precuneus where the level of activity predicted individual tactile spatial acuity (Stilla et al., 2007), the present study revealed a very different pattern in the blind. Our previous study did not employ an ANCOVA approach; instead, correlations were tested at sites that were spatially selective on the primary analysis. To ensure that the differences between sighted and blind subjects were not artifacts of this methodological variation, a similar ANCOVA as used in the present study was conducted on the beta values for the spatial task relative to baseline, from the data in sighted subjects of Stilla et al. (2007). This new analysis confirmed that activation magnitude in the right pIPS did correlate with acuity threshold (two foci, r = −0.6 and −0.64). A few other foci were also found where activation magnitude correlated significantly with acuity threshold, but most of these had positive correlations (i.e., negatively predicted acuity) and none had significant spatially-selective activation.
In contradistinction to the posteromedial parietal cortical locus of activity predicting acuity thresholds in the sighted, left somatosensory cortex and bilateral visual cortex contained sites whose activation magnitudes predicted acuity thresholds in the blind. The visual cortical foci included foci in what is normally retinotopic visual cortex, in right V1/V2 and left V3A, as well as more inferiorly in what is normally object-selective cortex, in the right LOC, left posterior FG and left inferotemporal cortex. As noted earlier, most of these foci showed some degree of spatial selectivity in either EB or LB subjects, or both groups, and the left PCS (BA 2 of S1) and left posterior FG foci were significantly spatially selective in the entire blind group.
The paths whose weights predicted acuity threshold also differed between sighted and blind. Whereas in better-performing sighted subjects these paths were from the left PCS and right FEF to the right pIPS (Stilla et al., 2007), the relevant paths in the blind connected the left FEF to the left pIPS, and the left PCS to the right LOC. Together with the differing locations of regions whose activation magnitude predicted acuity threshold, these findings indicate that optimal tactile spatial discrimination engages a rather different network in the blind compared to the sighted. Sighted individuals appear to rely on a circuit involving interaction in the right pIPS of a top-down control signal, possibly attentional, with somatosensory cortical inputs (Stilla et al., 2007). In contrast, the blind seem to depend on a more distributed network involving left somatosensory cortex and a complex of visual cortical areas in both hemispheres, including some areas that in the sighted are known to be retinotopically mapped, and others that are object-selective. The interaction between somatosensory and visual cortex appears to be a pivotal one, since one of the paths predicting acuity linked the left PCS (BA 2 of S1) and right LOC, both of which had activation magnitudes that also predicted acuity. The import of the projection from the left FEF to the left pIPS is less clear: these two foci did not themselves predict acuity in their activation magnitudes, although both were spatially selective in the entire blind group.
Differential spatially-selective activity as a function of the age of blindness
An extensive set of regions exhibited greater spatial selectivity in the EB group compared to the LB group. These included areas of somatosensory, visual, posterior parietal and frontal cortex. Since there was a variable degree of visual impairment in childhood among the LB subjects, we investigated whether there were regions where the degree of spatial selectivity correlated with the age of total blindness or the age of first onset of visual impairment. The latter variable did not correlate significantly with spatial selectivity in any cortical area, while the age of complete visual deprivation did. Three of the regions showing greater spatial selectivity in the EB group relative to the LB group, which were also spatially selective in the entire blind group, had spatial selectivity whose degree predicted the age of complete blindness. All were in the right hemisphere. One was a somatosensory cortical region (PCS (BA 2 of S1)), another was a posterior parietal region (pIPS), and the third was frontal (FEF). Intriguingly, the right pIPS was the focus where activation magnitude predicted acuity threshold in the sighted (Stilla et al., 2007). However, none of the regions where spatial selectivity correlated with the age of complete blindness had activation magnitudes that predicted acuity in the blind. A path within visual cortex, from right LOC to right V1/V2d, predicted the age of complete blindness. While the degree of spatial selectivity in these two ROIs did not correlate with the age of total blindness, their activation magnitudes did predict acuity thresholds in the blind.
Effective connectivity patterns
The patterns of effective connectivity revealed by Granger causality analyses were quite different in the blind (present study) as compared to the sighted (Stilla et al., 2007) when performing the same tasks. It should be emphasized that the paths revealed by this analysis are not necessarily direct; they could be mediated through nodes that were not included in the analysis (Deshpande et al., 2008). However, mediated influences within the network studied were removed by partial coherence analysis. The left PCS (BA 2 of S1) was an important source in both the sighted and the blind, but other sources differed, with the left FEF being important in the sighted whereas the right PCS (BA 2 of S1), left PCG (BA 3b/1 of S1) and left ITG emerged as key sources in the blind. The right pIPS was a more common target in the sighted, while visual cortical regions were significantly involved in connectivity in the blind. These effective connectivity findings reinforce the idea derived from activation patterns and correlations of activation with acuity, that the blind use a cortical network that is substantially different from the sighted. Other studies using resting functional connectivity (Liu, Yu, Liang, Li, Tian, Zhou, Qin, Li & Jiang, 2007), diffusion tensor imaging (Shimony, Burton, Epstein, McLaren, Sun & Snyder, 2006), or transcranial magnetic stimulation coupled with positron emission tomography (Wittenberg, Werhahn, Wassermann, Herscovitch & Cohen, 2004), have also concluded that there are connectivity differences between the sighted and blind, although at present, it is not possible to integrate the diverse findings of these earlier studies and the current study into a unified framework.
Engagement of visual cortex during non-visual perception in the blind
Although visual cortical activation in the blind has been reported during auditory (Weeks, Horwitz, Aziz-Sultan, Tian, Wessinger, Cohen, Hallett & Rauschecker, 2000) and tactile stimulation (Burton, Sinclair & McLaren, 2004; Goyal, Hansen & Blakemore, 2006; Pietrini et al., 2004; Ptito et al., 2005; Ricciardi et al., 2007; Sadato et al. 1996, 1998, 2002, 2004), all of these studies compared the effects to a rest control. As a consequence, it has not been clear whether sensory processing per se, apart from a host of cognitive processes, can itself recruit visual cortical activity in the blind over and above that commonly reported in the sighted (reviewed by Sathian & Lacey, 2007). Thus, a motivation for the present study was to ascertain whether tactile sensory processing recruits visual cortical activity. The answer is definitely affirmative. As discussed above, a number of visual cortical areas were preferentially active across our entire blind group during tactile microspatial discrimination, relative to tactile temporal discrimination. These included the right LOC, bilateral foci in the FG, and right V3A, which were all activated only minimally or not at all in our prior study of the sighted using the same task contrast (Stilla et al., 2007). Interestingly, V3A was found in a previous study from our laboratory (Weisser, Stilla, Peltier, Hu & Sathian, 2005) to deactivate bilaterally when sighted subjects performed tactile form discrimination and gap detection tasks after two hours of blindfolding. Further, in the present study, a number of visual cortical areas had activation magnitudes that correlated with acuity threshold. Of these, the left posterior FG focus showed significant spatially selective activity in the entire blind group, while the left inferotemporal focus, the right LOC and right V1/V2d demonstrated spatial selectivity in at least one blind group (EB or LB). Also, the weight of the path from left S1 (PCS (BA2)) to the right LOC predicted acuity. Thus, cross-modal visual cortical activity during tactile perception in the blind does seem to be functionally relevant. Parts of the visual cortex appear to be recruited into the distributed network supporting tactile microspatial perception in the blind, unlike in the sighted. Some visual cortical areas were more spatially selective in EB than LB subjects; these were in left V1v/V2v, right V3A, bilateral V6, right collateral sulcus and right parahippocampal gyrus. It bears mention that the left V6 focus has been implicated in tactile discrimination of grating orientation in sighted subjects (Sathian, Zangaladze, Hoffman & Grafton, 1997; Zangaladze, Epstein, Grafton & Sathian, 1999).
It remains unclear how to reconcile visual cortical activity in the blind being specific for tactile microspatial perception (present study) with the growing literature implicating such activity in a wide range of cognitive tasks, including language processing (Amedi et al., 2004; Büchel, Price & Friston, 1998; Burton, Diamond & McDermott, 2003; Burton & McLaren, 2006; Burton, McLaren & Sinclair, 2006; Burton, Snyder, Conturo et al., 2002; Burton, Snyder, Diamond et al., 2002; Röder et al., 2002), verbal memory (Amedi, Raz, Pianka, Malach & Zohary, 2003) and attention (Alho, Kujala, Paavilainen, Summala & Näätänen, 1993; Garg, Schwartz & Stevens, 2007; Kujala, Alho, Paavilainen, Summala & Näätänen, 1992; Kujala, Huotilainen, Sinkkonen, Ahonen, Alho, Hämäläinen, Ilmoniemi, Kajola, Knuutila, Lavikainen, Salonen, Simola, Standertskjöld-Nordenstam, Tiitinen, Tissari & Näätänen, 1995; Kujala, Palva, Salonen, Alku, Huotilainen, Järvinen & Näätänen, 2005; Röder, Rösler, Hennighausen & Näcker, 1996; Stevens, Snodgrass, Schwartz & Weaver, 2007; Weaver & Stevens, 2007). Is there a common denominator underlying all these tasks? If so, it is most likely to be a high-level cognitive factor. This question remains open for future research to answer.
CONCLUSIONS
Many aspects of the activity and effective connectivity during tactile microspatial discrimination differed between the blind and sighted, with some of the key differences being in visual cortex. The spatially-selective network in blind subjects included some frontoparietal regions also similarly selective in the sighted, and visual cortical areas that showed little to no activity in the sighted. Acuity thresholds were predicted in the blind by activation magnitudes in left S1 and bilateral visual cortex, and the weights of projections from the left FEF to the left pIPS and the left PCS (BA 2 of S1) to the right LOC; but in the sighted by the activation magnitude of the right pIPS and the weights of paths into this focus from the left PCS (BA 2 of S1) and right FEF. An extensive set of somatosensory, visual, posterior parietal and frontal cortical regions exhibited greater spatial selectivity in the EB group compared to the LB group. A subset of frontoparietal regions from this set, along with the weight of a path from the right LOC to right V1/V2d, predicted the age of complete blindness. The left PCS (BA 2 of S1) was an important source of connections in both sighted and blind; the right PCS (BA 2 of S1), left PCG (BA 3b/1 of S1) and left ITG were more important in the blind whereas the left FEF was more important in the sighted. The right pIPS was a more common target in the sighted, while visual cortical regions were significantly involved in connectivity in the blind, interacting with one another as well as with somatosensory cortex. While visual cortical activity is clearly involved in tactile perception, the underlying reasons remain uncertain, since such activity also characterizes a host of cognitive processes.
Acknowledgments
This work was supported by NIH grants R01 EY12440 and K24 EY17332 to KS, and R01 EB002009 to XH. Support to KS from the Veterans Administration is also gratefully acknowledged. We are indebted to Peter Flueckiger and Naresh Jegadeesh for help with running the studies, and to Valerie Biousse for conducting neuro-ophthalmological evaluations of the blind subjects.
References
- Alho K, Kujala T, Paavilainen P, Summala H, Näätänen R. Auditory processing in visual brain areas of the early blind: evidence from event-related potentials. Electroencephalography and Clinical Neurophysiology. 1993;86:418–427. doi: 10.1016/0013-4694(93)90137-k. [DOI] [PubMed] [Google Scholar]
- Amedi A, Floel A, Knecht S, Zohary E, Cohen LG. Transcranial magnetic stimulation of the occipital pole interferes with verbal processing in blind subjects. Nature Neuroscience. 2004;7:1266–70. doi: 10.1038/nn1328. [DOI] [PubMed] [Google Scholar]
- Amedi A, Raz N, Pianka P, Malach R, Zohary E. Early ‘visual’ cortex activation correlates with superior verbal memory performance in the blind. Nature Neuroscience. 2003;6:758–766. doi: 10.1038/nn1072. [DOI] [PubMed] [Google Scholar]
- Büchel C, Price C, Frackowiak RSJ, Friston K. Different activation patterns in the visual cortex of late and congenitally blind subjects. Brain. 1998;121:409–419. doi: 10.1093/brain/121.3.409. [DOI] [PubMed] [Google Scholar]
- Büchel C, Price C, Friston K. A multimodal language region in the ventral visual pathway. Nature. 1998;394:274–277. doi: 10.1038/28389. [DOI] [PubMed] [Google Scholar]
- Burton H. Visual cortex activity in early and late blind people. Journal of Neuroscience. 2003;23:4005–4011. doi: 10.1523/JNEUROSCI.23-10-04005.2003. [DOI] [PMC free article] [PubMed] [Google Scholar]
- Burton H, Diamond JB, McDermott KB. Dissociating cortical regions activated by semantic and phonological tasks: a fMRI study in blind and sighted people. Journal of Neurophysiology. 2003;90:1965–1982. doi: 10.1152/jn.00279.2003. [DOI] [PMC free article] [PubMed] [Google Scholar]
- Burton H, Sinclair RJ, McLaren DG. Cortical activity to vibrotactile stimulation: an fMRI study in blind and sighted individuals. Human Brain Mapping. 2004;23:210–228. doi: 10.1002/hbm.20064. [DOI] [PMC free article] [PubMed] [Google Scholar]
- Burton H, Snyder AZ, Conturo TE, Akbudak E, Ollinger JM, Raichle ME. Adaptive changes in early and late blind: a fMRI study of Braille reading. Journal of Neurophysiology. 2002;87:589–607. doi: 10.1152/jn.00285.2001. [DOI] [PMC free article] [PubMed] [Google Scholar]
- Burton H, Snyder AZ, Diamond JB, Raichle ME. Adaptive changes in early and late blind: a fMRI study of verb generation to heard nouns. Journal ofNeurophysiology. 2002;88:3359–3371. doi: 10.1152/jn.00129.2002. [DOI] [PMC free article] [PubMed] [Google Scholar]
- Burton H, McLaren DG. Visual cortex activation in late-onset, Braille naïve blind individuals: an fMRI study during semantic and phonological tasks with heard words. Neuroscience Letters. 2006;392:38–42. doi: 10.1016/j.neulet.2005.09.015. [DOI] [PMC free article] [PubMed] [Google Scholar]
- Burton H, McLaren DG, Sinclair RJ. Reading embossed capital letters: an fMRI study in blind and sighted individuals. Human Brain Mapping. 2006;27:325–339. doi: 10.1002/hbm.20188. [DOI] [PMC free article] [PubMed] [Google Scholar]
- Cohen LG, Celnik P, Pascual-Leone A, Corwell B, Faiz L, Dambrosia J, Honda M, Sadato N, Gerloff C, Catala MD, Hallett M. Functional relevance of cross-modal plasticity in blind humans. Nature. 1997;389:180–183. doi: 10.1038/38278. [DOI] [PubMed] [Google Scholar]
- Cohen LG, Weeks RA, Sadato N, Celnik P, Ishii K, Hallett M. Period of susceptibility for cross-modal plasticity in the blind. Annals of Neurology. 1999;45:451–460. doi: 10.1002/1531-8249(199904)45:4<451::aid-ana6>3.0.co;2-b. [DOI] [PubMed] [Google Scholar]
- Deshpande G, Hu X, Stilla R, Sathian K. Effective connectivity during haptic perception: a study using Granger causality analysis of functional magnetic resonance imaging data. NeuroImage. 2008;40:1807–1814. doi: 10.1016/j.neuroimage.2008.01.044. [DOI] [PMC free article] [PubMed] [Google Scholar]
- Duvernoy HM. Surface, blood supply and three-dimensional sectional anatomy. New York: Springer; 1999. The human brain. [Google Scholar]
- Eickhoff SB, Grefkes C, Zilles K, Fink GR. The somatotopic organization of cytoarchitectonic areas on the human parietal operculum. Cerebral Cortex. 2007;17:1800–1811. doi: 10.1093/cercor/bhl090. [DOI] [PubMed] [Google Scholar]
- Forman SD, Cohen JD, Fitzgerald M, Eddy WF, Mintun MA, Noll DC. Improved assessment of significant activation in functional magnetic resonance imaging (fMRI): use of a cluster-size threshold. Magnetic Resonance Medicine. 1995;33:636–647. doi: 10.1002/mrm.1910330508. [DOI] [PubMed] [Google Scholar]
- Garg A, Schwartz D, Stevens AA. Orienting auditory spatial attention engages frontal eye fields and medial occipital cortex in congenitally blind humans. Neuropsychologia. 2007;45:2307–2321. doi: 10.1016/j.neuropsychologia.2007.02.015. [DOI] [PMC free article] [PubMed] [Google Scholar]
- Genovese CR, Lazar NA, Nichols T. Thresholding of statistical maps in functional neuroimaging using the false discovery rate. NeuroImage. 2002;15:870–878. doi: 10.1006/nimg.2001.1037. [DOI] [PubMed] [Google Scholar]
- Geyer S, Schleicher A, Zilles K. Areas 3a, 3b, and 1 of human primary somatosensory cortex: 1. Microstructural organization and interindividual variability. NeuroImage. 1999;10:63–83. doi: 10.1006/nimg.1999.0440. [DOI] [PubMed] [Google Scholar]
- Geyer S, Schormann T, Mohlberg H, Zilles K. Areas 3a, 3b, and 1 of human primary somatosensory cortex: 2. Spatial normalization to standard anatomical space. NeuroImage. 2000;11:684–696. doi: 10.1006/nimg.2000.0548. [DOI] [PubMed] [Google Scholar]
- Goldreich D, Kanics IM. Tactile acuity is enhanced in blindness. Journal of Neuroscience. 2003;23:3439–3445. doi: 10.1523/JNEUROSCI.23-08-03439.2003. [DOI] [PMC free article] [PubMed] [Google Scholar]
- Goyal MS, Hansen PJ, Blakemore CB. Tactile perception recruits functionally related visual areas in the late blind. NeuroReport. 2006;17:1381–1384. doi: 10.1097/01.wnr.0000227990.23046.fe. [DOI] [PubMed] [Google Scholar]
- Granger CWJ. Investigating causal relations by econometric models and cross-spectral methods. Econometrica. 1969;37:424–438. [Google Scholar]
- Grant AC, Thiagarajah MC, Sathian K. Tactile perception in blind Braille readers: A psychophysical study of acuity and hyperacuity using gratings and dot patterns. Perception & Psychophysics. 2000;62:301–312. doi: 10.3758/bf03205550. [DOI] [PubMed] [Google Scholar]
- Grefkes C, Geyer S, Schormann T, Roland P, Zilles K. Human somatosensory area 2: observer-independent cytoarchitectonic mapping, interindividual variability, and population map. NeuroImage. 2001;14:617–631. doi: 10.1006/nimg.2001.0858. [DOI] [PubMed] [Google Scholar]
- Grill-Spector K, Malach R. The human visual cortex. Annual Review of Neuroscience. 2004;27:649–677. doi: 10.1146/annurev.neuro.27.070203.144220. [DOI] [PubMed] [Google Scholar]
- Hamilton R, Keenan JP, Catala M, Pascual-Leone A. Alexia for Braille following bilateral occipital stroke in an early blind woman. NeuroReport. 2000;11:237–240. doi: 10.1097/00001756-200002070-00003. [DOI] [PubMed] [Google Scholar]
- Hyvärinen J, Carlson S, Hyvärinen L. Early visual deprivation alters modality of neuronal responses in area 19 of monkey cortex. Neuroscience Letters. 1981;26:239–243. doi: 10.1016/0304-3940(81)90139-7. [DOI] [PubMed] [Google Scholar]
- Kujala T, Alho K, Paavilainen P, Summala H, Näätänen R. Neural plasticity in processing of sound location by the early blind: an event-related potential study. Electroencephalography and Clinical Neurophysiology. 1992;84:469–472. doi: 10.1016/0168-5597(92)90034-9. [DOI] [PubMed] [Google Scholar]
- Kujala T, Huotilainen M, Sinkkonen J, Ahonen AI, Alho K, Hämäläinen MS, Ilmoniemi RJ, Kajola M, Knuutila JET, Lavikainen J, Salonen O, Simola J, Standertskjöld-Nordenstam CG, Tiitinen H, Tissari SO, Näätänen R. Visual cortex activation in blind humans during sound discrimination. Neuroscience Letters. 1995;183:143–146. doi: 10.1016/0304-3940(94)11135-6. [DOI] [PubMed] [Google Scholar]
- Kujala T, Palva MJ, Salonen O, Alku P, Huotilainen M, Järvinen A, Näätänen R. The role of blind humans’ visual cortex in auditory change detection. Neuroscience Letters. 2005;379:127–131. doi: 10.1016/j.neulet.2004.12.070. [DOI] [PubMed] [Google Scholar]
- Liu Y, Yu C, Liang M, Li J, Tian L, Zhou Y, Qin W, Li K, Jiang T. Whole brain functional connectivity in the early blind. Brain. 2007;130:2085–2096. doi: 10.1093/brain/awm121. [DOI] [PubMed] [Google Scholar]
- Mugler JP, Brookman JR. Three dimensional magnetization-prepared rapid gradient-echo imaging (3D MPRAGE) Magnetic Resonance Medicine. 1990;15:152–157. doi: 10.1002/mrm.1910150117. [DOI] [PubMed] [Google Scholar]
- Orban GA, Van Essen D, Vanduffel D. Comparative mapping of higher visual areas in monkeys and humans. Trends in Cognitive Sciences. 2004;8:315–324. doi: 10.1016/j.tics.2004.05.009. [DOI] [PubMed] [Google Scholar]
- Pascual-Leone A, Torres F. Plasticity of the sensorimotor cortex representation of the reading finger in Braille readers. Brain. 1993;116:39–52. doi: 10.1093/brain/116.1.39. [DOI] [PubMed] [Google Scholar]
- Pietrini P, Furey ML, Ricciardi E, Gobbini MI, Wu WHC, Cohen L, Guazzelli M, Haxby JV. Beyond sensory images: object-based representation in the human ventral pathway. Proceedings of the National Academy of Sciences of the USA. 2004;101:5658–5663. doi: 10.1073/pnas.0400707101. [DOI] [PMC free article] [PubMed] [Google Scholar]
- Pitzalis S, Galletti C, Huang RS, Patria F, Committeri G, Galati G, Fattori P, Sereno MI. Wide-field retinotopy defines human cortical visual area V6. Journal of Neuroscience. 2006;26:7962–7973. doi: 10.1523/JNEUROSCI.0178-06.2006. [DOI] [PMC free article] [PubMed] [Google Scholar]
- Ptito M, Moesgaard SM, Gjedde A, Kupers R. Cross-modal plasticity revealed by electrotactile stimulation of the tongue in the congenitally blind. Brain. 2005;128:606–614. doi: 10.1093/brain/awh380. [DOI] [PubMed] [Google Scholar]
- Ptito M, Fumal A, Martens de Noordhout A, Schoenen J, Gjedde A, Kupers R. TMS of the occipital cortex induces tactile sensations in the fingers of blind Braille readers. Experimental Brain Research. 2008;184:193–200. doi: 10.1007/s00221-007-1091-0. [DOI] [PubMed] [Google Scholar]
- Raczkowski D, Kalat JW, Nebes R. Reliability and validity of some handedness questionnaire items. Neuropsychologia. 1974;12:43–47. doi: 10.1016/0028-3932(74)90025-6. [DOI] [PubMed] [Google Scholar]
- Rauschecker JP, Tian B, Korte M, Egert U. Crossmodal changes in the somatosensory vibrissa/barrel system of visually deprived animals. Proceedings of the National Academy of Sciences of the USA. 1992;89:5063–5067. doi: 10.1073/pnas.89.11.5063. [DOI] [PMC free article] [PubMed] [Google Scholar]
- Ricciardi E, Vanello N, Sani L, Gentili C, Scilingo EP, Landini L, Guazzelli M, Bicchi A, Haxby JV, Pietrini P. The effect of visual experience on the development of functional architecture in hMT+ Cerebral Cortex. 2007;17:2933–2939. doi: 10.1093/cercor/bhm018. [DOI] [PubMed] [Google Scholar]
- Röder B, Rösler F, Hennighausen E, Näcker F. Event-related potentials during auditory and somatosensory discrimination in sighted and blind subjects. Cognitive Brain Research. 1996;4:77–93. [PubMed] [Google Scholar]
- Röder B, Stock O, Bien SNH, Rösler F. Speech processing activates visual cortex in congenitally blind humans. European Journal of Neuroscience. 2002;16:930–936. doi: 10.1046/j.1460-9568.2002.02147.x. [DOI] [PubMed] [Google Scholar]
- Sadato N, Okada T, Honda M, Yonekura Y. Critical period for cross-modal plasticity in blind humans: a functional MRI study. NeuroImage. 2002;16:389–400. doi: 10.1006/nimg.2002.1111. [DOI] [PubMed] [Google Scholar]
- Sadato N, Okada T, Kubota K, Yonekura Y. Tactile discrimination activates the visual cortex of the recently blind naïve to Braille: a functional magnetic resonance imaging study in humans. Neuroscience Letters. 2004;359:49–52. doi: 10.1016/j.neulet.2004.02.005. [DOI] [PubMed] [Google Scholar]
- Sadato N, Pascual-Leone A, Grafman J, Deiber MP, Ibanez V, Hallett M. Neural networks for Braille reading by the blind. Brain. 1998;121:1213–1229. doi: 10.1093/brain/121.7.1213. [DOI] [PubMed] [Google Scholar]
- Sadato N, Pascual-Leone A, Grafman J, Ibanez V, Deiber MP, Dold G, Hallett M. Activation of the primary visual cortex by Braille reading in blind subjects. Nature. 1996;380:526–528. doi: 10.1038/380526a0. [DOI] [PubMed] [Google Scholar]
- Sathian K, Lacey S. Journeying beyond classical somatosensory cortex. Canadian Journal of Experimental Psychology. 2007;61:254–264. doi: 10.1037/cjep2007026. [DOI] [PubMed] [Google Scholar]
- Sathian K, Zangaladze A, Hoffman JM, Grafton ST. Feeling with the mind’s eye. NeuroReport. 1997;8:3877–3881. doi: 10.1097/00001756-199712220-00008. [DOI] [PubMed] [Google Scholar]
- Shimony JS, Burton H, Epstein AA, McLaren DG, Sun SW, Snyder AZ. Diffusion tensor imaging reveals white matter reorganization in early blind humans. Cerebral Cortex. 2006;16:1653–1661. doi: 10.1093/cercor/bhj102. [DOI] [PMC free article] [PubMed] [Google Scholar]
- Sterr A, Müller MM, Elbert T, Rockstroh B, Pantev C, Taub E. Perceptual correlates of changes in cortical representation of fingers in blind multifinger Braille readers. Journal of Neuroscience. 1998;18:4417–4423. doi: 10.1523/JNEUROSCI.18-11-04417.1998. [DOI] [PMC free article] [PubMed] [Google Scholar]
- Stevens AA, Snodgrass M, Schwartz D, Weaver K. Preparatory activity in occipital cortex in early blind humans predicts auditory perceptual performance. Journal of Neuroscience. 2007;27:10734–10741. doi: 10.1523/JNEUROSCI.1669-07.2007. [DOI] [PMC free article] [PubMed] [Google Scholar]
- Stevens JC, Foulke E, Patterson MQ. Tactile acuity, aging and Braille reading in long-term blindness. Journal of Experimental Psychology: Applied. 1996;2:91–106. [Google Scholar]
- Stilla R, Deshpande G, LaConte S, Hu X, Sathian K. Posteromedial parietal cortical activity and inputs predict tactile spatial acuity. Journal of Neuroscience. 2007;27:11091–11102. doi: 10.1523/JNEUROSCI.1808-07.2007. [DOI] [PMC free article] [PubMed] [Google Scholar]
- Talairach J, Tournoux P. Co-planar stereotaxic atlas of the brain. New York: Thieme Medical Publishers; 1988. [Google Scholar]
- Toldi J, Farkas T, Völgyi B. Neonatal enucleation induces cross-modal changes in the barrel cortex of rat. A behavioural and electrophysiological study. Neuroscience Letters. 1994a;167:1–4. doi: 10.1016/0304-3940(94)91014-6. [DOI] [PubMed] [Google Scholar]
- Toldi J, Rojik I, Feher O. Neonatal monocular enucleation-induced cross-modal effects observed in the cortex of adult rat. Neuroscience. 1994b;62:105–114. doi: 10.1016/0306-4522(94)90318-2. [DOI] [PubMed] [Google Scholar]
- Van Boven RW, Hamilton RH, Kauffman T, Keenan JP, Pascual-Leone A. Tactile spatial resolution in blind Braille readers. Neurology. 2000;54:2230–2236. doi: 10.1212/wnl.54.12.2230. [DOI] [PubMed] [Google Scholar]
- Veraart C, De Volder AG, Wanet-Defalque MC, Bol A, Michel C, Goffinet AM. Glucose utilization in human visual cortex is abnormally elevated in blindness of early onset but decreased in blindness of late onset. Brain Research. 1990;510:115–121. doi: 10.1016/0006-8993(90)90735-t. [DOI] [PubMed] [Google Scholar]
- Weaver KE, Stevens AA. Attention and sensory interactions within the occipital cortex in the early blind: an fMRI study. Journal of Cognitive Neuroscience. 2007;19:315–330. doi: 10.1162/jocn.2007.19.2.315. [DOI] [PubMed] [Google Scholar]
- Weeks R, Horwitz B, Aziz-Sultan A, Tian B, Wessinger CM, Cohen LG, Hallett M, Rauschecker JP. A positron emission tomographic study of auditory localization in the congenitally blind. Journal of Neuroscience. 2000;20:2664–2672. doi: 10.1523/JNEUROSCI.20-07-02664.2000. [DOI] [PMC free article] [PubMed] [Google Scholar]
- Weisser V, Stilla R, Peltier S, Hu X, Sathian K. Short-term visual deprivation alters neural processing of tactile form. Experimental Brain Research. 2005;166:572–582. doi: 10.1007/s00221-005-2397-4. [DOI] [PubMed] [Google Scholar]
- Wheat HW, Goodwin AW. Tactile discrimination of gaps by slowly adapting afferents: effects of population parameters and anisotropy in the fingerpad. Journal of Neurophysiology. 2000;84:1430–1444. doi: 10.1152/jn.2000.84.3.1430. [DOI] [PubMed] [Google Scholar]
- Wittenberg GF, Werhahn KJ, Wassermann EM, Herscovitch P, Cohen LG. Functional connectivity between somatosensory and visual cortex in early blind humans. European Journal of Neuroscience. 2004;20:1923–1927. doi: 10.1111/j.1460-9568.2004.03630.x. [DOI] [PubMed] [Google Scholar]
- Zangaladze A, Epstein CM, Grafton ST, Sathian K. Involvement of visual cortex in tactile discrimination of orientation. Nature. 1999;401:587–590. doi: 10.1038/44139. [DOI] [PubMed] [Google Scholar]