

Abstract
The exchanges of 125I-labeled 4-iodoantipyrine (I-Ap), 14C-labeled antìpyrine (14C-Ap), and tritiated water (THO) were studied in isolated blood-perfused, beating, nonworking dog hearts. From a first set of experiments, analysis of externally monitored myocardial clearance curves of I-Ap after its injection into coronary artery blood showed its washout to be flow limited at flows ranging from 0.8 to 3.8 ml · g−1 · min−1. Therefore, these curves can be used for estimating coronary blood flow. In a second set of experiments, coronary sinus dilution curves of simultaneously injected I-Ap and THO were found to be indistinguishable in shape at high coronary flows. At low flows (<1.8 ml · g−1 · min−1), THO curves showed an earlier upslope and higher peak than antipyrine, indicating either a diffusional shunt for water or a larger volume of distribution for antipyrine. 14C-Ap had a slightly faster washout than I-Ap. The differences are partially attributable either to differences in solubility of I-Ap, 14C-Ap, and THO in erythrocytes or to differences in their volumes of distribution, and partially to diffusional shunting of water.
Additional Key Words: indicator dilution, isotopic labeling, tritium iodine, coronary blood flow, capillary permeability, diffusible indicators, intratissue diffusion, volume of distribution, compartmental analysis
Antipyrine (1,5-dimethyl-2-phenyl-3-pyrazolone) has been shown to equilibrate with tissue water of most organs when injected into the circulation (1-3) and hence can provide estimates of the water content of an organ or of the whole body. Both labeled and nonlabeled antipyrine have been used for estimating the blood flow to an organ on the basis of the washout after intra-arterial or intratissue injection (4-6). Iodine labeling of antipyrine is desirable because gamma detection can be used over an organ or on a venous outflow line and may provide easier estimation of concentration in multiple sequential samples than does chemical analysis (7) even when adapted for an AutoAnalyzer (5, 8).
Renkin (9) showed that antipyrine exchange in isolated perfused skeletal muscles is flow limited at body temperatures, but myocardial flows are 10 to 100 times higher. However, the addition of an iodide radical increases the molecular weight of antipyrine from 188 to 315, possible changes its pK′a and partition coefficient, reduces its free diffusion coefficient, and increases its polarity, which might reduce its rate of movement through tissue and membranes so much that its washout might not be limited solely by the flow. This would invalidate its use for estimation of flow-from-washout curves. Crone (10) has shown that, in the brain, even uniodinated antipyrine is permeability limited. Thus, the first objective of the present study is to show that iodoantipyrine-125I exchange is indeed flow limited in the heart and to compare its washout to that of uniodinated antipyrine or tritiated water.
In steady-state experiments, antipyrine was found to have a volume of distribution similar to that of tritiated water (11), and this volume is unaffected by chemical labeling (N-acetyl-4-aminoantipyrine) or isotopic labeling (4-iodoantipyrine-131I) (2). Johnson et al. (12) and others have shown that water is flow limited in its exchange. But from steady-state experiments one cannot tell whether iodoantipyrine's lower diffusion coefficient inhibits its exchanges between blood and tissue, and, therefore, transient-state experiments must be used. Thus, the second objective of this study is to show that coronary venous outflow curves for iodoantipyrine and tritiated water after simultaneous intra-arterial slug injection are identical at high blood flows, indicating that both are indeed flow limited during their traversal through the isolated dog heart. A subsidiary objective is to point out that the high diffusibility of water influences the shape of THO curves at low flows and that its washout is therefore influenced by both flow and diffusion.
Materials and Methods
Isotopic Indicators
4-Iodoantipyrine-125I (125I-Ap) (Radiochemical Centre, Amersham, England) had an initial activity in water of 1.0 mc/ml. The four batches used contained less than 1 mg of antipyrine/ml. Prior to injection these were diluted in either water or isotonic saline to about 100 μc/ml. The dose for each dilution curve varied from 20 to 40 μc.
4-Iodoantipyrine-131I (131I-Ap) (Abbott Laboratories, North Chicago, Ill.) in aqueous solution, with 0.9% benzyl alcohol as preservative, was obtained at 1.0 mc/ml and contained 0.07 mg of antipyrine/ml. The dose used for each injection was 15 to 20 μc.
Antipyrine-14C (14C-Ap) (New England Nuclear Corp., Boston, Mass.) was obtained in crystalline form at 1 mc/100 to 300 mg; the dose used was 50 μc per injection.
Tritiated water (THO, Abbott Laboratories, North Chicago, Ill.) had an initial activity of 1 mc/ml, and the dose per injection was 40 to 100 μc.
Albumin-131I (RISA, Abbott Laboratories, North Chicago, Ill.), 20 μc per injection, was used as a nonpermeating reference tracer in a few instances.
Detachment of the 125I from I-Ap would vitiate its use as an antipyrine tracer. Munck and Andersen (13) observed up to 26% detachment, and therefore in these experiments the degree of separation in each batch was tested, within 24 hours of the animal experiment, by high-voltage electrophoresis (Savant Instruments, Inc., Hicksville, N. Y.) on Whatman 3 MM paper for 20 minutes at 2,000 or 3,000 v. The buffer was 0.1 to 0.075m barbital in water titrated with concentrated HCl to pH 8.6. In four batches of 125I-Ap used, the amount of free iodide varied from 2 to 5% of the total activity. Dilution in water or saline made no difference. In two batches of albumin-131I, free iodide was 2 to 3% (diluted in saline or water). In the single batch of 131I-Ap used, the free iodide was 6%.
Isolated Heart Studies
Two different studies were done on the isolated heart over wide ranges of flow. In one, myocardial washout curves of I-Ap were observed through a gamma detector placed over the heart; in the other, venous outflow concentration-vs.-time curves of isotopically labeled antipyrine and THO were compared.
In both experiments, hearts were removed from dogs weighing 6 to 8 kg, perfused briefly with oxygenated saline to wash out the blood, then perfused continuously through an aortic cannula with blood at 37.5°C taken from the femoral artery of a support dog weighing 20 to 25 kg. The hearts were suspended from a weighing device1 whose output signal was calibrated and continuously recorded. The surface of the heart was covered with a thin film of plastic (Mylar) to prevent drying. The pulmonary artery was cannulated; the venous drainage from the coronary sinus and right ventricle was returned to the femoral vein of the support dog. A vent placed at the apex of the left ventricle kept the ventricle empty of blood from the small amount of leakage through the aortic valves and the thebesian drainage. The hearts were beating but not performing external work. The methods had been previously described in more detail (6).
The externally monitored washout curves were recorded after injections, lasting about 1 second, of 125I-Ap into the aortic root. In early experiments using venous outflow collection, the bolus of injectate contained only 125I-Ap and THO. In later studies, albumin-131I was included in the bolus to permit computation of extravascular mean transit times. Because free iodide might have a different diffusibility than I-Ap, and because I-Ap is a larger molecule than antipyrine, simultaneously recorded venous dilution curves for THO, 131I-Ap, and 14C-Ap were compared.
After adequate perfusion was established, a priming mixture of 500 ml of dextran2 (Rheomacrodex, 10% w/v, Pharmacia, Uppsala) and 500 ml of isotonic saline was infused into the support dog. Then 500 ml of the now somewhat diluted blood was removed and set aside at 38°C, to be reinfused during the recording of the indicator dilution curve. In this way, the blood volume of the support dog was maintained, while recirculation of isotopic indicator was avoided by diverting the venous outflow.
Before injecting the isotope, flow was measured and four samples of blood were collected for indicator background levels and for use in making up standards. The injection, whose total volume did not exceed 1 ml, was from a graduated 1-ml tuberculin syringe through a one half-inch, 27-gauge needle whose tip was in the aortic cannula. The duration of injection was recorded and averaged 2 seconds, faster injection being avoided so as not to produce hemolysis at the injection site. Time zero was defined as the midpoint of the injection. Starting at time zero, blood samples (approximately 5 ml) were collected from the coronary venous outflow into previously labeled plastic tubes. The time and duration for each sample were marked on a photokymographic recorder (CEC, Pasadena, Calif.) on which the support dog's arterial pressure, the isolated heart's perfusion pressure, and the timing marks were also recorded. The time of collection of each sample was taken from the midpoint of the sampling period. The initial samples were smaller and were taken at every 1 to 2 seconds, the interval being progressively increased after the first one half to 1 minute. Generally, 60 samples were collected for each run (the total time for collection varied from 200 to 500 seconds depending on the flow) with a resultant blood loss of about 300 ml from the system. During the sampling, no recirculation of blood to the support dog was permitted but, after the 60th sample was taken, the blood collected from coronary sinus outflow in excess of the samples was reinfused into the support dog, 20 minutes were allowed for equilibration, and then 200 to 500 ml of blood was set aside as before.
At the completion of the experiment, the isolated heart preparation was dissected into five parts: (1) the ventricles, (2) the atria, (3) great vessels, (4) the fatty tissue around the coronary arteries and aortic root, and (5) the appendages of the preparation (part of trachea, mediastinum, and lung root). These were washed briefly to remove the blood, blotted to remove excess moisture, weighed individually, and dried at 70°C until a constant weight was obtained.
Radioactivities were counted in a liquid scintillation spectrometer (Tri-Carb Series 3375, Packard Instrument Co., Downers Grove, Ill.). To each 0.1 or 0.2 ml of blood sample, measured out with a micropipette (Eppendorf, distributed by Brinkmann Instruments, Westbury, N. Y.) was added an equal volume of 60% perchloric acid and two volumes of 30% hydrogen peroxide. The mixture was incubated at 80°C for 30 to 45 minutes, until the resulting solution was either faintly yellow or colorless (14, 15). This solution was cooled, 19 ml of liquid scintillating fluid (1.000 g of Triton X, 80 ml of 25-X [PPO, DMPOPOP; obtained from Packard], and 1,920 ml of toluene [Mallinkrodt Chemical Works, St. Louis, Mo.]) was added, the mixture was shaken well, and the glass container was cleaned with isopropyl alcohol. The containers were then placed in the scintillation counter and counted for a maximum of 100,000 counts or for 10 minutes.
Initial calibration of the spectrometer was done with known activities of 3H, either 125I or 14C, and 131I, each of which was counted alone with varying amounts of quenching. From this, relationships were established between the automatic external standards and the efficiency of the counting of each isotope and the ratios of the counts from the higher energy isotopes in the lower energy windows.
Samples of the injectate, diluted separately in blood and in saline, were similarly prepared and counted.
Methods of Data Analysis
For the externally monitotired 125I-Ap myocardial clearance curves, the recorded counts and the time intervals for the counts were tabulated on IBM punched cards. After subtraction of background, each data point was expressed as a fraction of the peak count rate. The curves were plotted as fraction of peak versus volume of blood that had moved out of the heart after the injection. These curves represent the residue function, H*(t), which is the fraction of injected indicator residing in the tissue at time t after an impulse injection (16). Plotting of H*(t) against F·t/W (F is the flow [ml/sec] and W is myocardial weight [g]) is a normalizing procedure that allows superimposing the several plots of H*(t) at various flows. (We used a computer-driven plotter, CalComp Model 565, California Computer Products, Inc., Anaheim, Calif.) The product F·t is the volume of blood having left the heart since the time of injection.
For the simultaneous venous dilution curves, the following data were obtained: the gross counts per minute for 125I, THO, and, if present, 131I and 14C, and the automatic external standard (AES) ratios. These values, with the times of sample collection, were tabulated on IBM punched cards. Tables of AES ratios versus efficiency and of AES ratios versus the ratios of overlap of each isotope in the energy bands of the others were similarly tabulated.
To obtain the indicator dilution curves, the net isotopic activities were obtained by solution of the simultaneous equations, background activities were subtracted, and corrections were made for the counting efficiencies of samples and for isotope decay when 131I was present.
As an example, the following equations were used for separation of 3H2O, 125I, and 131I activities when the pulse-height analyzer windows were set so that the 125I window received pulses only from 125I and 131I, and the 131I window, from 131I alone. The net count rate, 131In, was:
| (1) |
in which l31Ig is the gross count rate in the 131I window above counter background; 131Ib is the count rate above counter background, corrected for efficiency and for 131I decay, due to 131I present in the blood samples taken just before injection; K131 is 0.693 divided by the half time of decay of 131I(8 days); t8 is the time elapsed between injection and counting of the sample; E1 is an efficiency for 131I determined for the same window settings by interpolation from the tables of AES ratios to efficiency for a group of known 131I samples having different degrees of quenching. The positive exponential corrects counts to the time of injection.
For 125In, correction is required for the fraction, R1, of 131I counts appearing in the 125I window:
| (2) |
in which 125Ib is the corrected count rate above counter background due to only the 125I present in the blood samples taken just before the injection. The efficiency E2 was determined for 125I from the AES ratios; R1 was obtained from a table of AES ratios versus R1 with various quenchings determined for the same window settings on the same day. K125 is 0.693 divided by the half time of decay of 125I (56 days) and therefore the exponential correction, exp (K125·ts), was considered to be unity unless ts was large (sample counting very delayed).
Similarly, the net counts for the labeled water, Tn, required correction for the fractions, R2 and R3, of 125I and 131I counts appearing in the tritium window:
| (3) |
The subscripts g and b are similar to those above, and E3 is an efficiency for THO defined for each observed AES ratio. No correction for tritium decay was made (half-life is 12.3 years). The equations for the separation of 131I, 14C, and T were similar to equations 1 to 3, 14C counts being obtained from the same window as 125I.
An alternative to the above sequential subtraction technique is to use broader window settings to obtain better efficiencies, which usually means that counts from the lower energy emissions appear in the higher energy windows and that inversion of a 3 × 3 matrix is used to solve equations analogous to equations 1 to 3. Since the matrix inversion approach is not really different, it is not outlined here. The important point of equations 1 to 3 is that one must take into account the separate problems introduced by nonzero values of R and by significant isotope decay rates such as K131.
The venous concentration-vs.-time curves were then normalized to h(t), fraction of dose per second in the outflow, by:
| (4) |
This gives the transport function–the probability density function of transit times–from injection syringe to sampling tube. The injection dose was calculated from two samples of known volume of the injectate solution, counted with each set of venous samples.
Equations 1 to 3 are based on the assumption that the preinjection blood isotope levels (131Ib, 125Ib, and Tb) are constant throughout the subsequent curve. When a sequence of samples at intervals of 10 to 30 seconds before an injection is obtained, a gradual diminution in these levels is noted when there is tracer in the blood from a previous injection. The rate of diminution usually can be approximated by an exponential rate constant when the injections are separated by 15 minutes or more. This changing experimental background level can then be accounted for in equations 1 to 3; for example, in equation 1, 131Ih is replaced with Ibe−K1tb where tb is the time from injection to time of sampling and K1 is the rate constant for the disappearance from the blood.
By using equations analogous to equation 4, each indicator dilution curve was normalized to fraction of dose per second. The percent recovery was calculated as:
| (5) |
in which ti is the time of sampling, Δti is (ti+1 − ti−1)/2, and n is the total number of observations. The mean transit times for antipyrine, tritiated water, and albumin, t̄Ap, t̄T, and t̄alb were calculated from the normalized curves by
| (6) |
This equation gives a correct value for t̄ only when recovery is 100% (that is, ); when recovery is less, division by the area of h(ti) provides a directionally appropriate correction which is completely correct when h(t) is monoexponential (17).
Results
Myocardial Washout of Antipyrine
Thirty-four normalized myocardial washout curves of 125I-Ap from seven isolated hearts were analyzed (14 of these curves from three hearts are shown in Figure 1, top). Although flows ranged from 0.3 to 3.1 ml · min−1 · g−1, the shapes of the curves do not appear to be influenced by the flow, the variation being random.
FIGURE 1.

125I-Ap washout curves after bolus injection at various flows. F/W is the flow per gram of myocardium. Top: Curves w were obtained with a detector sensitive to isotope emissions from entire isolated heart; curves cp were obtained with tighter collimation over region supplied by pump-perfused left anterior descending coronary artery in open-chest dog. Heart weights are shown in upper right corner. Recirculation of tracer in perfused coronary preparation results in higher tails on these curves. For H* (t) values of 0.9, 0.5, and 0.1, valves of F/W for each curve are listed (at arrows) in order of increasing values of F · t/W; for example, at H* (t) = 0.5, curve farthest to left was obtained at F/W = 0.5, and curve farthest to right was obtained at F/W = 3,1. Bottom: Curves from one experiment in which heart weight was obtained by continuous recording. Broken lines, F/W > 2.0; solid lines, 1 < F/W <2.0; dotted lines, F/W < 1.0.
In a later isolated-heart experiment (Fig. 1, bottom), the heart was weighed continuously so that F · t/W is more accurate. With flows ranging from 0.7 to 2.1 ml · g−1 · min−1, these normalized washout curves are very nearly superimposable.
One way of looking for an effect at different flows is to examine the volumes, F · t/W, at some chosen value of H*(t). For example, when 50% of the indicator has been removed, H*(t) is 0.50. The volumes, F · t/W, required to wash out half the indicator are randomly scattered, ranging from 0.87 to 1.0 (Fig. 1, bottom). That is, there is a random relationship between the flow, F/W, and the volume for half washout. It is this lack of correlation between the form of H*(F · t/W) and F that is the basis for our conclusion that antipyrine washout is wholly flow limited.
Simultaneous Venous Dilution Curves for I-Ap and THO
Nineteen sets of simultaneous coronary venous outflow dilution curves were obtained from five isolated hearts. The data, summarized in Table 1, are grouped according to F/W: < 1.0, between 1.0 and 2.0, and > 2.0 ml · min−1 · g−1. Detailed numerical results from two of these experiments (curves B-2 and E-5) are presented in Table 2. Four pairs of curves from one heart (experiment B) with F/W of 2.28 to 4.02 ml · g−1 · min−1 are shown in Figure 2. At these high flows, values of h(t), the fraction of dose per second arriving at the sampling site, are essentially identical for 125I-Ap and THO. Further examples in Figure 3 (experiment E-4) and Figure 4 (experiment B-1) are shown as semilog plots to bring out the details of the tail portion of the curves.
TABLE 1. Comparison of Venous Dilution Curves in Isolated Heart Experiments.
| Low flow | Medium flow | High flow | |||||||||||||||||
|---|---|---|---|---|---|---|---|---|---|---|---|---|---|---|---|---|---|---|---|
| Expt. & curve | D-3 | E-2 | E-1 | D-4 | E-5 | D-1 | E-3 | E-4 | C-3 | C-1 | C-2 | A-2 | A-11 | B-1 | A-4 | B-4 | A-3 | B-2 | B-3 |
| Experimental Parameters | |||||||||||||||||||
| F/W (ml · min−1 · g−1) | 0.47 | 0.56 | 0.57 | 0.79 | 0.79 | 0.83 | 0.90 | 1.69 | 1.75 | 1.76 | 1.78 | 1.91 | 2.02 | 2.28 | 2.52 | 2.72 | 3.19 | 3.57 | 4.02 |
| Heart rate (beats/min) | 90 | 72 | 72 | 102 | 115 | 108 | 75 | 100 | 180 | 184 | 188 | 190 | 200 | 109 | 180 | 178 | 185 | 174 | 194 |
| Perfusion pressure (mm Hg) | 118 | 136 | 120 | 162 | 72 | 140 | 148 | 148 | 100 | 120 | 120 | 130 | 150 | 155 | 155 | 170 | 160 | 130 | 175 |
| Het (%) | 54 | 39 | 40 | 49 | 35 | 46 | 38 | 36 | 58 | 68 | 67 | 56 | 50 | 44 | 39 | 33 | 52 | 38 | 42 |
| Drugs* | 0 | 0 | 0 | 0 | E | 0 | 0 | E | E+P | E+P | E + P | E + P | E | 0 | E + P | E | E + P | P | P |
| Recoveries (%) | |||||||||||||||||||
| THO | 21 | 63 | 86 | 31 | 96 | 66 | 96 | 103 | 85 | 92 | 92 | 75 | 90 | 99 | 91 | 95 | 92 | 89 | 90 |
| I-Ap† | 15 | 47 | 30 | 95 | 73 | 91 | 100 | 89 | 91 | 94 | 100 | 100 | 100 | 100 | 100 | 100 | 100 | 100 | |
| 14C-Ap | 47 | 53 | 91 | 89 | 100 | ||||||||||||||
| RISA | 20 | 30 | 70 | 100 | 100 | 100 | |||||||||||||
| t̄ (Seconds) | |||||||||||||||||||
| THO | 142 | 248 | 256 | 95 | 90 | 85 | 89 | 43 | 46 | 50 | 53 | 52 | 58 | 56 | 44 | 31 | 32 | 34 | 33 |
| I-Ap† | 143 | 256 | 90 | 104 | 85 | 92 | 47 | 51 | 52 | 53 | 56 | 61 | 61 | 50 | 33 | 35 | 38 | 35 | |
| 14C-Ap | 250 | 257 | 93 | 87 | 43 | ||||||||||||||
| RISA | 107 | 36 | 35 | 14 | 17 | 22 | |||||||||||||
| Peak h(t) (× 10−4 Fraction of Dose/sec)‡ | |||||||||||||||||||
| THO | 12 | 16 | 23 | 40 | 101 | 81 | 118 | 278 | 190 | 199 | 196 | 172 | 181 | 215 | 338 | 492 | 410 | 369 | 603 |
| I-Ap† | 8 | 13 | 41 | 85 | 90 | 111 | 243 | 170 | 183 | 187 | 229 | 200 | 206 | 338 | 522 | 402 | 394 | 651 | |
| 14C-Ap | 14 | 17 | 94 | 114 | 274 | ||||||||||||||
| Tail h(t) (×10−4 Fraction of Dose/sec)§ | |||||||||||||||||||
| THO | 21 | 8.2 | 12.1 | 1.6 | 0.5 | 4.0 | 3.6 | 3.8 | 0.7 | 1.1 | 1.4 | 0.4 | 0.7 | 0.4 | 2.2 | 4.1 | 1.8 | 1.4 | 2.8 |
| I-Ap† | 1.8 | 7.5 | 1.7 | 1.1 | 4.7 | 4.3 | 5.8 | 1.0 | 1.3 | 1.4 | 0.6 | 1.9 | 0.8 | 3.1 | 5.1 | 2.4 | 2.1 | 4.0 | |
| 14C-Ap | 7.4 | 8.8 | 0.6 | 3.6 | 4.4 | ||||||||||||||
Each letter represents an experiment on one dog; a number of curves were obtained in each experiment. Myocardial water content (ml/g) was: A, 0.81; B, 0.83; C, 0.77; D, 0.80; E, 0.77. THO = tritiated water; Hct = hematocrit value; RISA = Albumin 131I.
O= none; E = epinephrine infusion; P = dipyridamole (Persantine) infusion.
Refers to 125I-Ap except for E-2, E-5, E-3, and E-4.
Peak h(t) is maximal value of h(t).
Tail h(t) is value at last sampling point.
TABLE 2. Data of Experiments B-2 and E-5.
| B-2 | E-5 | ||||||||||||
|---|---|---|---|---|---|---|---|---|---|---|---|---|---|
| h(t) | h(t) | h(t) | h(t) | ||||||||||
| t (sec) | THO | 125I-Ap | t | THO | 125I-Ap | t | THO | 131I-Ap | 14C-Ap | t | THO | 131I-Ap | 14C-Ap |
| 3.5 | 0.8 | 1.7 | 107.5 | 7.0 | 9.3 | 1.5 | 0 | 0 | 0 | 38.3 | 99.5 | 85.1 | 92.0 |
| 5.5 | 15.1 | 16.3 | 112.5 | 6.4 | 8.3 | 2.5 | 0 | 0 | 0 | 41.8 | 95.5 | 82.5 | 89.8 |
| 8.0 | 179.2 | 181.5 | 116.5 | 5.6 | 7.7 | 3.6 | 0 | 0 | 0 | 45.3 | 91.2 | 79.6 | 87.2 |
| 10.0 | 343.6 | 355.4 | 121.0 | 5.2 | 7.2 | 4.7 | 0 | 0 | 0 | 52.9 | 86.1 | 75.5 | 83.3 |
| 12.0 | 368.7 | 386.6 | 125.5 | 4.7 | 6.9 | 5.7 | 0 | 0 | 0 | 58.0 | 79.8 | 71.2 | 78.1 |
| 14.5 | 366.5 | 393.9 | 130.5 | 4.5 | 6.4 | 6.7 | 0.2 | 0.2 | 0.1 | 63.0 | 73.8 | 66.4 | 72.7 |
| 17.0 | 318.0 | 342.3 | 134.5 | 4.2 | 6.0 | 7.7 | 1.2 | 1.0 | 0.6 | 68.8 | 67.9 | 62.2 | 67.7 |
| 19.0 | 245.6 | 271.1 | 140.0 | 3.7 | 5.5 | 8.8 | 3.8 | 3.4 | 2.1 | 73.3 | 62.6 | 58.7 | 62.4 |
| 21.5 | 215.2 | 240.4 | 144.5 | 3.5 | 4.9 | 9.9 | 9.4 | 8.9 | 5.3 | 78.6 | 57.8 | 55.9 | 57.6 |
| 24.0 | 182.2 | 201.6 | 150.5 | 3.4 | 5.1 | 10.9 | 17.3 | 16.4 | 10.4 | 83.6 | 53.9 | 52.7 | 53.2 |
| 27.0 | 157.3 | 174.5 | 153.5 | 3.0 | 4.1 | 11.9 | 26.9 | 25.0 | 17.0 | 89.0 | 49.2 | 49.7 | 48.3 |
| 30.0 | 127.7 | 135.5 | 161.5 | 2.7 | 4.3 | 13.0 | 36.4 | 32.6 | 24.4 | 94.0 | 44.4 | 45.9 | 43.3 |
| 33.5 | 102.9 | 114.9 | 166.5 | 2.5 | 3.7 | 14.0 | 45.4 | 40.3 | 31.5 | 104.6 | 39.6 | 41.0 | 38.7 |
| 37.0 | 86.8 | 99.7 | 173.5 | 2.5 | 3.4 | 15.0 | 52.9 | 46.7 | 37.8 | 114.6 | 34.7 | 36.3 | 34.1 |
| 40.0 | 72.5 | 80.5 | 179.0 | 2.1 | 3.4 | 16.1 | 58.6 | 52.3 | 43.3 | 125.2 | 29.6 | 31.8 | 29.4 |
| 44.0 | 60.1 | 70.5 | 186.5 | 2.0 | 3.0 | 17.2 | 65.3 | 56.5 | 49.7 | 135.3 | 25.5 | 27.7 | 25.5 |
| 47.5 | 50.6 | 58.4 | 193.0 | 2.0 | 2.8 | 18.2 | 71.6 | 60.6 | 56.2 | 146.3 | 21.8 | 24.1 | 21.7 |
| 51.0 | 44.7 | 50.7 | 200.5 | 1.8 | 2.8 | 19.2 | 78.2 | 63.2 | 62.8 | 156.8 | 18.5 | 21.5 | 18.2 |
| 54.0 | 38.8 | 45.2 | 205.5 | 1.8 | 3.0 | 20.3 | 83.1 | 66.1 | 68.2 | 176.6 | 15.3 | 18.6 | 15.1 |
| 58.0 | 33.8 | 42.1 | 212.0 | 1.9 | 2.7 | 21.3 | 87.0 | 67.5 | 72.9 | 187.8 | 12.7 | 15.9 | 12.5 |
| 62.0 | 28.5 | 34.6 | 218.5 | 1.7 | 2.7 | 22.4 | 90.9 | 69.5 | 77.3 | 202.8 | 10.1 | 13.5 | 9.9 |
| 66.0 | 24.1 | 29.2 | 232.5 | 1.6 | 2.5 | 23.4 | 93.7 | 71.0 | 81.0 | 218.0 | 8.0 | 11.1 | 8.0 |
| 70.0 | 20.9 | 24.7 | 239.5 | 1.5 | 2.5 | 24.5 | 95.8 | 73.5 | 84.3 | 240.2 | 6.3 | 9.1 | 6.4 |
| 74.5 | 17.8 | 22.3 | 247.0 | 1.6 | 2.2 | 25.5 | 97.2 | 75.7 | 86.6 | 259.8 | 4.9 | 7.4 | 5.0 |
| 81.0 | 14.4 | 18.5 | 270.0 | 1.4 | 2.1 | 26.5 | 98.6 | 77.6 | 88.5 | 280.8 | 3.7 | 5.7 | 3.9 |
| 86.0 | 12.2 | 16.5 | 27.6 | 100.4 | 79.1 | 90.3 | 301.6 | 2.9 | 4.4 | 2.9 | |||
| 90.0 | 11.0 | 14.4 | 28.6 | 101.2 | 78.6 | 92.1 | 333.0 | 2.1 | 3.5 | 2.1 | |||
| 95.5 | 9.1 | 11.7 | 29.7 | 101.4 | 79.0 | 93.7 | 363.5 | 1.5 | 2.5 | 1.6 | |||
| 99.0 | 8.5 | 11.3 | 30.7 | 101.1 | 80.7 | 93.4 | 394.5 | 0.9 | 1.8 | 1.0 | |||
| 103.5 | 7.9 | 10.0 | 31.7 | 101.3 | 85.3 | 91.7 | 426.2 | 0.5 | 1.1 | 0.6 | |||
in which t̄tube = TD + τ, τ/t̄tube = 0.35, and TD/t̄tube = 0.66.
Definitions same as in Table 1.
FIGURE 2.
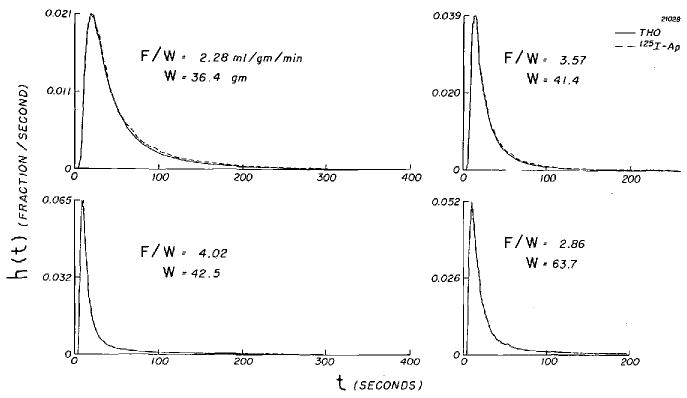
Venous dilution curves for 125I-Ap and THO from isolated dog heart. Ordinate is concentration-vs.-time curve normalized to unit area, and, because the injection durations were brief, can be considered to be the transport function, h(t), from injection site to sampling tubes.
FIGURE 3.
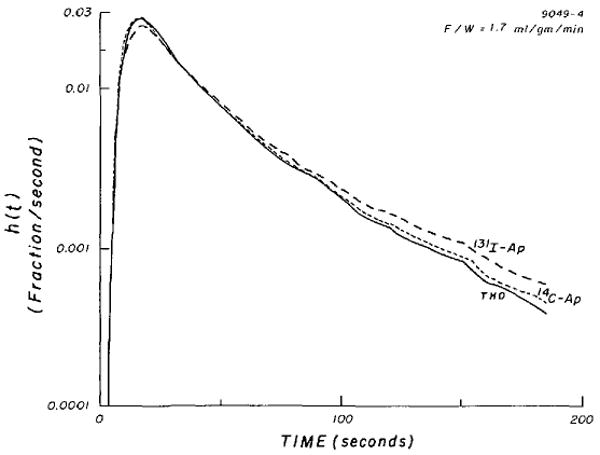
Simultaneous venous dilution curves for 131I-Ap, 14C-Ap, and THO (tritiated water) in isolated dog heart.
FIGURE 4.

Simultaneous venous dilution curves for 125I-Ap and THO (tritiated water). Note that none of the curves in Figures 3 and 4 are monoexponential.
At F/W <1.0 ml · g−1 · min−1, the isolated-heart preparation appears to be variable, with high coronary resistance, less predictable washout, and incomplete recoveries (Table 1). In four curves (D-1, D-3, D-4, and E-2) the fractions of isotope remaining in the heart are high and, on normalized plots (such as in Figure 1) of these curves, washout of THO and I-Ap required 20 to 40% more volume for the same fraction of indicator compared to that required at higher F/W, suggesting unevenness or instability of myocardial perfusion.
When the flow was low, there was a tendency for the THO curve to exhibit a higher peak than its paired I-Ap curve (Figs. 3 and 4). The ratios of the peak heights are shown to be greater than 1.0 at low flows and are scattered around 1.0 at higher flows (Fig. 5).
FIGURE 5.

Effect of flow on ratios of peak heights of water curves (hT (tp)) to those of simultaneously recorded I-Ap curves (hAp(tp)). Although scatter is great, there is tendency for water curves to have higher (and perhaps earlier peaks) at low flows. There is no apparent tendency for reverse to occur at high flows, which is what would occur if I-Ap became permeability limited to even a small extent.
Mean Transit Times
With only one exception in 18 pairs of curves, mean transit times for water were the same or slightly shorter than for iodoantipyrine. Similarly, in four of five pairs, mean transit times for water were shorter than for labeled antipyrine. The differences in the tails of the curves (Figs, 3 and 4) are the main cause of this, the I-Ap line having a higher and more curved tail. In spite of the higher tails and higher values of t̄, the recoveries of 125I at flows greater than 1 ml · g−1 · min−1 were closer to 100% than were those for THO.
For those 17 experiments in which the recovery of tracer exceeded 75%, the ratio of t̄T/t̄AP averaged 0.939 (sd, 0.043). Since intravascular and intratubing volumes contributed almost a third to the total transit time, it may be more pertinent to consider the ratios of the extravascular transit time– (t̄T − t̄alb)/(t̄Ap − t̄alb). From the values for those three sets of curves for which all three tracers were present and for which recoveries were greater than 75% (C-1, C-2, and C-3), the average ratio was 0.935 (sd, 0.066). One can make the same calculation for the other experiments by making the approximate assumption that t̄′alb is l/3(t̄T + t̄Ap)/2.0 and neglecting the contribution of t̄RBC. Then, still considering only those sets of data with recoveries of 75% or better, the average corrected ratios are: (t̄T − t̄′alb)/(t̄131I-Ap − t̄′alb), 0.88 (n = 3; sd, 0.06); (t̄T − t̄alb)/(t̄14C-Ap − t̄′alb), 0.99 (n = 3; sd, 0.04); (t̄T − t̄′alb)/(t̄125I-Ap) − t̄′alb), 0.90 (n= 11; sd, 0.05). These corrected ratios might be considered to represent the ratios of the extravascular volumes of distribution if both indicators were flow limited over the entire range of flows and if both had the same volume of distribution in erythrocytes. From only the seven pairs of curves at high flows, the ratios t̄T/t̄I-Ap averaged 0.92 (sd, 0.03), and, although no albumin curves were simultaneously recorded, the mean ratio of extravascular transit times (t̄T − t̄′alb)/(t̄I-Ap − t̄′alb) was 0.88 (sd, 0.01). If all these substances are flow limited in their washout, then the data suggest either that I-Ap has about a 10% larger volume of distribution than does water in the dog heart or that the volume of distribution of I-Ap in erythrocytes is much less than the water content (see Discussion).
14C-labeled antipyrine had consistently shorter transit times than I-Ap. For the three sets of curves whose recoveries were 89% or better (E-3, E-4, and E-5), the ratios t̄14C-Ap/t̄I-Ap averaged 0.92 (range, 0.90 to 0.95). But there was no apparent difference between 14C-Ap and THO transit times, which is in accordance with early comparisons of steady-state volumes of distribution (1) and supports the use of 14C-Ap or 3H-Ap as indicators of body water spaces. As expected from their mean transit times, the tails of THO and 14C-Ap curves were quite similar (Fig. 3).
Discussion
This study strongly suggests that, in these isolated blood-perfused dog hearts, 125I-Ap is flow limited for flows up to two to three times normal. This is supported by: (1) the superimposability of curves of H*(t), obtained at various flows, plotted against the volume of blood that has passed through the organ from the time of indicator introduction (Fig. 1); and (2) the marked similarity of 125I-Ap and THO coronary sinus dilution curves at high flows, when the differences in diffusion coefficients would be most likely to show up as a diffusional resistance to I-Ap washout. In contrast, the I-Ap and THO curves differed primarily at low flows when, we believe, the higher diffusibility of THO is becoming evident as substantial diffusion parallel to the flow axis or between inflow and outflow vessels. The free diffusion coefficients for small solutes in dilute solution are in inverse proportion to the square roots of their molecular weight:
| (7) |
However, in tissues where the greatest impedance to diffusion probably occurs, the mobilities of the two substances may not differ as much as their free diffusion coefficients do because antipyrine is soluble in lipid as well as being highly soluble in water. I-Ap and 14C-Ap differ in their molecular weights and may also differ in their steady-state volume of distribution (18) because of the possible differences in aqueous and lipid solubilities and in pKα'.
Incomplete recoveries, most marked at low perfusion rates, are probably due to the arbitrary termination of the experimental period. This interval may be sufficient for total recovery at high flows but not for low flows, although collection periods were as long as 540 seconds (E-2 and E-1). Inhomogeneity of distribution and of flow, if considerable, will contribute markedly to this incomplete recovery as well when the collection time is relatively shortened at low flows.
From the recorded dilution curves one can calculate a mean transit time volume, V:
| (8a) |
| (8b) |
which is equivalent to the classic Stewart-Hamilton volume in which Fi is flow of traced mother substance. Hct is hematocrit value, λR is the indicator steady-state partition coefficient between erythrocytes and plasma, and (1 − Hct + λRI-Ap · Hct)F is the flow of mother fluid (plasma plus some fraction of the erythrocytes) in which I-Ap is distributed in the blood. The equation is based on the existence of rapid and continuous equilibration between plasma and erythrocytes. V should therefore be the volume of distribution, defined as the mass of indicator contained in the organ during indicator steady state divided by the plasma concentration. λRT is erythrocyte water divided by plasma water or 0.65/0.94. For water, the calculation of flow is quite direct–for example, when the hematocrit value is 40%, the flow of water is [0.94(1.0 − 0.40) + 0.65 × 0.40)]F or 0.82F.
The flows, F/W, listed in Table 1 are blood flow divided by the mass of the ventricular plus atrial myocardium. The nonmuscular parts of the preparation (great vessels, parts of the pericardium, adventitia around vessels, parts of pulmonary veins, lung roots, and trachea) comprised 20.6% (n = 27; sd, 4.5) of the total heart weight after 5 to 7½ hours of perfusion.
For the five final dilution curves of the five isolated-heart experiments, the myocardial weight (W) and the weight of the whole heart (W′) were measured directly and are given in Table 3. The water contents were obtained by drying. From the tracer experiments, we have data on flows and mean transit times of water and albumin; as Goresky et al. have emphasized, the mean transit time of erythrocytes is also required to calculate the mean-transit-time-volume for water. Following Goresky et al. (20), Δt̄, the difference between t̄T and the appropriate composite reference tracer is:
TABLE 3. Mean Transit-Time Volumes for Water (T).
| Experiments | |||||
|---|---|---|---|---|---|
| D-4 | E-5 | C-3 | A-4 | B-4 | |
| W (g myocardium) | 74.7 | 97.5 | 55.3 | 55.6 | 64.2 |
| W′ (g whole heart) | 90.8 | 130.2 | 76.7 | 67.3 | 72.4 |
| F (ml blood/min) | 59 | 77 | 97 | 140 | 175 |
| Hct (%) | 49 | 35 | 58 | 39 | 33 |
| FT (ml H2O/min)* | 47 | 64 | 79 | 116 | 148 |
| t̄T (min) † | 1.58 | 1.50 | 0.77 | 0.73 | 0.52 |
| t̄alb (min) † | 0.60 | 0.54‡ | 0.23 | 0.25‡ | 0.18‡ |
| Vw (ml H2O/W) | 0.798 | 0.761 | 0.769 | 0.804 | 0.824 |
| Vw′˙ (ml H2O/W′) | 0.777 | 0.724 | 0.746 | 0.788 | 0.801 |
| 1.02 (FTΔt̄)/WVw§ | 0.81 | 0.86 | 0.97 | 1.30 | 0.96 |
| 1.02 (FTΔt̄)/W′Vw′§ | 0.68 | 0.68 | 0.72 | 1.08 | 0.88 |
FT = F[αRBC (1 − Hct) + αp Hct]; αp = 0.94 ml H2O/ml plasma and αRBC = 0.65 ml H2O/ml erythrocytes.
Estimated.
Δt̄ is defined in equations 9a, b, and c.
Factor 1.02 accounts for water content of blood (0.03 ml/g) trapped in small vessels (19).
| (9a) |
| (9b) |
in which αRBC and αp are the fractional water contents (ml/ml) of erythrocytes and plasma and λRT is by definition αRBC/αp. Lacking the experimental values of t̄RBC, we have taken it to be 0.90t̄alb, reducing the formula to:
| (9c) |
From the present data, the fraction in the parentheses is 0.96 to 0.98. With the water flow, FT, as defined in equation 8, the product FT · t̄/W is the mean-transit-time-volume (ml/g) for labeled water in these hearts. Using a 2% correction to account for the water contained in the 3% of blood trapped in the extirpated heart, the ratios of calculated to measured myocardial and total heart water are given in the last two rows of Table 3 and show that the mean-transit-time-volume corresponds more closely to the myocardial water content, VW, than to the water content of the whole heart, VW′.
There is much more variation in these mean-transit-time-volumes than in water-content values estimated by weighing and drying another series of perfused hearts.3 Nevertheless, this result is satisfactory in view of the expected inaccuracies in estimation of mean transit times and in the approximations to the missing data on t̄alb. Thus it appears reasonable to attempt to use mean-transit-time-volume as a measure of the volume of distribution of water in the heart, particularly at higher flows.
A secondary point to be made is that iodoantipyrine apparently has a slightly larger mean transit time in the dog heart than has either water or 14C-labeled antipyrine. The t̄ values can be translated into relative volumes of distribution by using the formula derived by Chinard et al. (21):
| (10a) |
We do not have information on λRI-Ap and therefore cannot use equation 10a to calculate VI-Ap/VT. On the other hand, if one assumes that VI-Ap/VT is the same as λRI-Ap/λRT (that is, the relative volumes of distribution are the same in heart as in erythrocytes), then one can calculate the ratio from the experimental data.
| (10b) |
By equation 10b, the ratios VI-Ap/VT averaged 1.10 (n = 18; sd, 0.08) for the data of Table 1.
Traditionally (1), however, we have considered antipyrine to have the same volume of distribution as does water. If it also were true that VI-Ap/VT were 1.0, then we could calculate λRI-Ap by another manipulation of equation 10a:
| (10c) |
Using equation 10c gives an average λRI-Ap of 0.57 (n = 18; sd, 0.10). This unexpectedly low value is what would be required to explain the difference between t̄T and t̄I-Ap and certainly must be questioned. Proper resolution of the problem requires experiments to measure both VI-Ap, and λRI-Ap directly.
Ordinary antipyrine, 14C-Ap, behaves much as expected: t̄14C-Ap was nearly the same as t̄T. Because, according to Soberman et al. (1) water and antipyrine have the same volumes of distribution in erythrocytes, so also should 14C-Ap and 3H2O. The ratios of volumes of distribution in the heart are therefore in proportion to t̄14C-Ap/t̄T. These ratios were close to unity (Table 1), which is a little less than the measured values of 1.04 found by Soberman et al. (1) (two observations) and by Krasnow et al. (4) (n = 12; sd, 0.13). Since the partition coefficient for water in heart muscle should be the water content of the heart (including blood contained in capillaries) divided by the water content of blood, it should be hematocrit-dependent, as has been noted for xenon (22). At a hematocrit value of 40%, using our value of 0.76 ml/g for normal hearts, λRT as 0.65/0.94, blood density, ρ, as 1.050, and plasma water as 0.94 ml/g, the partition coefficient, λT, would be 0.76 ρ/0.94 (1 − Hct + λRT · Hct) or 1.03. The value for λT would be about 4% higher in our isolated hearts after a few hours of perfusion. The value for λT of 1.03 is not to be compared with the value of 0.691 ml/g (n = 17; sd, 0.054) given by Renkin (9) for the water content of vasodilated hindlegs of dogs; his value should be compared with our estimate of heart water of 0.76 ml/g. Neither value should be used as a partition coefficient for either antipyrine or water.
A similar numerical derivation of λI-Ap cannot be made because λRI-Ap is not known. We would expect λ14C-Ap to be nearly identical to λT, but this too needs to be tested, especially in view of Meschia's observation (8) that perhaps 1% more antipyrine is taken up by sheep erythrocytes than is predicted from the water content, while Effros and Chinard (18) observed a 10% excess in dog erythrocytes. However, if the values for λRI-Ap and λI-Ap in the heart are similar to those for water, then it seems reasonable that values of 1.0 and 1.04 for λI-Ap were used by one of us (6) and by Krasnow et al. (4) for the estimation of coronary blood flow.
One of the problems of the isolated-heart preparation is the heterogeneity of flow, in particular the low flow to the great vessels, portions of the pericardium, and the ligated lung roots. These regions were not included in the heart weight in our previous study (6); even so, the estimates of flow per unit volume obtained from the externally monitored washout curves were very close to the actual measured flow divided by the heart weight (atria plus ventricles), thereby suggesting that a very small amount of the I-Ap entered the poorly perfused portions and made little contribution to the washout curves, except perhaps to influence the shape of the tails. This conclusion also is suggested by the observation that values of 1.02 (FTΔt̄/WVw) were higher (closer to unity) than were values of 1.02 (FTΔt̄/W′Vw′) as shown in Table 3. That some did enter is suggested by the observation that the tails of the curves were prolonged by slow washout after 95 to 97% of the indicator had emerged (see Figure 6, left lower panel of reference 6).4 Accordingly, semilog plots of the washout curves of Figure 1 and of the venous dilution curves (Figs. 3 and 4) show upward concavity, which is probably best explained by a heterogeneity of flow.
The comparisons of THO and I-Ap would be most convincing if the whole range of flows had been encompassed in each animal experiment; unfortunately, only high flows were used in experiments A and B while only low to moderate flows were used in experiments D and E. Experiment C was designed to test reproducibility of results at one flow. In these experiments, the experimental procedure was the same for low and high flows, and yet systematic differences were observed in the results. The abnormalities of the low-flow experiments also were seen in the first set of experiments in which washout was externally monitored. Moreover, the differences seen in THO curves at high and low flows also have been observed with xenon (17).
The change of shape with diminished flow also is compatible with expectations based on either a model for the exchange of highly diffusible substances in the heart which permits varying degrees of countercurrent diffusional exchange, or the model proposed by Perl and Chinard (23) which allows increased source-to-sink and sink-to-source diffusion functionally in parallel with the convective flow. These diffusional exchanges also may explain the lower recoveries for water in comparison to I-Ap at higher flows, more THO than I-Ap being “lost” into the poorly perfused nonmuscular parts of the preparation or retained for a prolonged time by the countercurrent exchange. Such retention is the corollary of diffusional shunting and should be most marked with those curves showing the highest values of hT(tp)/hAp(tp). These observations are still pertinent when one considers only curves for which the recovery was greater than 80% and flow less than 1.9 ml · g−1 · min−1. In accordance with the free diffusion coefficients, THO curves had higher peaks than did antipyrine curves, the difference being more with I-Ap than with 14C-Ap. At the tails, the antipyrine venous dilution curve was higher than the THO curve, the 14C-Ap curve being relatively closer to the THO curve than was the I-Ap curve. The 3% or so free I− with I-Ap clearly contributes to the prolonged tails because I− washout is diffusion limited even at lower flows in muscle (24). If the appearance of THO in the venous outflow preceded that of 14C-Ap or I-Ap, one would be quite confident of the existence of source-to-sink, arterial-to-venous, diffusional shunt.
Because of the method of discrete sampling, it was not possible to discern an earlier arrival of THO, but its peaks may have been slightly earlier. This lack of definite precedence does not preclude the possibility of the diffusional transport but does point up the fact that the experimental method is inadequate to prove the existence of a small diffusional shunt which, in these experiments, must certainly contribute less than 3% to the area of the curves, even though the values of hT(tp)/hAp(tp) may be 10 to 20% greater than unity. However, it is very likely that source-to-sink diffusion of I-Ap is extremely small, because the curves are not monoexponential but do show similar shapes at various flows (Figure 1, bottom, is the best illustration of this), and therefore, it is unlikely that the longitudinal diffusion of either water or I-Ap can predominate over convection. The fact that these curves have shapes not too different from monoexponential does not imply the presence of much or even of any longitudinal diffusion, because washout curves from simple models of a single capilary tissue region (23, 25) exhibit apparently monoexponential downslopes even when this diffusional component is absent. Anatomically, a small diffusional shunt for water seems reasonable because intercapillary distances in the heart are much shorter than the intracapillary length for convective transport. At higher flows, one would expect convective transport to predominate; hence; the distribution of transit times of the time and amount of 3H2O and I-Ap to the venous outflow would be expected to be similar, as was observed.
Acknowledgments
We express our sincere appreciation to the following for their assistance in the acquisition of data and preparation of this manuscript: Donald C. Gustafson, Mrs. Carolyn Kath, Thomas J. Knopp, Allen R. Wanek, Charles S. Field, Gary Shapiro, Mrs. Jean Frank, and Mrs. F. Jane Irving.
This investigation was supported in part by U. S. Public Health Service Research Grants HE-9719 and FR-7 from the National Heart Institute. Dr. Yipintsoi is the recipient of Special Fellowship HE43128 from the National Heart Institute. Dr. Bassingthwaighte is the recipient of Career Development Award K3 KE22.649 from the National Institutes of Health.
Footnotes
Universal transducing cell, model UC2, with load cell accessory UL4-0.5. Statham Instruments, Inc., Oxnard, Calif.
Kindly supplied by Pharmacia Laboratories, Inc., Piscataway, N. J.
By weighing and drying hearts from other experiments at 75°C for 48 hours, the water content of myocardium was found to be about 0.76 ml/g of tissue (n = 10; sd, 0.01) for normal dog hearts and 0.79 ml/g (n = 29; sd, 0.02; maximum, 0.82) after 5 to 7½ hours of perfusion with blood in a nonworking state. In the perfused hearts, the water content of the nonmuscular parts was 0.601 ml/g (n = 27; sd, 0.101) and the water content of the whole heart (myocardium plus nonmuscular parts) was 0.751 ml/g (n = 29; sd, 0.021).
in which Wi is the relative weight of tissue i, fi is compartment flow (ml · g−1 · min−1), F is total flow (ml · g−1 · min−1), ρi is specific gravity (g/ml) in tissue compartment i, t is time (min), and λi is the tissue-blood partition coefficient for compartment i. This revision shows that MS(E1 + E2)/Cp is 1.0, as is expected.
References
- 1.Soberman R, Brodie BB, Levy BB, Axelrod J, Hollander V, Steele JM. Use of antipyrine in the measurement of total body water in man. J Biol Chem. 1949;179:31. [PubMed] [Google Scholar]
- 2.Talso PJ, Lahr TN, Spafford N, Ferenzi G, Jackson HRO. Comparison of the volume of distribution of antipyrine, N-acetyl-4-amino-antipyrine, and I131-labeled 4-iodo-antipyrine in human beings. J Lab Clin Med. 1955;46:619. [PubMed] [Google Scholar]
- 3.Kay M, Jones AS, Smart R. Use of tritiated water, 4-aminoantipyrine and N-acetyl-4-amino-antipyrine for the measurement of body water in living pigs. Brit J Nutr. 1966;20:439. doi: 10.1079/bjn19660045. [DOI] [PubMed] [Google Scholar]
- 4.Krasnow N, Levine HJ, Wagman RJ, Gorlin R. Coronary blood flow measured by I131 iodo-antipyrine. Circ Res. 1963;12:58. doi: 10.1161/01.res.12.1.58. [DOI] [PubMed] [Google Scholar]
- 5.Rudolph AM, Heymann MA. Validation of the antipyrine method for measuring fetal umbilical blood flow. Circ Res. 1967;21:185. doi: 10.1161/01.res.21.2.185. [DOI] [PubMed] [Google Scholar]
- 6.Bassingthwaighte JB, Strandell T, Donald DE. Estimation of coronary blood flow by washout of diffusible indicators. Circ Res. 1968;23:259. doi: 10.1161/01.res.23.2.259. [DOI] [PMC free article] [PubMed] [Google Scholar]
- 7.Brodie BB, Axelrod J, Soberman R, Levy BB. Estimation of antipyrine in biological materials. J Biol Chem. 1949;179:25. [PubMed] [Google Scholar]
- 8.Meschia G. Automatic analysis of antipyrine. The 1964 Technicon International Symposium; Chauncey, N. Y.. [Google Scholar]
- 9.Renkin EM. Effects of blood flow on diffusion kinetics in isolated, perfused hindlegs of cats: A double circulation hypothesis. Amer J Physiol. 1955;183:125. doi: 10.1152/ajplegacy.1955.183.1.125. [DOI] [PubMed] [Google Scholar]
- 10.Crone C. Permeability of brain capillaries to non-electrolytes. Acta Physiol Scand. 1965;64:407. doi: 10.1111/j.1748-1716.1965.tb04198.x. [DOI] [PubMed] [Google Scholar]
- 11.Prentice TC, Siri W, Berlin NI, Hyde GM, Parsons RJ, Joiner EE, Lawrence JH. Studies of total body water with tritium. J Clin Invest. 1952;31:412. doi: 10.1172/JCI102624. [DOI] [PMC free article] [PubMed] [Google Scholar]
- 12.Johnson JA, Cavert HM, Lifson N. Kinetics concerned with distribution of isotopic water in isolated perfused dog heart and skeletal muscle. Amer J Physiol. 1952;171:687. doi: 10.1152/ajplegacy.1952.171.3.687. [DOI] [PubMed] [Google Scholar]
- 13.Munck O, Andersen AM. Decomposition of iodine-labelled antipyrine. Scand J Clin Lab Invest. 1967;19:256. doi: 10.3109/00365516709090633. [DOI] [PubMed] [Google Scholar]
- 14.Mahin DT, Lofberg RT. Simplified method of sample preparation for determination of tritium, carbon-14, sulphur-35 in blood or tissue by liquid scintillation counting. Anal Biochem. 1966;16:500. [Google Scholar]
- 15.Patterson MS, Greene RC. Measurement of low energy beta-emitters in aqueous solution by liquid scintillation counting of emulsions. Anal Chem. 1965;37:854. doi: 10.1021/ac60226a017. [DOI] [PubMed] [Google Scholar]
- 16.Bassingthwaighte JB, Chinard FP, Crone C, Lassen NA, Perl W. Terminology for indicator dilution methods. In: Crone C, Lassen NA, editors. Capillary Permeability, Alfred Benzon Symposium II. Copenhagen: Ejnar Munksgaard; 1970. in press. [Google Scholar]
- 17.Bassingthwaighte JB, Yipintsoi T. Emergence function: Effects of flow and capillary-tissue exchange in the heart. In: Crone C, Lassen NA, editors. Capillary Permeability, Alfred Benzon Symposium II. Copenhagen: Ejnar Munksgaard; 1970. in press. [Google Scholar]
- 18.Effros RM, Chinard FP. In vivo pH of the extravascular space of the lung. J Clin Invest. 1969;48:1983. doi: 10.1172/JCI106164. [DOI] [PMC free article] [PubMed] [Google Scholar]
- 19.Myers WW, Honig CR. Number and distribution of capillaries as determinants of myocardial oxygen tension. Amer J Physiol. 1964;207:653. doi: 10.1152/ajplegacy.1964.207.3.653. [DOI] [PubMed] [Google Scholar]
- 20.Goresky CA, Cronin RFP, Wangel BE. Indicator dilution measurements of extravascular water in the lungs. J Clin Invest. 1969;48:487. doi: 10.1172/JCI106006. [DOI] [PMC free article] [PubMed] [Google Scholar]
- 21.Chinard FR, Thaw CN, Delea AC, Perl W. Intrarenal volumes of distribution and relative diffusion coefficients of monohydric alcohols. Circ Res. 1969;25:343. doi: 10.1161/01.res.25.3.343. [DOI] [PubMed] [Google Scholar]
- 22.Andersen AM, Ladefoged J. Partition coefficient of 133xenon between various tissues and blood in vivo. Scand J Clin Lab Invest. 1967;19:72. doi: 10.3109/00365516709093483. [DOI] [PubMed] [Google Scholar]
- 23.Perl W, Chinard FP. A convection-diffusion model of indicator transport through an organ. Circ Res. 1968;22:273. doi: 10.1161/01.res.22.2.273. [DOI] [PubMed] [Google Scholar]
- 24.Lindbjerg IF. Disappearance rate of 133xenon, 4-iodo antipyrine-131I, and 133I from human skeletal muscles and adipose tissue. Scand J Clin Lab Invest. 1967;19:120. [Google Scholar]
- 25.Bassingthwaighte JB, Knopp TJ, Hazelrig JB. A concurrent flow model for capillary-tissue exchanges. In: Crone C, Lassen NA, editors. Capillary Permeability, Alfred Benzon Symposium II. Copenhagen: Ejnar Munksgaard; 1970. pp. 60–80. [Google Scholar]