

Abstract
Introduction
The purpose of this study is to evaluate apparent diffusion coefficient (ADC) maps to distinguish anti-vascular and anti-tumor effects in the course of anti-angiogenic treatment of recurrent high-grade gliomas (rHGG) as compared to standard magnetic resonance imaging (MRI).
Methods
This retrospective study analyzed ADC maps from diffusion-weighted MRI in 14 rHGG patients during bevacizumab/irinotecan (B/I) therapy. Applying image segmentation, volumes of contrast-enhanced lesions in T1 sequences and of hyperintense T2 lesions (hT2) were calculated. hT2 were defined as regions of interest (ROI) and registered to corresponding ADC maps (hT2-ADC). Histograms were calculated from hT2-ADC ROIs. Thereafter, histogram asymmetry termed “skewness” was calculated and compared to progression-free survival (PFS) as defined by the Response Assessment Neuro-Oncology (RANO) Working Group criteria.
Results
At 8–12 weeks follow-up, seven (50%) patients showed a partial response, three (21.4%) patients were stable, and four (28.6%) patients progressed according to RANO criteria. hT2-ADC histograms demonstrated statistically significant changes in skewness in relation to PFS at 6 months. Patients with increasing skewness (n=11) following B/I therapy had significantly shorter PFS than did patients with decreasing or stable skewness values (n=3, median percentage change in skewness 54% versus −3%, p=0.04).
Conclusion
In rHGG patients, the change in ADC histogram skewness may be predictive for treatment response early in the course of anti-angiogenic therapy and more sensitive than treatment assessment based solely on RANO criteria.
Keywords: Recurrent high-grade glioma, Anti-angiogenic therapy, DWI-MRI, ADC histograms, Skewness
Introduction
Essentially all patients suffering from high-grade glioma (HGG) develop recurrent or progressive disease following first-line standard therapy including surgery, radiotherapy, and concomitant/adjuvant chemotherapy [1, 2].
Bevacizumab, a humanized monoclonal antibody binding to and inhibiting the vascular endothelial growth factor (VEGF), has shown efficacy as a single anti-angiogenic agent or in combination with chemotherapy (e.g., irinotecan) in recurrent HGG (rHGG) [3]. Although bevacizumab treatment results in high radiographic response rates with rapidly decreasing contrast-enhanced tumor parts [3], response assessment with standard Macdonald criteria [4] has become unreliable during anti-angiogenic therapy. The rapidly seen decrease in contrast enhancement results in large part from restoration of abnormally high blood–brain barrier permeability, often accompanied by tumor edema reduction. Thus, anti-angiogenic treatment makes it difficult to distinguish between anti-vascular and true anti-tumor effects [5].
Addressing the issue of a more precise tumor response assessment, new standardized Response Assessment Neuro-Oncology (RANO) Working Group criteria for HGG were recently proposed [5]. The RANO criteria also consider non-enhanced T2/fluid-attenuated inversion recovery (FLAIR) sequences in addition to the Macdonald criteria. T2/FLAIR signal abnormality, however, is a combination of infiltrating tumor cells, edema, gliosis, and treatment-related leukoencephalopathy [6] that is also problematic for reliable assessment of true tumor treatment response.
Diffusion-weighted MRI (DW-MRI) is able to yield ultrastructural information on cellular density and properties of the extracellular matrix [7] and has been linked to lesion aggressiveness and tumor response [8]. DW-MRI measures the effective displacement of water molecules allowed to migrate for a given time. In a large extracellular volume, which may be caused by fluid accumulation (e.g., tumor edema), the apparent diffusion coefficient (ADC) is high. In contrast, hypercellularity (e.g., compact tumor cells) restricts diffusion by decreasing the extracellular volume, thus, giving low ADC values. Therefore, changes in DW-MRI may constitute an effective, highly reproducible and early predictive biomarker for both vascular disruptive drugs and apoptosis-inducing therapies [9-12]. Mean ADC decrease and pre-therapeutic ADC values were reported to be predictive for anti-angiogenic therapy response [13, 14]. Important to note is the fact that HGG are very heterogeneous tumors with different regions of cellularity and levels of malignant transformation within the tumor and that the ADC represents to some degree cellularity and/or edema in a lesion [15].
This retrospective study aimed to evaluate ADC changes during anti-angiogenic therapy in certain HGG tumor regions. For this reason, ADC gray scale value distribution was analyzed and expressed in histograms. The study hypothesis was that anti-angiogenic therapy induces alterations in tissue composition reflected in characteristic changes in histogram shape and skewness. The study also aimed to analyze whether these ADC histogram changes could serve as an early predictive marker for therapy response in correlation with progression-free survival (PFS) at 6 months.
Patients and methods
Patient population
(Table 1) Retrospective data acquisition and evaluation was approved by the local ethics committee. From 2008 to 2010, a total of 14 patients with rHGG were treated biweekly with bevacizumab 10 mg/kg and irinotecan 125 or 340 mg/m2 (depending on the use of enzyme-inducing anti-epileptic drugs) according to the protocol of Vredenburgh et al. [3].
Table 1.
Clinical and histopathological characteristics of the patient population
| Pat | Sexa | Ageb | Locationc | Initial diagnolis |
No. rec.f | Treatment course prior to B/I therapyg |
Before B/I therapy |
PFS/OS analysis |
|||||
|---|---|---|---|---|---|---|---|---|---|---|---|---|---|
| TU typed | KPSe | Surgeryh | Radiationi | Chemotherapyj | TU typed | KPSe | PFSk | OSl | |||||
| 1 | M | 60 | R, F-P | AA III | 100 | 1 | (0) SB | (0) 60 Gy | (0) TMZ | sGBM IV (MRI) | 60 | 4.4 | 16.4 |
| 2 | F | 37 | R, T | GBM IV | 90 | 2 | (0) MTR (1) MTR, (2) MTR |
(0) 60 Gy | (0) TMZ (1) TMZ |
GBM IV | 70 | 4.93 | 81.9 |
| 3 | M | 66 | R, T | GBM IV | 90 | 3 | (0) MTR (1) MTR, (3) MTR |
(0) 60 Gy | (0) TMZ (1) SUT, (2) TMZ |
GBM IV | 60 | 2.83 | 45.7 |
| 4 | M | 55 | R, F | GBM IV | 90 | 2 | (0) PR (1) MTR |
(0) 60 Gy (1) Booster, (2) WBR |
(0) TMZ (1) TMZ (2) lip.Cyt-Ara |
GBM IV | 70 | 1.47 | 31.2 |
| 5 | F | 69 | R, T | GS IV | 90 | 2 | (0) MTR | (0) 60 Gy | (0) TMZ (1) SUT |
GS IV | 50 | 4.47 | 23.3 |
| 6 | M | 37 | R, F-T | A II | 100 | 2 | (0) MTR (1) MTR |
(0) 60 Gy | - (1) Caelyx |
sGBM IV (H) | 60 | 7.6 | 113.6 |
| 7 | M | 33 | L-R, F | OA II | 100 | 5 | (0) PR (1) MTR, (4) MTR |
(0) 60 Gy (1) 60 Gy |
- (3) PCV, (4) TMZ |
sGBM IV (H) | 70 | 3.07 | 169.5 |
| 8 | F | 62 | L, P | AA III | 60 | 1 | (0) PR | (0) 60 Gy | (0) TMZ | sGBM IV (MRI) | 50 | No progress | Alive |
| 9 | M | 60 | L, P | GBM IV | 100 | 2 | (0) MTR | (0) 60 Gy | (0) TMZ (1) TMZ |
GBM IV | 70 | 5.53 | Alive |
| 10 | F | 46 | L, F | ODG III–IV | 90 | 3 | (0) PR (1) MTR, (2) MTR |
- (1, 2) 60 Gy |
(0) PCV (1) TMZ |
sGBM IV (H) | 80 | 10.2 | 50.4 |
| 11 | M | 27 | R, F | GBM IV | 100 | 2 | (0) PR | (0) 60 Gy | (0) TMZ (1) TMZ |
GBM IV | 100 | 4.77 | 22.6 |
| 12 | M | 44 | R, F | AA III | 90 | 3 | (0) PR | (0) 60 Gy | (0) PCV (1) TMZ, (2) TMZ |
sGBM IV (MRI) | 90 | No progress | Alive |
| 13 | F | 82 | R, T-F-P | A II | 90 | 2 | (0) PR (1) MTR |
(0) 60 Gy | (0) TMZ (1) TMZ |
sGBM IV (MRI) | 60 | 5.47 | 72.5 |
| 14 | M | 63 | L, P | GBM IV | 80 | 2 | (0) PR | (0) 60 Gy | (0) TMZ (1) SUT |
GBM IV | 80 | 1.9 | 18.2 |
Sex: M male, F female
Age at initial diagnosis
Tumor location: L left hemisphere, R right hemisphere, F frontal, P parietal, O occipital, T temporal, BS brainstem
Tumor type (histology at initial diagnosis or H, histology/MRI, MRI diagnosis before B/I therapy) + WHO grading—GBM glioblastoma multiforme IV, GS gliosarcoma IV, AA anaplastic astrocytoma III, A fibrillary astrocytoma II, ODG oligodendroglioma II or III, OA oligoastrocytoma II or III, sGBM IV secondary GBM (H histology, MRI MRI diagnosis)
Karnofsky performace status (KPS) at initial diagnosis and before B/I therapy
Number of recurrences during treatment course
Treatment course: (0) primary tumor, (1) 1st recurrence, (n) no recurrence until death/evaluation
Surgery: MTR macroscopic total resection, PR partial resection, SB stereotactic biopsy
Radiation: extended field radiation with cumulative dose in Gray (Gy); WBR whole brain radiation with cumulative dose in Gray (Gy)
TMZ temozolomide, PCV procarbazine, lomustine, vincristine, SUT sunitinib (according to SURGE 01-07 study protocol); caelyx® anthracyclin, lip. Cyt-Ara liposomal cytosin arabinoside (Depocyte ®)
Progression-free survival, time in months from commencement of B/I treatment to progression in T1 and T2 MRI sequences
Overall survival (OS), time in months from first tumor occurrence to death
According to disease course, rHGG patients were differentiated in six histologically confirmed cases of primary glioblastoma multiforme (GBM), one gliosarcoma, and seven secondary GBMs (of these, three progressions were histologically confirmed and four were diagnosed following MRI). The study cohort consisted of five female and nine male patients. At initial diagnosis, mean age was 53 years, and Karnofsky performance status (KPS) ranged between 60% and 100% (mean, 90%). At commencement of anti-angiogenic treatment, KPS ranged between 50% and 100% (mean, 70%). Nine patients showed right hemispheric and five patients showed left hemispheric tumor localizations (for further details on tumor localization, refer to Table 1).
At initial tumor manifestation, all 14 patients underwent surgery (five gross total and eight partial tumor resections, one stereotactic biopsy) and radiation therapy (extended tumor field, cumulative maximum dose of 60 Gy). In addition, ten patients received concomitant and adjuvant Temodal chemotherapy according to the Stupp protocol [16], and two patients received adjuvant procarbazine, lomustine, vincristine (PCV) chemotherapy.
During the course of disease and prior to bevacizumab/irinotecan (B/I) therapy, our patient cohort developed between one and five recurrences, which were treated individually with re-challenge temozolomide, sunitinib malate (Sutent® according to the SURGE 01-07 study protocol), PCV chemotherapy, anthracyclines (Caelyx®), liposomal cytosin arabinoside (Depocyt®, treatment of meningeosis gliomatosa), and re-irradiation. Patients also received steroids as clinically demanded. Ten patients were on steroids at the time of initial imaging (dose range, 4–16 mg dexamethasone daily). Four patients took steroids throughout the entire B/I treatment course; in six patients, steroid administration was discontinued during anti-angiogenic therapy. Four patients never received steroids.
Progression-free survival (PFS) was counted from the beginning of anti-angiogenic therapy to radiologic progression seen on T1 post-contrast or T2 images (RANO criteria). Mean PFS was 4.7 months and varied between 1.5 and 10.2 months. Three patients showed no progression at their 6-month follow-up (PFS6), and two were progression-free at the time of study evaluation (18.9 months and 19.9 months, respectively). Mean overall survival (OS), defined as from the date of initial diagnosis to death, was 59 months and varied between 16.4 and 169.5 months. Three patients were still alive at study evaluation (patients no. 9, 81.9 months; no. 10, 45.7 months; and no 13, 119.7 months). During B/I treatment, clinical assessment and KPS were obtained every 2 weeks. Standard MRI scans and diffusion-weighted imaging were performed every 8–12 weeks. All scans of the 14 patients were evaluable for T1 and T2 volumetry as well as for ADC map image analysis.
MR imaging
MRI studies were conducted on a 1.5-Tesla scanner (Sonata, Siemens, Erlangen, Germany) and typically included T1-weighted (repetition time (TR)=1,860 ms, echo time (TE)=4.38 ms with 1.2 mm slice thickness, 256×192 matrix), T2-weighted, fast spin echo (6,600 ms/100–110 ms, 2 mm slice thickness, 320×240 matrix) sequences, diffusion-weighted and contrast-enhanced images. Post-contrast images were acquired immediately after contrast agent injection (Omniscan, Dotarem, 0.1 mmol/kg) with comparable intervals between injection of contrast media and data acquisition.
Diffusion-weighted images (DWI) were obtained with diffusion-sensitizing gradients in three orthogonal directions, using a TR of 2,600 ms, a TE of 78 ms, FOV of 230×230 mm, slice thickness of 5 mm, a gap of 1.5 mm, matrix of 128×128, and three different b values (0, 500, and 1,000 mm2/s). Maps of apparent diffusion coefficient were automatically calculated by the MR scanner.
MRI post-processing procedures
Contrast-enhanced lesions in T1-weighted images and hyperintense T2 (hT2) lesions were segmented and the volumes were calculated using a semi-automated active contour method (ITK-SNAP 2.0) called snake evolution. “Snake” is a 3-D description of a closed curve or surface that represents a segmentation. The snake starts as a very rough estimate of the anatomical structure of interest and continues to a close approximation of the structure. Evolution of the snake is governed by a mathematical equation describing the velocity of every point on the snake at any particular time. The velocity of each point depends on the shape of the snake and the intensities of the image in the neighborhood of the point. This segmentation tool demonstrated excellent reliability and high efficiency of 3D segmentation [17]. Our response evaluation aimed to calculate the absolute tumor volumes because tumor volume calculations, but not linear or two-dimensional measurements, proved to be an accurate predictor of survival in patients with recurrent malignant glioma [18]. For exact MRI response assessment during B/I therapy, the calculated T1 and hT2 volumes were analyzed according to Macdonald [4] and RANO criteria [5]. Because bevacizumab treatment has been reported to induce diffuse gliomatotic tumor progression [19], the hyperintense T2 volumes served as a basis for further ADC analysis. The segmented T2 hyperintense (hT2) volumes served as regions of interest (ROI) and were registered to the corresponding ADC maps (hT2-ADC) by applying an affine transformation using a mutual information approach with 3D Slicer Software [20, 21]. This provided information about the ADC gray value distribution within an hT2 volume, and the mean ADC was calculated. To quantify and analyze the heterogeneous ADC distribution within certain tumor regions, we calculated histograms of the hT2-ADC ROIs.
Statistics
For comparison of the hisatogram shapes, a statistical parameter called skewness was used. The skewness γ is a measure of the graph asymmetry of discrete functions and can be calculated as
where n represents the number of values, xi the i-th value, and μ the sample mean. Qualitatively, positive skewness indicates that the majority of the values lie to the left of the mean, while negative skewness indicates that the majority of the values lie to the right side of the mean (Fig. 1).
Fig. 1.

Skewness. Positive skewness indicates that the majority of the values lie to the left of the mean; negative skewness indicates that the majority of the values lie to the right of the mean
The skewness of the hT2-ADC histograms was calculated for each baseline and follow-up MRI scan. Subsequently, the change in skewness in percentage was analyzed. An increase in skewness indicated that the skewness values became more positive at the follow-up scan as compared with the baseline MRI. A decrease in skewness means the values became more negative at follow-up.
The statistical calculations were based on a median survival of 6 months for rHGG and previous bevacizumab response rates [3].
The patient cohort was divided into two groups according to PFS at 6 months (progressors, PFS <6 months; responders, PFS≥6 months). The statistical significance of value differences between the groups was obtained with the Mann–Whitney U Test (MWU) at a 95% significance level. A p value <0.05 was deemed to be statistically significant. Skewness accuracy in predicting failure to therapy was calculated by cross tabulation, and sensitivity and specificity values were obtained.
For evaluation of the prognostic significance of variables, progression-free survival (PFS) and PFS6 (progression-free survival at 6 months) are more reliable study endpoints than are overall survival (OS) and overall survival at 12 months because after tumor progression various salvage therapy approaches are used [22].
Analysis and statistical figures were calculated with SPSS 16.0 for Windows (SPSS Inc., Chicago, IL).
Results
T1 post-contrast and T2 volumetry
(Table 2) Median T1 contrast-enhanced tumor volume prior to B/I treatment was 16.5 cm3 (ranging from 0.6 to 105.6 cm3) as compared to 5.9 cm3 (range, 0.4 to 112.6 cm3) following 8–12 weeks of B/I treatment. According to Macdonald criteria, nine (64.3%) patients showed a partial response, four (28.6%) patients had stable disease, and one (7.1%) patient showed tumor progression. Median hT2 tumor volume prior to B/I treatment was 130.6 cm3 (range, 43.3–218.2 cm3) and 8–12 weeks after commencement of B/I treatment 122 cm3 (range, 29–258.7 cm3). According to RANO criteria, seven (50%) patients showed partial response, three (21.4%) patients, stable disease; and four (28.6%) patients, tumor progression. The three patients (nos. 3, 5, and 15; Table 2), who account for the disagreement between Macdonald and RANO criteria, developed a solely T2 hyperintense tumor progression, consistent with a gliomatotic tumor growth pattern.
Table 2.
Neuroimaging data and response assessment
| Pat. | Steroidsa |
MRI volumetry T1 post-contrast (cm3) b |
MRI volumetry T2 (cm3)b |
RANO criteriad | |||||||
|---|---|---|---|---|---|---|---|---|---|---|---|
| T | B | N | MRI-pre | MRI-2 | Δ MRI-pre–MRI-2% | Macdonald criteriac | MRI-pre | MRI-2 | Δ MRI-pre–MRI-2% | ||
| 1 | + | 7.3 | 1.8 | −75.3 | Partial response | 151.1 | 168.2 | 11.3 | Partial response | ||
| 2 | + | 68.1 | 29.3 | −57.0 | Partial response | 148.8 | 258.7 | 73.8 | Progress | ||
| 3 | + | 0.7 | 45.4 | >1,000 | Progress | 97.5 | 110.1 | 13.0 | Progress | ||
| 4 | + | 17.8 | 6.6 | −63.0 | Partial response | 105.5 | 147.0 | 39.3 | Progress | ||
| 5 | + | 12.6 | 3.5 | −72.0 | Partial response | 143 | 82.9 | −42.1 | Partial response | ||
| 6 | + | 54.1 | 5.3 | −90.1 | Partial response | 180.5 | 154.3 | −14.5 | Partial response | ||
| 7 | + | 105.6 | 6.8 | −93.6 | Partial response | 150.7 | 85.1 | −43.6 | Partial response | ||
| 8 | + | 4.4 | 2.9 | −33.9 | Stable | 107.7 | 134.0 | 24.3 | Stable | ||
| 9 | + | 32.8 | 12.3 | −62.4 | Partial response | 218.2 | 135.4 | −37.9 | Partial response | ||
| 10 | + | 39.7 | 2.5 | −93.8 | Partial response | 62.6 | 29.0 | −53.7 | Partial response | ||
| 11 | + | 17.0 | 0.9 | −94.9 | Partial response | 129.5 | 71.0 | −45.2 | Partial response | ||
| 12 | + | 11.1 | 10.1 | −9.1 | Stable | 67.6 | 53.5 | −20.9 | Stable | ||
| 13 | + | 0.6 | 0.4 | −43.0 | Stable | 131.7 | 135.8 | 3.1 | Stable | ||
| 14 | + | 16.0 | 11.5 | −28.3 | Stable | 43.3 | 62.6 | 44.6 | Progress | ||
Steroid treatment during neuroimaging: T throughout B/I treatment, B at commencement and discontinuation of B/I treatment, N never (dose range, 4–16 mg dexamethasone); MRI magnetic resonance imaging
MRI-pre MRI prior to B/I treatment, MRI 2 MRI after 8–12 weeks of B/I treatment
Macdonald criteria [4]: complete response disappearance of all contrast-enhanced tumor lesions on consecutive MRI scans and the patient is off corticosteroids and is neurologically stable or shows improvement, partial response ≥50% reduction in size of contrast-enhanced tumor lesions and the patient is on a stable corticosteroid dose compared to the baseline scan and remains neurologically stable or shows improvement, progressive disease ≥25% increase in size of contrast-enhanced tumor lesions or any new tumor on MRI scans or patient shows neurological deterioration with stable or increased corticosteroid dose, stable disease includes all other conditions
RANO criteria [5]: T2 or FLAIR sequences are included in MRI response assessment. Additionally to Macdonald criteria, complete or partial response requires stable or improved non-enhanced (T2/FLAIR) lesions. Stable disease requires stable non-enhanced (T2/FLAIR) lesions. For progression, a significant increase in non-enhanced (T2/FLAIR) lesions must be detectable
Overall tumor ADC
(Table 3) According to PFS at 6 months (PFS 6), the patient population was divided into two groups; 11 patients showed a progress at 6 months (“progressors”), and three patients showed a response or a stable disease at 6 months’ follow-up (“responders”). Overall tumor ADC for baseline and follow-up MRI scans are listed in Table 3. The median ADC value in 10−5×mm2/s for progressors was 126.5 at baseline and 112 at follow-up. By comparison, responders showed a median ADC in 10−5×mm2/s of 113.3 at baseline and 136.4 at follow-up. The median percentage change in ADC values between baseline and follow-up was −6.8% as compared with that in non-progressors with a median ADC increase of +7.9% (p=0.04, MWU test; Fig. 2).
Table 3.
Apparent diffusion coefficient; absolute and histogram skewness values
| Pat. | ADC histogram skewnessa |
ADC (10−5×mm2/s)a |
||||
|---|---|---|---|---|---|---|
| MRI-pre | MRI-2 | Δ MRI-pre–MRI-2% | MRI-pre | MRI-2 | Δ MRI-pre–MRI-2% | |
| 1 | 1.12 | 1.77 | 58 | 126.5 | 109.3 | −14 |
| 2 | 2.37 | 1.87 | −21 | 104.9 | 108.6 | 4 |
| 3 | 1.45 | 2.09 | 44 | 106.4 | 112.0 | 5 |
| 4 | 0.6 | 1.12 | 87 | 144.8 | 135.0 | −7 |
| 5 | 1.38 | 1.38 | 0.0 | 118.7 | 131.0 | 10 |
| 6 | 0.82 | 1.05 | 28 | 132.5 | 127.8 | −4 |
| 7 | 0.32 | 2.76 | 763 | 125.4 | 78.6 | −37 |
| 8 | 2.10 | 2.03 | −3 | 113.3 | 122.3 | 8 |
| 9 | 0.32 | 0.92 | 188 | 137.6 | 126.2 | −8 |
| 10 | 2.67 | 1.50 | −44 | 105.9 | 140.8 | 33 |
| 11 | 0.09 | 2.33 | >1,000 | 145.2 | 103.4 | −29 |
| 12 | 0.84 | 0.96 | 14 | 135.4 | 136.4 | 1 |
| 13 | 0.50 | 0.77 | 54 | 138.3 | 125.7 | −9 |
| 14 | 1.99 | 1.40 | −30 | 113.2 | 105.8 | −7 |
MRI-pre prior to B/I treatment, MRI-2 8–12 weeks after first B/I treatment
Δ MRI-pre–MRI-2% difference in % in ADC histogram skewness
ADC apparent diffusion coefficient, MRI magnetic resonance imaging
Fig. 2.

ADC change. ADC in progressors and non-progressors over a period of 6 months. Median change in ADC in progressors (n=11) is −6.8% (range −37.3–10.3%). Median change in ADC in non-progressors (n=3) is 7.9% (range: 0.7–33%). There is a statistically significant difference between the two groups (p=0.04)
Skewness in ADC histograms
Median skewness in progressors (PFS <6 months) prior to B/I treatment was 0.82 compared to 1.40 at follow-up, resulting in a median increase in skewness of +54%. Median skewness in responders (PFS≥6 months) prior to B/I treatment was 2.1 at baseline and 1.5 at follow-up, resulting in a decrease in skewness of −3% (Table 3). The MWU test showed the median percentage change in skewness in progressors to be significantly greater (p=0.04) than in responders (Fig. 3). In conclusion, an increase in skewness predicted early therapy failure. Cross tabulation revealed a sensitivity of 72% and a specificity of 67%.
Fig. 3.

ADC histogram skewness. ADC histogram skewness in progressors and non-progressors during a period of 6 months. Median change in skewness for progressors (n=11) is 54% (range, −30–2,548%). Median change in skewness for non-progressors (n=3) is −3% (range, −44–14%). There is a statistically significant difference between the two groups (p=0.04)
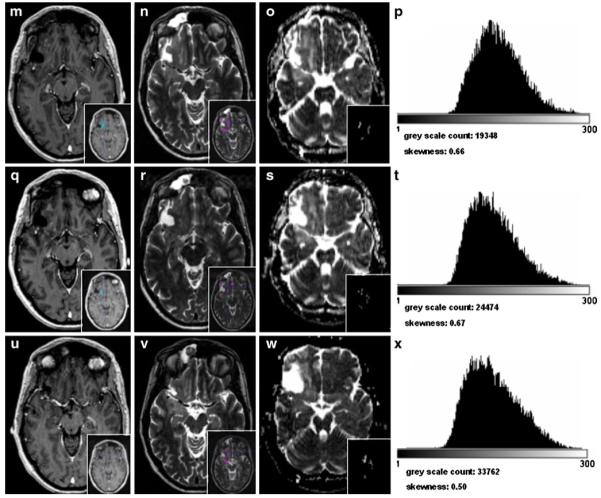
Figure 4 describes a typical hT2-ADC histogram pattern for early tumor progression. In this patient (no. 7, bifrontal GBM, WHO IV), the T1 contrast-enhanced tumor volume showed a 95% decrease 12 weeks after commencement of B/I therapy (105.6 cm3 at baseline and 6.8 cm3 at follow-up). In addition, hT2 volume showed a decrease from 150.7 cm3 to 85.1 cm3 12 weeks after starting B/I therapy (volume reduction of 44%). Using RANO criteria, this patient would be diagnosed as showing a partial response. In the subsequent disease course, the patient’s neurological condition worsened with progressive frontal lobe syndrome and seizures. The MRI scan in week 16 detected almost no contrast enhancement in T1, but hT2 volume had doubled to 169.1 cm3. ADC map histogram analysis at baseline revealed an even, uniform gray scale value distribution with hardly any asymmetry and thus a low skewness of 0.32. Twelve weeks after B/I treatment, a clear change in the shape of the histogram could be detected. The histogram shape had become slim and peaked, had shifted to the left side, and the skewness had become more positive with an increase from 0.32 to 2.76 and 3.95 in weeks 0, 12, and 16, respectively. This ADC histogram revealed the micro-structural changes during anti-angiogenic treatment. At baseline, prior to therapy, it shows the tumor volume having a very heterogeneous gray scale distribution. By contrast, 12 weeks after treatment, a homogeneous highly cellular tumor mass can be detected.
Fig. 4.

Patient no. 7 from Table 2. a, e, i, l, p, t T1 post-contrast MRI sequence, in blue: segmented T1 post-contrast volume at baseline, 12, 16, 28, 40, and 52 weeks after commencement of B/I therapy. b, f, j, m, q, u T2 MRI sequence prior to B/I treatment, in magenta: segmented T2 volume at baseline, 12, 16, 28, 40, and 52 weeks after commencement of therapy. c, g, k, n, r, v ADC map, in small; segmented T2 volume, registered to corresponding ADC maps at baseline, 12, 16, 28, 40, and 52 weeks after commencement of B/I therapy. d, h, l, o, s, w histogram of segmented T2 volume; gray scale count gives the number of gray scales for the T2 volume
Patients with stable disease or tumor response following B/I treatment show no or hardly any change in skewness in the ADC histograms. Figure 5 (patient no. 12) describes the course of a patient with a steady decrease in the T1 contrast-enhanced volume as well as in hT2 volumes until radiologic complete response after 14 cycles of B/I treatment and 36 weeks treatment duration. At baseline, the tumor is characterized by an even uniform hT2-ADC histogram shape with a low skewness of 0.84. During the course of treatment, the histogram shape and the skewness do not change substantially. In week 36, the skewness becomes even less positive and the shape shows a right-hand shift. This reveals that the hT2 tumor volume has less cellularity and the heterogeneous microstructural composition was maintained.
Fig. 5.

Patient no. 12 from Table 2. a, e, i, l, p, t T1 post-contrast MRI sequence, in blue: segmented T1 post-contrast volume at baseline, 12, 16, 28, 40, and 52 weeks after commencement of B/I therapy. b, f, j, m, q, u T2 MRI sequence prior to B/I treatment, in magenta: segmented T2 volume at baseline, 12, 16, 28, 40, and 52 weeks after commencement of therapy. c, g, k, n, r, v ADC map, in small; segmented T2 volume, registered to corresponding ADC maps at baseline, 12, 16, 28, 40, and 52 weeks after commencement of B/I therapy. d, h, l, o, s, w histogram of segmented T2 volume; gray scale count gives the number of gray scales for the T2 volume
Discussion
This retrospective study shows that the change in ADC histogram shape and asymmetry (skewness) derived from T2 segmented MRI volumes reflects the heterogeneous microstructural composition of a high-grade glioma and can predict radiological response to anti-angiogenic treatment early in the course of therapy.
MRI techniques are able to detect drug efficacy more reliably and at an early time in the course of anti-angiogenic treatment have great potential in clinical oncology practice [23-26]. In recurrent high-grade glioma (rHGG), VEGF pathway inhibition by means of bevacizumab not only leads to an anti-tumor, but also to an anti-vascular effect with the restoration of a highly permeable blood–brain barrier. This results radiologically in contrast enhancement withdrawal in T1 sequences and tumor edema reduction in T2/FLAIR sequences. Therefore, the traditional morphologic measurement of contrast-enhanced tumor volume (Macdonald criteria) and even changes in T2/FLAIR sequences (RANO criteria) may not assess true treatment response [5, 27-29]. Despite intense investigations, no reliable neuroimaging biomarkers predictive and/or prognostic of anti-angiogenic treatment response have been established so far [30, 31].
Imaging parameters derived from DW-MRI offer appealing imaging biomarkers [32] because the acquisition is non-invasive, does not require any exogenous contrast agents or ionizing radiation, is quantitative, and shows high reproducibility [8, 12]. The apparent diffusion coefficient (ADC), which quantifies overall diffusion (equal to water mobility) occurring within each voxel, is able to detect early microstructural tissue changes associated with cell death [33, 34]. These changes contribute to altered cell density, a histological feature having an inverse relationship to ADC [35]. Increasing ADC values with successful therapy have been reported at several anatomic sites, including breast cancer [36, 37], renal cancer [38, 39], primary sarcoma of bone [40], and in brain malignancies [41-43]. Latest studies by Jain et al. demonstrated that patients with rHGG, who were treated with anti-angiogenic therapy and did not respond to therapy, showed a significant decrease in mean ADC values [14].
This study compared Macdonald and RANO criteria to reveal an anticipated discrepancy in response assessment. When applying Macdonald criteria, nine (60%) patients showed a partial response, four (28.6%) patients had stable disease, and one (7.1%) patient showed disease progression. In contrast, when using RANO criteria, seven (50%) patients showed a partial response, three (21.4%) patients, stable disease; and four (28.6%) patients, tumor progression. The three patients (21.4%; nos. 3, 5, and 15; Table 2) who accounted for this disagreement developed a solely T2 hyperintense tumor progression with suppression of contrast enhancement in T1, consistent with a gliomatotic tumor growth pattern. These findings are in line with literature reports that describe an altered tumor recurrence pattern during or after VEGF pathway-inhibiting treatment strategies [44-47]. Such a gliomatotic growth pattern is characterized by a decrease in the size of the contrast-enhanced, but an increase in the size of the non-enhanced part of the tumor. Recent radiologic–histopathologic correlation studies in T2 hyperintense regions showed a phenotypic shift in malignant glioma growth to a predominantly infiltrative tumor type independently of tumor angiogenesis [19]. These findings suggest that T2 signal abnormality and increasing T2 volume in the course of anti-angiogenic treatment are mainly due to VEGF-independent glioma cell infiltration and not to increasing tumor edema. T2 signal abnormalities, however, in the context of heavily pre-treated HGG, are difficult to interpret, which is why ADC histograms generated from DWI-MRI and T2 hyperintense tumor volumes were used to further characterize morphological microstructural changes during anti-angiogenic treatment.
This study demonstrates that during the course of anti-angiogenic treatment, the overall ADC values decrease (−6.8%) in progressors as compared to non-progressors (+7.9%). Although the patient population is quite small, with 11 progressors and three responding patients at 6 months, these results are in line with previous studies [13, 14].
However, because of the very heterogeneous biological nature of heavily pre-treated HGGs in different regions within the same tumor, alterations in ADC values are not only dependent on changing cellular density caused by cell death [48]. Diffusivity is influenced by necrosis, microcyst formation, edema, reactive gliosis, hemorrhage, and treatment-related leukoencephalopathy [14]. This implies that evaluation of mean ADC values of the entire tumor mass is not as meaningful as it is in ADC gray scale analysis of certain tumor areas. Therefore, this study went one step further and analyzed the ADC gray scale distribution and calculated and displayed it by means of ADC histograms. ADC histogram analysis revealed changes in histogram shape during the course of anti-angiogenic treatment. In cases of tumor progression, the left tail of the histogram developed more steeply than did the right tail and the histograms became slim and peaked. A former heterogeneous gray scale distribution became more homogeneous with a peak at low ADC values. We measured the degree of histogram asymmetry using the statistical parameter skewness [49]. An increase in skewness (histogram shift to the left side) was significantly associated with a PFS of less than 6 months (progressors). Patients with a PFS of more than 6 months showed no change or even a decrease in skewness during therapy (responders). The sensitivity for an increasing skewness to predict failure to therapy, hence, PFS <6 months was 72% and specificity was 67%. Our results indicate that a patient with an increase in skewness at 8 weeks’ therapy is more likely to experience tumor progression than a patient with negative or stable skewness.
A decrease in mean ADC values and an increase in positive skewness can be due to two reasons: First, anti-angiogenic therapies in brain tumors cause an initial reduction in vasogenic edema [29], which decreases the extracellular space and therefore reduces ADC values. This is certainly one reason for mean ADC reduction. However, the peaked and slim histogram change cannot be due to a diminished edema alone. Therefore, secondly, the positive skewness is probably due to increased cellularity of the tumor in one region, hence, glioma growth. Neuropathologic examinations of HGG tissue following anti-angiogenic therapies showed a decrease in tumor vascularity and a lack of glomeruloid endothelial proliferations [19]. This indicates that continuous inhibition of VEGF-induced angiogenesis may promote tumor cell “escape”, which produces a VEGF-independent phenotype with hypercellularity [19]. These findings may support our hypothesis that positive skewness in ADC histograms is evidence of a compact hypercellular tumor tissue with restricted diffusivity, which results from VEGF-independent gliomatotic tumor growth—and bevacizumab therapy failure. Such invading VEGF-independent tumor cells will not be affected by anti-VEGF therapy regimens alone and will require combinations of agents specifically targeting the invasiveness of glioma cells.
In conclusion, this study entails the inevitable limitations of any retrospective study. The number of patients is limited; furthermore, the small study population is heterogeneous with a high variability of therapies before B/I treatment. Although parts of the methodical approach and its reliability have been tested in former trials [6, 13, 15], the reliability of our method has to be further evaluated in high-grade gliomas during “conventional” treatment. The results in this small patient cohort and the reliability of the method clearly have to be further evaluated in major prospective clinical trials. Nevertheless, the results of our study not only support recently published literature regarding increased frequency of gliomatotic tumor growth during anti-angiogenic therapy but may point to a new neuroimaging tool for early detection of therapy failure. ADC gray scale histograms as a display of cellular density and tissue composition could be a potentially predictive biomarker for the early assessment of infiltrative tumor growth and for identifying responders to VEGF pathway-inhibiting treatment regimens. There is a clear need to better understand these changes at the histological level, and corresponding prospective histopathologic correlation studies would help address this issue.
Acknowledgments
We thank Mary Margreiter for the critical reading and helpful comments. M. Nowosielski holds a DOC-FORTE Fellowship from the Austrian Academy of Science at the Department of Neurology, Innsbruck Medical University. Özgür Güler’s work was funded by the Austrian Science Foundation (Project 20604-B13).
Footnotes
Originality and presentations The authors confirm the originality of this study. Parts of the study were presented at the EANO Meeting 2010 (Sept. 2010, Maastricht)
Conflict of Interest We declare that we have no conflict of interest.
Contributor Information
Martha Nowosielski, Department of Neurology, Innsbruck Medical University, Anichstrasse 35, A-6020, Innsbruck, Austria.
Wolfgang Recheis, Department of Radiology, Innsbruck Medical University, Innsbruck, Austria.
Georg Goebel, Department of Medical Statistics, Informatics and Health Economics, Innsbruck Medical University, Innsbruck, Austria.
Özgür Güler, 4D Visualization Laboratory, University Clinic of Oto-, Rhino- and Laryngology, Innsbruck Medical University, Innsbruck, Austria.
Gerd Tinkhauser, Department of Neurology, Innsbruck Medical University, Anichstrasse 35, A-6020, Innsbruck, Austria.
Herwig Kostron, Department of Neurosurgery, Innsbruck Medical University, Innsbruck, Austria.
Michael Schocke, Department of Radiology, Innsbruck Medical University, Innsbruck, Austria.
Thaddaeus Gotwald, Department of Radiology, Innsbruck Medical University, Innsbruck, Austria.
Günther Stockhammer, Department of Neurology, Innsbruck Medical University, Anichstrasse 35, A-6020, Innsbruck, Austria.
Markus Hutterer, Department of Neurology, Innsbruck Medical University, Anichstrasse 35, A-6020, Innsbruck, Austria; Department of Neurology, Paracelsus Medical University, Salzburg–Christian Doppler Hospital, Salzburg, Austria.
References
- 1.Wong ET, Hess KR, Gleason MJ, et al. Outcomes and prognostic factors in recurrent glioma patients enrolled onto phase II clinical trials. J Clin Oncol. 1999;17:2572–2578. doi: 10.1200/JCO.1999.17.8.2572. [DOI] [PubMed] [Google Scholar]
- 2.Lamborn KR, Yung WK, Chang SM, et al. Progression-free survival: an important end point in evaluating therapy for recurrent high-grade gliomas. Neuro Oncol. 2008;10:162–170. doi: 10.1215/15228517-2007-062. [DOI] [PMC free article] [PubMed] [Google Scholar]
- 3.Vredenburgh JJ, Desjardins A, Herndon JE, 2nd, et al. Bevacizumab plus irinotecan in recurrent glioblastoma multiforme. J Clin Oncol. 2007;25:4722–4729. doi: 10.1200/JCO.2007.12.2440. [DOI] [PubMed] [Google Scholar]
- 4.Macdonald DR, Cascino TL, Schold SC, Jr, Cairncross JG. Response criteria for phase II studies of supratentorial malignant glioma. J Clin Oncol. 1990;8:1277–1280. doi: 10.1200/JCO.1990.8.7.1277. [DOI] [PubMed] [Google Scholar]
- 5.Wen PY, Macdonald DR, Reardon DA, et al. Updated response assessment criteria for high-grade gliomas: response assessment in neuro-oncology working group. J Clin Oncol. 2010;28:1963–1972. doi: 10.1200/JCO.2009.26.3541. [DOI] [PubMed] [Google Scholar]
- 6.Jain R, Scarpace LM, Ellika S, et al. Imaging response criteria for recurrent gliomas treated with bevacizumab: role of diffusion weighted imaging as an imaging biomarker. J Neurooncol. 2009;96:423–431. doi: 10.1007/s11060-009-9981-6. [DOI] [PubMed] [Google Scholar]
- 7.Le Bihan D, Breton E, Lallemand D, Aubin ML, Vignaud J, Laval-Jeantet M. Separation of diffusion and perfusion in intravoxel incoherent motion MR imaging. Radiology. 1988;168:497–505. doi: 10.1148/radiology.168.2.3393671. [DOI] [PubMed] [Google Scholar]
- 8.Padhani AR, Liu G, Koh DM, et al. Diffusion-weighted magnetic resonance imaging as a cancer biomarker: consensus and recommendations. Neoplasia. 2009;11:102–125. doi: 10.1593/neo.81328. [DOI] [PMC free article] [PubMed] [Google Scholar]
- 9.Patterson DM, Padhani AR, Collins DJ. Technology insight: water diffusion MRI—a potential new biomarker of response to cancer therapy. Nat Clin Pract Oncol. 2008;5:220–233. doi: 10.1038/ncponc1073. [DOI] [PubMed] [Google Scholar]
- 10.Thoeny HC, De Keyzer F, Vandecaveye V, et al. Effect of vascular targeting agent in rat tumor model: dynamic contrast-enhanced versus diffusion-weighted MR imaging. Radiology. 2005;237:492–499. doi: 10.1148/radiol.2372041638. [DOI] [PubMed] [Google Scholar]
- 11.Hamstra DA, Rehemtulla A, Ross BD. Diffusion magnetic resonance imaging: a biomarker for treatment response in oncology. J Clin Oncol. 2007;25:4104–4109. doi: 10.1200/JCO.2007.11.9610. [DOI] [PubMed] [Google Scholar]
- 12.Paldino MJ, Barboriak D, Desjardins A, Friedman HS, Vredenburgh JJ. Repeatability of quantitative parameters derived from diffusion tensor imaging in patients with glioblastoma multiforme. J Magn Reson Imaging. 2009;29:1199–1205. doi: 10.1002/jmri.21732. [DOI] [PubMed] [Google Scholar]
- 13.Pope WB, Kim HJ, Huo J, et al. Recurrent glioblastoma multiforme: ADC histogram analysis predicts response to bevacizumab treatment. Radiology. 2009;252:182–189. doi: 10.1148/radiol.2521081534. [DOI] [PubMed] [Google Scholar]
- 14.Jain R, Scarpace LM, Ellika S, et al. Imaging response criteria for recurrent gliomas treated with bevacizumab: role of diffusion weighted imaging as an imaging biomarker. J Neurooncol. 2009;96(3):423–431. doi: 10.1007/s11060-009-9981-6. [DOI] [PubMed] [Google Scholar]
- 15.Guzman R, Altrichter S, El-Koussy M, et al. Contribution of the apparent diffusion coefficient in perilesional edema for the assessment of brain tumors. J Neuroradiol. 2008;35:224–229. doi: 10.1016/j.neurad.2008.02.003. [DOI] [PubMed] [Google Scholar]
- 16.Stupp R, Mason WP, van den Bent MJ, et al. Radiotherapy plus concomitant and adjuvant temozolomide for glioblastoma. N Engl J Med. 2005;352:987–996. doi: 10.1056/NEJMoa043330. [DOI] [PubMed] [Google Scholar]
- 17.Yushkevich PA, Piven J, Hazlett HC, et al. User-guided 3D active contour segmentation of anatomical structures: significantly improved efficiency and reliability. Neuroimage. 2006;31:1116–1128. doi: 10.1016/j.neuroimage.2006.01.015. [DOI] [PubMed] [Google Scholar]
- 18.Dempsey MF, Condon BR, Hadley DM. Measurement of tumor “size” in recurrent malignant glioma: 1D, 2D, or 3D? AJNR Am J Neuroradiol. 2005;26:770–776. [PMC free article] [PubMed] [Google Scholar]
- 19.de Groot JF, Fuller G, Kumar AJ, et al. Tumor invasion after treatment of glioblastoma with bevacizumab: radiographic and pathologic correlation in humans and mice. Neuro Oncol. 2010;12:233–242. doi: 10.1093/neuonc/nop027. [DOI] [PMC free article] [PubMed] [Google Scholar]
- 20.Pieper SLB, Schroeder W, Kikinis R. The NA-MIC kit: ITK, VTK, pipelines, grids and 3D slicer as an open platform for the medical image computing community; Proceedings of the 3rd IEEE International Symposium on Biomedical Imaging: From Nano to Macro; 2006.pp. 698–701. [Google Scholar]
- 21.Pieper SLB, Schroeder W, Kikinis R. 2010. www.3dslicer.org.
- 22.Ballman KV, Buckner JC, Brown PD, et al. The relationship between six-month progression-free survival and 12-month overall survival end points for phase II trials in patients with glioblastoma multiforme. Neuro Oncol. 2007;9:29–38. doi: 10.1215/15228517-2006-025. [DOI] [PMC free article] [PubMed] [Google Scholar]
- 23.Sinha G. Expensive cancer drugs with modest benefit ignite debate over solutions. J Natl Cancer Inst. 2008;100:1347–1349. doi: 10.1093/jnci/djn357. [DOI] [PubMed] [Google Scholar]
- 24.Karapetis CS, Khambata-Ford S, Jonker DJ, et al. K-ras mutations and benefit from cetuximab in advanced colorectal cancer. N Engl J Med. 2008;359:1757–1765. doi: 10.1056/NEJMoa0804385. [DOI] [PubMed] [Google Scholar]
- 25.Oldenhuis CN, Oosting SF, Gietema JA, de Vries EG. Prognostic versus predictive value of biomarkers in oncology. Eur J Cancer. 2008;44:946–953. doi: 10.1016/j.ejca.2008.03.006. [DOI] [PubMed] [Google Scholar]
- 26.Miller JC, Pien HH, Sahani D, Sorensen AG, Thrall JH. Imaging angiogenesis: applications and potential for drug development. J Natl Cancer Inst. 2005;97:172–187. doi: 10.1093/jnci/dji023. [DOI] [PubMed] [Google Scholar]
- 27.Pope WB, Lai A, Nghiemphu P, Mischel P, Cloughesy TF. MRI in patients with high-grade gliomas treated with bevacizumab and chemotherapy. Neurology. 2006;66:1258–1260. doi: 10.1212/01.wnl.0000208958.29600.87. [DOI] [PubMed] [Google Scholar]
- 28.Vredenburgh JJ, Desjardins A, Herndon JE, 2nd, et al. Phase II trial of bevacizumab and irinotecan in recurrent malignant glioma. Clin Cancer Res. 2007;13:1253–1259. doi: 10.1158/1078-0432.CCR-06-2309. [DOI] [PubMed] [Google Scholar]
- 29.Batchelor TT, Sorensen AG, di Tomaso E, et al. AZD2171, a pan-VEGF receptor tyrosine kinase inhibitor, normalizes tumor vasculature and alleviates edema in glioblastoma patients. Cancer Cell. 2007;11:83–95. doi: 10.1016/j.ccr.2006.11.021. [DOI] [PMC free article] [PubMed] [Google Scholar]
- 30.Jain RK, Duda DG, Clark JW, Loeffler JS. Lessons from phase III clinical trials on anti-VEGF therapy for cancer. Nat Clin Pract Oncol. 2006;3:24–40. doi: 10.1038/ncponc0403. [DOI] [PubMed] [Google Scholar]
- 31.Park JW, Kerbel RS, Kelloff GJ, et al. Rationale for biomarkers and surrogate end points in mechanism-driven oncology drug development. Clin Cancer Res. 2004;10:3885–3896. doi: 10.1158/1078-0432.CCR-03-0785. [DOI] [PubMed] [Google Scholar]
- 32.Thoeny HC, Ross BD. Predicting and monitoring cancer treatment response with diffusion-weighted MRI. J Magn Reson Imaging. 2010;32:2–16. doi: 10.1002/jmri.22167. [DOI] [PMC free article] [PubMed] [Google Scholar]
- 33.Lee KC, Hall DE, Hoff BA, et al. Dynamic imaging of emerging resistance during cancer therapy. Cancer Res. 2006;66:4687–4692. doi: 10.1158/0008-5472.CAN-05-3205. [DOI] [PubMed] [Google Scholar]
- 34.Kono K, Inoue Y, Nakayama K, et al. The role of diffusion-weighted imaging in patients with brain tumors. AJNR Am J Neuroradiol. 2001;22:1081–1088. [PMC free article] [PubMed] [Google Scholar]
- 35.Chenevert TL, Stegman LD, Taylor JM, et al. Diffusion magnetic resonance imaging: an early surrogate marker of therapeutic efficacy in brain tumors. J Natl Cancer Inst. 2000;92:2029–2036. doi: 10.1093/jnci/92.24.2029. [DOI] [PubMed] [Google Scholar]
- 36.Yoshikawa MI, Ohsumi S, Sugata S, et al. Relation between cancer cellularity and apparent diffusion coefficient values using diffusion-weighted magnetic resonance imaging in breast cancer. Radiat Med. 2008;26:222–226. doi: 10.1007/s11604-007-0218-3. [DOI] [PubMed] [Google Scholar]
- 37.Guo Y, Cai YQ, Cai ZL, et al. Differentiation of clinically benign and malignant breast lesions using diffusion-weighted imaging. J Magn Reson Imaging. 2002;16:172–178. doi: 10.1002/jmri.10140. [DOI] [PubMed] [Google Scholar]
- 38.Squillaci E, Manenti G, Cova M, et al. Correlation of diffusion-weighted MR imaging with cellularity of renal tumours. Anticancer Res. 2004;24:4175–4179. [PubMed] [Google Scholar]
- 39.Manenti G, Di Roma M, Mancino S, et al. Malignant renal neoplasms: correlation between ADC values and cellularity in diffusion weighted magnetic resonance imaging at 3 T. Radiol Med. 2008;113:199–213. doi: 10.1007/s11547-008-0246-9. [DOI] [PubMed] [Google Scholar]
- 40.Hayashida Y, Yakushiji T, Awai K, et al. Monitoring therapeutic responses of primary bone tumors by diffusion-weighted image: initial results. Eur Radiol. 2006;16:2637–2643. doi: 10.1007/s00330-006-0342-y. [DOI] [PubMed] [Google Scholar]
- 41.Higano S, Yun X, Kumabe T, et al. Malignant astrocytic tumors: clinical importance of apparent diffusion coefficient in prediction of grade and prognosis. Radiology. 2006;241:839–846. doi: 10.1148/radiol.2413051276. [DOI] [PubMed] [Google Scholar]
- 42.Murakami R, Sugahara T, Nakamura H, et al. Malignant supratentorial astrocytoma treated with postoperative radiation therapy: prognostic value of pretreatment quantitative diffusion-weighted MR imaging. Radiology. 2007;243:493–499. doi: 10.1148/radiol.2432060450. [DOI] [PubMed] [Google Scholar]
- 43.Reddy JS, Mishra AM, Behari S, et al. The role of diffusion-weighted imaging in the differential diagnosis of intracranial cystic mass lesions: a report of 147 lesions. Surg Neurol. 2006;66:246–250. doi: 10.1016/j.surneu.2006.03.032. discussion 250–241. [DOI] [PubMed] [Google Scholar]
- 44.Gruber SKML, Medabalmi P, Gruber DB, Golfinos J, Parker E, Narayana A. Change in pattern of relapse in newly diagnosed high-grade glioma following bevacizumab therapy. J Clin Oncol. 2010;28:15s. suppl; abstr 2020. [Google Scholar]
- 45.Norden AD, Young GS, Setayesh K, et al. Bevacizumab for recurrent malignant gliomas: efficacy, toxicity, and patterns of recurrence. Neurology. 2008;70:779–787. doi: 10.1212/01.wnl.0000304121.57857.38. [DOI] [PubMed] [Google Scholar]
- 46.Rubenstein JL, Kim J, Ozawa T, et al. Anti-VEGF antibody treatment of glioblastoma prolongs survival but results in increased vascular cooption. Neoplasia. 2000;2:306–314. doi: 10.1038/sj.neo.7900102. [DOI] [PMC free article] [PubMed] [Google Scholar]
- 47.Sorensen AG, Batchelor TT, Wen PY, Zhang WT, Jain RK. Response criteria for glioma. Nat Clin Pract Oncol. 2008;5:634–644. doi: 10.1038/ncponc1204. [DOI] [PMC free article] [PubMed] [Google Scholar]
- 48.Chen W, Silverman DH. Advances in evaluation of primary brain tumors. Semin Nucl Med. 2008;38:240–250. doi: 10.1053/j.semnuclmed.2008.02.005. [DOI] [PubMed] [Google Scholar]
- 49.Kendall 1998. http://mathworld.wolfram.com/Skewness.html.