

Abstract
Gas chromatography/electron capture negative ion chemical ionization-mass spectrometry (GC/ECNICI-MS) combined with pentafluorobenzoyl derivatization (PFBoyl) is frequently used for the sensitive detection of fatty alcohols (FOH). However, this derivatization technique suffers from a lack of established reaction protocols, time-consuming reactions, and the presence of reagent artifacts or unwanted derivatization byproducts which can hinder analyte detection. Here, strategies are presented to reduce the problems associated with PFBoyl-derivatization, including 1) the optimization of reaction conditions (derivatization time and temperature) for a variety of PFBoyl-derivatized FOH, 2) an investigation of microwave-accelerated derivatization (MAD) as a rapid alternative heating mechanism for the PFBoyl-derivatization of FOH, and 3) an analysis of an alternative strategy employing a solvent extraction procedure post-derivatization to reduce the detrimental effects commonly associated with PFBoyl derivatization reagents. The optimal reaction conditions for the PFBoyl-derivatization of FOH was determined to be 60 °C for 45 min. The investigation in MAD demonstrated the potential of obtaining comparable PFBoyl-derivatizations to those obtained using traditional heating methods, albeit in a reaction time of 3 min. An examination of several solvents for post-derivatization extraction revealed improved relative response factors in comparison to those obtained without solvent extraction. The best solvents for the PFBoyl-FOH extraction, dichloromethane and tert-butyl methyl ether, were also compared to the no solvent extraction samples with standard response curves and PFBoyl-derivatized FOH in Bligh-Dyer extracted rat plasma.
Keywords: Gas chromatography/mass spectrometry (GC/MS), fatty alcohols (FOH), pentafluorobenzoyl chloride (PFBoylCl), electron capture negative ion chemical ionization (ECNICI), post-derivatization extraction
1. Introduction
Fatty alcohols (FOH), have been detected in a variety of biological samples [1-3]. However, unlike fatty acids (FA), FOH have not been as extensively investigated. In fact, the exact role of most FOH in biological systems is unclear [4, 5]. In part, the reduced number of FOH studies may reflect the relatively low abundance of FOH (<0.01% of total lipid content) in biological systems [6, 7]. Despite these factors, recent studies have shown that although FOH are present in low concentrations, specific abnormalities in FOH levels can have significant consequences. Sjögren-Larsson syndrome, an inherited disorder of FOH metabolism, occurs as a result of a deficiency in FOH oxidation [5, 6, 8, 9]. Peroxisomal biogenesis disorders, occur as a result of the inability to convert the FOH to FA and glycerolipids [5, 10]. In addition, as branch point lipids, the potential roles of FOH as an intermediate of the FA-FOH cycle [4, 5], have yet to be determined. Due to the relatively low abundance of FOH in biological systems, sensitive methods capable of detecting FOH in several types of matrices are required. For the analysis of FOH by chromatographic and mass spectrometric methods, careful sample preparation is required to enhance overall sensitivity. Thus, optimizing sample treatment protocols are needed.
The structure of saturated straight chain FOH leads to several difficulties in conventional analytical methods. For example, 1) the hydroxyl moiety complicates its interaction with capillary gas chromatography (GC) solid phase; 2) the absence of olefins prevents UV detection; and 3) the poor inherent ionization properties of FOH limits their detection by mass spectrometry (MS). Accordingly, derivatization of the hydroxyl group is required to enhance chromatography and ionization. Several derivatization strategies exist for the derivatization of hydroxyl-containing compounds. For the analysis of hydroxyl-containing compounds by liquid chromatography (LC), derivatives have been tailored for fluorescence [11, 12] and electrospray ionization/mass spectrometry (ESI-MS) based analyses [13-18]. For the GC derivatization of FOH, electron ionization (EI) based derivatizations, such as silylation, are commonly employed [19-22]. However, reactions which impart a halogenated moiety, such as the pentafluorobenzoyl derivatives (PFBoyl), offer the capability of enhanced GC/MS detection of hydroxyl-containing compounds when coupled with negative ion chemical ionization (NICI) and electron capture detection (ECD) [21, 22]. 2,3,4,5,6-Pentafluorobenzoyl chloride (PFBoylCl) has been shown to provide the sensitive detection of steroids [23-25], amines [26, 27], and endocrine disrupting compounds [28, 29]. PFBoyl-derivatization has shown the potential to sensitively detect the esters of PFBoyl-derivatized FOH in biological samples when employing selected ion monitoring (SIM) methods [30-32]. Despite the noted capabilities of PFBoylCl hydroxyl derivatization, several drawbacks exist, including the corrosive nature of PFBoyl reagents, high PFBoyl-related background, and elevated reaction conditions [21, 22, 33].
Perhaps the most critical parameter for successful PFBoyl-FOH analysis is the optimization of derivatization (e.g., the reaction time and temperature). Optimal derivatization strategies balance desired volatility, thermal stability, and sensitivity against extended reaction times and unwanted derivatization byproducts. In addition, few standard protocols exist describing the optimal derivatization conditions for analytes on an individual and comprehensive level. Beyond the optimization of reaction conditions, several strategies to improve GC derivatization have been previously tested, including the addition of reaction catalysts (e.g. trimethylchlorosilane) [20, 22, 34], the addition of solvents during the reaction (e.g. pyridine) [20, 34, 35], and the application of alternative heating mechanisms (e.g. microwave heating) [36]. In particular, the use of microwave-accelerated derivatization (MAD) has been shown to provide comparable or enhanced yields in dramatically lower analysis times for steroids [37-39], amino acids [40], carbonyl compounds [41], and other compounds [42-45], when compared to derivatization reactions performed using the traditional heating approaches. The key advantage of microwave heating centers on its ability to provide enhanced reaction rates, and thus shorter reaction times [46-48]. Due to the typically elevated reaction conditions needed for the PFBoyl-derivatization of FOH (reactions range from 60 - 120 °C for 20 - 45 min) [30-32], MAD was presented as an ideal alternative heating mechanism. For the drawbacks associated with PFBoyl-related background noise, an issue resulting from the enhanced ECD detection of PFBoyl products, sample treatment steps have been previously described [21, 30, 32]. Solvent extraction of the PFBoyl-derivatized solution offers the capability to reduce PFBoyl-related noise, minimize the detrimental effects associated with the corrosive nature of PFBoyl reagents, and provide an enhanced detection of PFBoyl-derivatives.
In this study, several FOH varying in chain length and number of double bonds were examined using PFBoylCl and GC/ECNICI-MS with SIM. Specifically, strategies aimed to improve PFBoyl-derivatization were examined, including the optimization of PFBoyl reaction time and temperatures, the application of microwave heating, and the use of post-derivatization solvent extraction. Initial experiments focused on the optimization of reaction times and temperatures for the PFBoyl-derivatization of FOH using a water bath heater. The optimized reaction condition using the water bath was used for comparisons to two derivatization enhancement experiments (microwave heating and post-derivatization solvent extraction). Methods developed here provide optimal conditions to detect FOH using standard heating methods and sample preparation while providing evidence that microwave heating can be employed to shorten derivatization intervals.
2. Experimental
2.1 Standards, solutions, and reagents
Two sets of FOH were employed in this study: (i) a standard FOH reference mixture Nuchek Catalog 32C (consisting of FOH: 16:0, 18:0, 20:0, 22:0, and 24:0, where x:y denotes number of carbons: number of double bonds) was used for the MAD experiments, and (ii) a mixture of individual FOH standards at equal gram weights comprised of 14:0, 14:1, 16:0, 16:1, 17:0, 18:0, 18:1, 18:2, 19:0, 20:0, 20:4, 22:0, 22:6, 24:0 that was used for the derivatization optimization and calibration experiments. Reference mixture 32C consisted of each FOH measured by weight in a 100 mg sample: 16:0 (35 mg), 18:0 (25 mg), 20:0 (20 mg), 22:0 (15 mg), and 24:0 (5 mg). The reference solution was made by diluting 10 mg of the reference mixture to 10 mL in chloroform. This solution was then diluted to 10 μg/mL. The FOH were acquired from Nu-Chek Prep, Inc. (Elysian, Mn). In addition to FOH, cholesterol (chol) was also examined and was purchased from Sigma Aldrich (St. Louis, MO). For FOH mix (i), a stock solution at 1 mg/mL in chloroform was diluted to a 10 μg/mL solution. For FOH mix (ii), individual stock solutions of the FOH and cholesterol were prepared in chloroform to 1 mg/mL and were diluted to 10 μg/mL in chloroform (except the internal standard, 17:0-OH, which was made to 50 μg/mL). A stock solution of hexachlorobenzene (HCB), in hexane, was used as a surrogate for derivatization response and was made to a concentration of 1 μg/mL in hexane. All solvents (dichloromethane (DCM, Sigma Aldrich), hexane (Burdick and Jackson, Muskegon, MI), heptane (Fisher, Fair Lawn, NJ), tert-butyl methyl ether (MTBE, Sigma Aldrich), chloroform (CHCl3, Burdick and Jackson), ethyl acetate (Fisher), methanol (Burdick and Jackson), and petroleum ether (Burdick and Jackson)) used were at analytical grade. The derivatization reagent, 2,3,4,5,6-pentafluorobenzoyl chloride (98%, PFBoylCl), was purchased from Acros Organics (Morris Plains, NJ).
2.2 Optimization of derivatization conditions (reaction time and temperature)
The derivatization optimization experiments were performed by adding 100 μL of the FOH mixture (mix ii, 10 μg/mL) to glass vials, evaporating to dryness, and reconstituting with 100 μL of PFBoylCl. During initial experiments, smaller volumes of reagent (25 μL) were used without significant loss in derivatization yield. However, excess was used in this method to ensure derivatization of FOH. As stated this amount may need to be modified with specific specimens to optimize derivatization and detection. After reagent addition, the solution was briefly vortexed and subsequently was incubated at 60 °C for 15, 30, 45, 60, and 90 minutes in a water bath. Other temperatures (25 and 45 °C) were also examined, as indicated. Following heated reactions, samples were briefly centrifuged and taken from each vial and transferred into a GC vial insert. Solutions containing reaction products were then gently evaporated, reconstituted with hexane (with 1 μg/mL HCB), and analyzed by GC/MS. From the chromatogram, reconstructed ion chromatograms (RICs) of the PFBoyl-derivatized molecular ions [M]- for each FOH were used for peak area measurement (using manual integration). The corresponding ions (m/z) for each PFBoylCl-derivatized FOH are shown in Table 1: HCB (284), 14:0 (408), 14:1 (406), 16:0 (436), 16:1 (434), 17:0 (450), 18:0 (464), 18:1 (462), 18:2 (460), 20:0 (492), 20:4 (484), 22:0 (520), 22:6 (508), 24:0 (548), and cholesterol (580). To allow a comparison of reaction time and temperature methods, a relative response factor (RRF) was generated by dividing the peak area of the PFBoyl-derivatized FOH by the peak area of HCB. HCB was utilized as the surrogate due its inactivity during the derivatization process. HCB had a peak area relative standard deviation (RSD) < 5% throughout these analyses. The experimental conditions were run in triplicate.
Table 1.
Targeted SIM ions used to measure the peak areas for the PFBoyl-derivatized FOH
| Fatty Alcohol | Derivative m/z | Extended RT | Abbreviated RT |
|---|---|---|---|
| HCB | 284 | 13.29 | -- |
| 14:0 | 408 | 19.39 | 5.14 |
| 14:1 | 406 | 19.13 | 4.94 |
| 16:0 | 436 | 23.16 | 7.64 |
| 16:1 | 434 | 22.97 | 7.32 |
| 17:0 | 450 | 24.76 | 8.77 |
| 18:0 | 464 | 25.86 | 9.92 |
| 18:1 | 462 | 25.52 | 9.54 |
| 18:2 | 460 | 25.43 | 9.46 |
| 20:0 | 492 | 27.67 | 12.57 |
| 20:4 | 484 | 26.84 | 11.22 |
| 22:0 | 520 | 29.18 | -- |
| 22:6 | 508 | 28.28 | 13.67 |
| 24:0 | 548 | 30.53 | -- |
| cholesterol | 580 | 33.69 | 19.55 |
Average retention time (RT) listed in min (n=3). Two FOH (22:0, and 24:0) were not examined using the abbreviated thermal program. X:Y abbreviation, where X = number of carbons and Y = number of double bonds. Hexachlorobenzene (HCB) was used as a surrogate to compare derivatization yields between methods. The notation (--) indicates that these compounds were not included in those analyses using the abbreviated thermal program.
2.3 Examination of microwave-accelerated derivatization for PFBoyl-derivatization of FOH
The MAD reactions were performed using a Biotage Initiator Microwave Synthesizer (2.45 GHz, 400-W maximum, version 2.5, Charlotte, NC). An advantage of employing a synthesis microwave over domestic microwave models was the capability of real-time monitoring and control of temperature, pressure and power. The reaction condition examined for the MAD of FOH using PFBoylCl was 100 °C for 3 min, which was based on values listed on a microwave/conductive heating conversion chart (provided by Biotage). Briefly, the reactions were performed by adding 100 μL of the FOH mixture (mix i) to standard glass vials (or 0.2 mL microwave vials), evaporating to dryness, and reconstituting with 100 μL of PFBoylCl. The solution was then briefly vortexed and placed into a water bath at 60 °C or in the microwave system. After the derivatization reaction, the samples were briefly centrifuged and the derivatized solutions were taken from each vial and transferred into GC vial inserts, gently evaporated, reconstituted with hexane (with HCB), and analyzed by GC/MS. The RRF values obtained using MAD were compared to those obtained using the optimal water bath time and temperature (60 °C for 45 min).
2.4 Examination of post-derivatization solvent cleanup
The derivatization reaction employed for the post-derivatization solvent extraction experiments were performed as previously noted by adding 100 μL of PFBoylCl to the FOH residue (mix ii, 10 μg/mL) and heating for 45 min at 60 °C. Following the heated reactions, two sample treatments were investigated: 1) PFBoyl-derivatized solutions were directly analyzed by GC/MS without solvent extraction, and 2) PFBoyl-derivatized solutions were introduced to a solvent-water extraction prior to GC/MS analysis. Several solvents were examined as potential derivatization extraction solvents, including petroleum ether, hexane, heptane, chloroform, DCM, and MTBE. Briefly, the post-derivatization extraction procedure was performed by adding 1 mL of deionized water and 1 mL of solvent to the PFBoyl-derivatized solution. The sample was then vortexed, centrifuged, and the aqueous layer was removed. This step was then repeated after adding an additional 1 mL of water. The organic layer was evaporated to dryness under nitrogen. Ethyl acetate was added to the resultant residue, vortexed, and added to a GC/MS insert. The solution was then evaporated and reconstituted with 100 μL of hexane (with HCB). Although PFBoylCl reagent can hydrolyze when exposed to moisture or water, hydrolysis of the PFBoyl-FOHs was not readily observed as PFB-derivatives are known to be stable [21, 25].
As a comparison, an additional derivatization reaction at an elevated temperature was performed (100 °C for 45 minutes, followed by post-derivatization solvent extraction using 100 μL of dichloromethane and 100 μL of water) and was compared to the results obtained in this section. It should be noted that this investigation was performed at 100 °C, not at 120 °C as described by Wolf et. al [32], due to the temperature limitations of the water bath. In this study, it was shown that the addition of water plus immiscible solvent was beneficial for sample cleanup [32]. RRF values were used to compare the feasibility of each solvent in post-derivatization extraction and these values were compared to the RRF values obtained using the no solvent extraction method. Signal-to-noise (S/N) ratios were obtained by taking the points across the peak of interest and dividing by an average of 100 noise points. The solvent experiments were performed in triplicate.
2.5 Response curves
A stock mixture was prepared to 100 μg/mL and included the FOH: 14:0, 14:1, 16:0, 16:1, 18:0, 18:1, 18:2, 20:0, 20:4, 22:6, and cholesterol. Serial dilutions were made for each calibration set: 1) levels of 100, 50, 10, 5, and 1 μg/mL for the PFBoyl-derivatized samples prepared with no post-derivatization extractions, and 2) levels of 50, 20, 10, 5, and 1 μg/mL for the PFBoyl-derivatized samples prepared with post-derivatization extractions. The internal standard 17:0-OH was added to a final concentration of 7 μg/mL. The use of an odd-chain FOH internal standard allowed the generation of response curves for multiple species of FOH using an inexpensive and commercially-available standard. Three separate response curves were performed following PFBoylCl derivatization, including: a response curve with no solvent extraction, a response curve treated with a MTBE-water extraction, and a response curve treated with DCM-water extraction post-heating. Each calibration curve was performed in triplicate. In addition, an additional level at 700 ng/mL was added for the samples treated with post-derivatization solvent extraction to measure the S/N ratios. At this concentration, a comparison was made between the S/N ratio obtained from the MTBE-water extraction to the S/N ratio obtained from the DCM-water extraction.
2.6 Biological Samples
To validate the feasibility of the developed post-derivatization solvent extraction method, rat plasma was investigated. For the rat samples, 100 μL of rat plasma was added to three sets of three separate vials. To each vial, 5 μL of the internal standard (17:0-OH) was also added. Each set was extracted by the Bligh-Dyer (BD) extraction method [49]. The BD extraction was performed by adding 2 mL of methanol and 1 mL of chloroform to the FBS solution. After the sample was vortexed, an additional 1 mL of chloroform was added, followed by vortexing and an addition of 1.6 mL of water. The sample was then vortexed and centrifuged. The organic (bottom) layer was collected.
Post-extraction, the solutions were evaporated under nitrogen. To the BD-extracted residues, 100 μL of PFBoylCl was added and vortexed. For all samples, the residues were derivatized in a water bath heater for 45 min at 60 °C. The vials were separated into three sets: no solvent addition (n=3), MTBE-water extraction (n=3), and DCM-water extraction (n=3). To the vials with no solvent extraction, the derivatized solution was transferred into vial inserts and was evaporated to dryness. To each of these vials, 100 μL of ethyl acetate was added prior to analysis by GC/MS. For the MTBE and DCM extracted solutions, the GC vial preparations were followed as previously described.
2.7 Gas chromatography/electron capture negative-ion chemical ionization-mass spectrometry
GC/MS was performed using an Agilent HP 6890 gas chromatograph/5973 mass selective detector (MSD), equipped with an HP 7683 Agilent Series Autosampler. The software used to evaluate the injected samples was Chemstation. The GC/MS was fitted with a DB-1 column with the dimensions of 12 m × 200 μm × 0.33 μm (film thickness) (J and W). The injection volume was 1 μL and was run with pulsed splitless mode and an injection port temperature of 250 °C. The pulse time was 1.5 minutes with a purge flow of 50 mL/min. The quadrupole, ion source, and transfer line temperatures were set to 106 °C, 150 °C and 280 °C, respectively. The carrier gas was ultra-high-purity (UHP) helium (99.99%) and was used at a flow rate of 1 mL/min. Methane was used as the reagent gas.
Two thermal programs were employed. An extended thermal program was set to start at 70 °C and held for 3.5 min. At a rate of 10 °C/min, the program was ramped up to 200 °C, followed by a 10 °C/min ramp to 310 °C and held for 5 min. The total run time was 37.5 min, with a solvent delay of 12 min. The abbreviated thermal program was set to start at 180 °C (for 3.5 min) and elevated to 310 °C by 7 °C/min. The total run time was 22.0 min, with a solvent delay of 4 min. The abbreviated thermal program was implemented for the calibration and biological sample experiments, due to the high volume of samples (the abbreviated program reduced overall analysis time and thus reduced derivative degradation). SIM was performed by monitoring the ions (m/z) of the PFBoyl-derivatized FOH, as listed in Table 1. The start time for each interval used to scan the PFBoyl-FOH SIM ions using the extended thermal program were: group 1 at 12.0 min (m/z 284), group 2 at 19.0 min (m/z 408, 406), group 3 at 22.7 min (m/z 436, 434), group 4 at 24.0 min (m/z 450), group 5 at 25.0 min (m/z 464, 462, 460), group 6 at 26.5 min (m/z 492, 484) and group 7 at 28.1 min (m/z 508, 580) for MS acquisition. The SIM groups for the abbreviated thermal program were: group 1 at 4.0 min (m/z 408, 406), group 2 at 7.0 min (m/z 436, 434), group 3 at 8.5 min (m/z 450), group 4 at 9.3 min (m/z 464, 462, 460), group 5 at 10.7 min (m/z 484), group 6 at 12.5 min (m/z 492, 508) and group 7 at 14.5 min (m/z 580) for MS acquisition.
3. Results and discussion
3.1. Optimization of reaction conditions for the PFBoyl derivatization of fatty alcohols
Initial experiments focused on the determination of optimal reaction conditions for the PFBoyl-derivatization of a wide range of FOH and cholesterol. A schematic of the PFBoyl derivatization reaction for FOH is shown in Figure 1. The primary reactions were performed at 60 °C. For the PFBoyl-derivatization of the FOH mixture (mix ii) at 60 °C, as shown in Figure 2, shorter reaction times were insufficient in completing the reaction with PFBoylCl. For reactions of 15 min at 60 °C, RRF values for the PFBoyl-FOH were lowest and had an average RSD of approximately 10%. In comparison, the RRF values for the PFBoyl-FOH obtained from reactions of 30 min were generally higher on average by a factor of 1.3, yet were typically lower than the RRF values obtained from reactions of 45 min on average by a factor of 1.6 (except for 22:6-OH). The optimal reaction time was determined to be 45 min at 60 °C, as indicated by the superior RRF values shown in Figure 2, despite a slight increase in RSD when compared to the 30 min reactions (RSD for 45 min compared to 30 min, 11 and 7%, respectively). Reaction times beyond 45 min (60 and 90 min) typically had lower RRF values and higher average RSD values (13 and 13%, respectively) compared to the RRF values obtained from the 45 min reactions. The internal standard (17:0-OH), as shown in the inset in Figure 2, also validated that the optimal reaction conditions were at 60 °C for 45 min. It should be noted that the derivatization of 22:6-OH (and to a lesser extent 20:4-OH and cholesterol) was less efficient (lower overall RRF values) and generally required increased reaction times and/or temperatures for complete derivatization.
Figure 1.
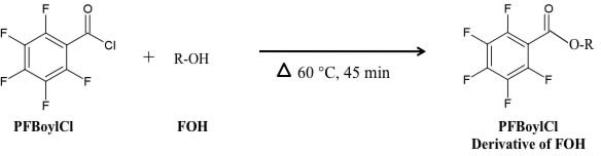
The reaction scheme employed for the conversion of FOH to ECNICI compatible PFBoyl-derivatives. Reaction heating was performed in a water bath heater. R denotes a long chain aliphatic group, such as 16:0 or 17:0.
Figure 2.
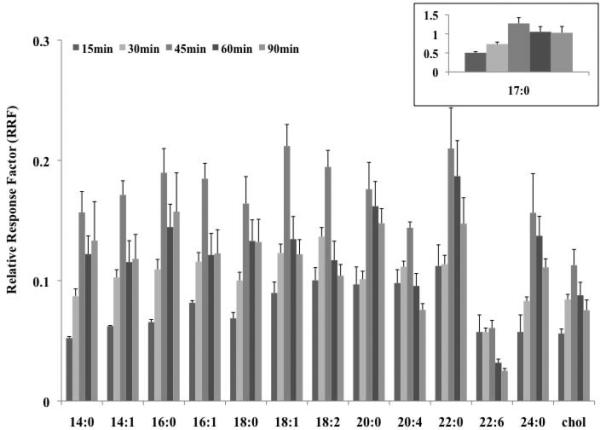
Investigation of several PFBoyl-derivatization reaction times at 60 °C for the FOH mixture (mix ii, 10 μg/mL). Relative response factors (RRFs) of the FOHs were obtained by dividing the peak area of the PFBoyl-derivatized FOH by the peak area of the surrogate, HCB. Error bars correspond to the standard deviation of the mean (n=3). RRF values located in inset represent those obtained for the internal standard (17:0-OH).
In addition to exploring the derivatization reactions at 60 °C, reaction conditions at room temperature (25 °C for 60 min) and at 45 °C (for 45 min) were also examined, as shown in Figure 3. Even though standard error was reduced (on average, 8 and 7%, for 45 min at 45 °C and 60 min at 25 °C, respectively), it was clear that these other reaction conditions were not as effective in producing RRF values comparable to those obtained using the optimal reaction time and temperature of 45 min at 60 °C. The internal standard, as shown in the inset in Figure 3, also supported this conclusion. It should be noted that at lower heating conditions (e.g., 25 °C), FOH with double bonds had significantly lower RRF values.
Figure 3.
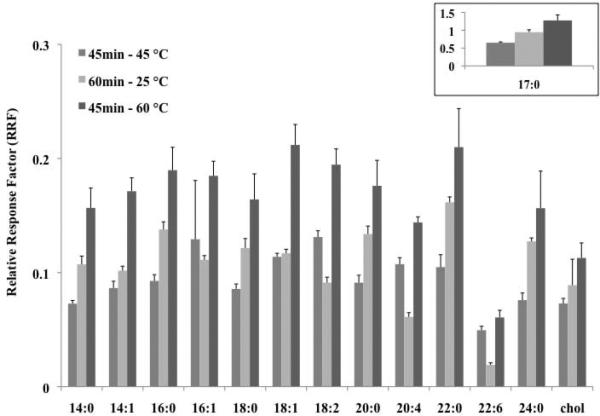
Investigation of other PFBoyl-derivatization reaction times and temperatures for FOH mix (ii, 10 μg/mL), in comparison with the optimal conditions determined at 60 °C for 45 min. RRF values of the FOHs were obtained by dividing the peak area of the PFBoyl-derivatized FOH by the peak area of the surrogate, HCB. Error bars correspond to the standard deviation of the mean (n=3). RRF values in inset represent those obtained for the internal standard (17:0-OH).
3.2 Microwave-accelerated derivatization (MAD) of fatty alcohols using PFBoylCl
For high-throughput analysis, a considerable drawback of PFBoyl-derivatization can be the time-consuming reactions required. Reaction conditions of 60 °C for 45 min were deemed optimal in this study; however, typical PFBoylCl derivatizations of hydroxyl-containing compounds can range from 60 - 120 °C for 20 - 270 min [30-32]. As noted previously, attempts to derivatize FOH using shorter reaction times generally led to lower RRF values and higher standard error values in comparison to reactions performed at extended reaction times (45 min). A promising strategy for the accelerated PFBoyl-derivatization of FOH is to employ microwave heating. In previous reports, MAD has been shown to provide comparable or improved reaction yields in dramatically lower reactions times for derivatization reactions when compared to those obtained using traditional heating methods (water bath or block heaters) [36]. In the present study, the application of microwave heating was examined for PFBoylCl and its potential to provide comparable derivatization yields in reduced reaction times was examined. A comparison was made between the RRF values obtained from reactions employing the optimal water bath conditions (45 min at 60 °C) to those obtained using microwave heating (100 °C for 3 min). As shown in Figure 4, RRF values obtained as a result of water bath heating were slightly but distinctly higher compared to those obtained using the microwave heating; however, the RRF values tabulated using microwave heating were obtained in only 3 min reaction (as opposed to the RRF values obtained from reactions of 45 min using the water bath). In addition, although the reactions were performed in 3 min, the microwave reactions did not suffer from a loss in reproducibility (4 and 3%, for water bath and microwave heating RRF values, respectively). The data presented demonstrate the potential for performing microwave PFBoyl-derivatization with FOH with reduced reaction times and no corresponding loss in reproducibility.
Figure 4.
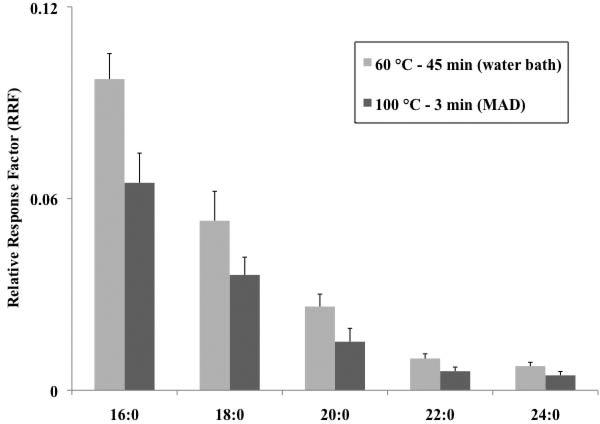
Investigation of microwave-accelerated derivatization (MAD) for the PFBoyl-derivatization of the FOH (mix i). The microwave reaction was performed in a Biotage Initiator Microwave. The microwave RRF values were compared to those obtained using the optimal reaction time and conditions using the water bath heater (60 °C for 45 minutes). RRF values of the FOHs were obtained by dividing the peak area of the PFBoyl-derivatized FOH by the peak area of the surrogate, HCB. Error bars correspond to the standard deviation of the mean (n=3).
3.3 Solvent extraction for fatty alcohol derivatization using PFBoylCl
A standard practice in analytical derivatization is to employ the derivatization reagent as the reaction medium during the reaction (assuming the analyte is soluble), followed by evaporation, reconstitution (with appropriate the GC solvent) and direct analysis by GC/MS. To our knowledge, few reports have investigated the application of employing solvent extraction [21, 30, 32]. For standard PFBoyl derivatization reactions are somewhat limited by carryover of PFBoyl reagent and PFBoyl byproducts. PFBoylCl is highly corrosive and its presence can be detrimental to the operation and lifetime of the GC syringe, injection port, and GC column. The formation of unwanted artifacts or byproducts of PFBoyl-derivatization can arise through reactions with moisture, contaminants, sample components or even degraded reagent [21, 22, 33]. While operating in SIM modes, PFBoyl derived noise can affect the sensitive detection of PFBoyl-derivatives. In addition PFBoyl-related noise, evaporation of the PFBoyl-reacted solutions were extremely slow (up to 20 min for 200 μL) and thus limited its application as a high throughput technique. In addition, the inability to rapidly evaporate the solution allowed the potential for the PFBoyl-reaction to continue, which offers the potential to reduce reproducibility.
As an alternative approach to derivatization followed by evaporation, a liquid-liquid extraction was performed on the PFBoyl-derivatized solution in an effort to definitively stop the reaction and facilitate the removal of unwanted PFBoyl-related byproducts. Several solvents were examined, specifically solvents immiscible in water, which included petroleum ether, heptane, hexane, chloroform, DCM, and MTBE, as shown in Figure 5a. Upon inspection of the 18-carbon FOH, RRF values for the PFBoyl-derivatives obtained using the solvent extraction step showed an increase when compared to the derivatized solutions, which did not include solvent extraction. In general, the increase in RRF values followed the trend of increased solubility of the solvent in water, as shown on Figure 5a. The best two extraction solvents, DCM (1.3) and MTBE (5.1), had the highest RRF values and corresponding water solubility (g/100g) of those solvents examined in this study. A comparison to a similarly reported approach (DCM-water extraction performed after a PFBoyl-reaction of 100 °C for 45 min)[32] was performed and compared to the DCM-water extract obtained from the optimal reaction conditions previously described at 60 °C for 45 min. For the PFBoyl-derivatized 18-carbon FOH, elevated temperatures (above 60 °C) followed by DCM extraction did not yield a significant improvement in RRF values over those obtained from the optimal conditions (60 °C for 45 min). The RRF values were generally comparable; however, the RRF values obtained for the samples with the elevated temperature often had substantially higher RSD values (RSD values for the DCM-extraction following a 100 °C reaction and the DCM extraction following a 60 °C reaction were 19 and 4%, respectively). In addition to higher RRF values obtained for those reactions followed by DCM- or MTBE-water extraction, the S/N ratio was also substantially higher compared to those reactions with no solvent extraction step added (as shown in the inset in Figure 5a for 18:0-OH, the S/N ratio increase was approximately 40 to 46 times greater with DCM or MTBE-water extraction in comparison to those performed with no solvent extraction, respectively).
Figure 5a.
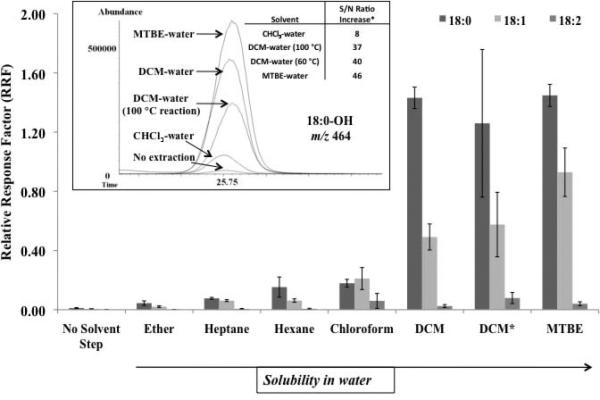
The RRF values displayed represent RRF values obtained for the PFBoyl-derivatized 18-carbon FOHs (18:0, 18:1, and 18:2, all at 10 μg/mL). The PFBoyl-FOHs were examined by several solvent-water extractions (post-derivatization). As shown, the higher the solubility in water, the higher the RRF value. The solubility values (as defined by g/100g water) for each solvent were petroleum ether (0), heptane (0.01), hexane (0.014), chloroform (0.795), DCM (1.32), and MTBE (5.1). In the inset, the peak for 18:0 is shown for each solvent extraction employed post-heating, along with a S/N ratio increase (calculated by dividing the S/N ratio of the peak obtained by the solvent extraction method by the S/N ratio of the peak obtained using no solvent extraction). The S/N increases for hexane (8), heptane (4) and pet ether (0.5) are not shown in the figure. (*) indicated that the derivatization reaction was performed at the elevated temperature of 100 °C for 45 minutes, followed by the DCM-water extraction.
As shown in Figure 5b, in comparison to RRF values obtained with no solvent extraction step, addition of either DCM- or MTBE-water extraction produced dramatically higher RRF values for all of the FOH. In most cases, reactions employing MTBE-water extraction following derivatization resulted in the best RRF values although those treated with DCM-water extraction (at 60 °C) often had better RSD values. For all of the PFBoyl-FOH, it was shown that derivatization reactions performed at elevated temperatures (such as 100 °C) produced RRF values, in most cases, comparable to those obtained using the 60 °C reaction. However, elevated reaction temperatures produced highly irreproducible results (as shown by the high RSD values). In addition, by incorporating a solvent extraction step, evaporation times of the derivatization solution (organic layer) were remarkable reduced (< 5 min).
Figure 5b.
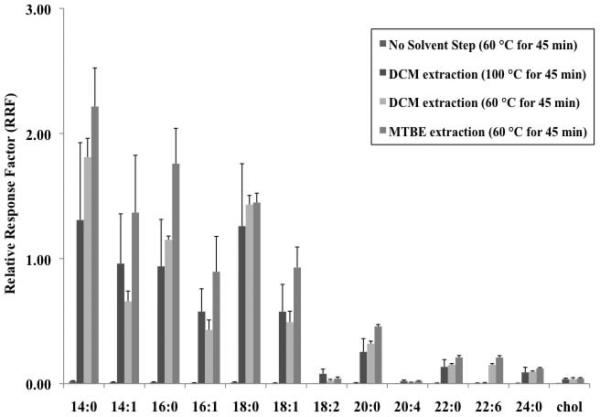
RRF values of the PFBoyl-derivatized FOH mixture (mix ii, 10 μg/mL) using three post-derivatization solvent extraction methods, specifically reactions followed by no solvent extraction step (n=3), reactions followed by a MTBE-water extraction (n=3), and reactions followed by a DCM-water (n=3). RRF values of the PFBoyl-FOHs were obtained by dividing the peak area of the PFBoyl-derivatized FOH by the peak area of the surrogate, HCB. Error bars correspond to the standard deviation of the mean.
3.4 Response curve comparison for MTBE-water, DCM-water, and no solvent extraction
For the three post-derivatization strategies (no solvent extraction, MTBE-water extraction, and DCM-water extraction), response curves were constructed and the results are shown in Table 2. For the response curves of samples with no post-derivatization solvent extraction, over the range of 1 - 100 μg/mL, the saturated FOH (14:0, 16:0, 18:0, and 20:0) linearity was observed with R2 values of 0.993, 0.999, 0.999, and 0.999, respectively. The unsaturated FOH had an average R2 value of 0.961 (for 14:1, 16:1, 18:1 and 18:2). In addition, the FOH 18:2 and 14:1, were not detected below 5 μg/mL. The average RSD value for all of the PFBoyl-FOH response curve samples was 16%.
Table 2.
The calibration range (in μg/mL) and R2 values for the PFBoyl-derivatized FOH response curve mixture using the three post-derivatization strategies
| No Solvent Extraction | DCM-water Extraction | MTBE-water extraction | ||||
|---|---|---|---|---|---|---|
| Range | R2 | Range | R2 | Range | R2 | |
| 14:0 | 1-100 | 0.993 | 1-50 | 0.998 | 1-50 | 0.990 |
| 14:1 | 5-100* | 0.956 | 5-50* | 0.972 | 1-50 | 0.991 |
| 16:0 | 1-100 | 0.999 | 1-50 | 0.966 | 1-50 | 0.994 |
| 16:1 | 1-100 | 0.973 | 5-50* | 0.987 | 1-50 | 0.995 |
| 18:0 | 1-100 | 0.999 | 1-50 | 0.889 | 1-50 | 0.997 |
| 18:1 | 1-100 | 0.962 | 1-50 | 0.992 | 1-50 | 0.997 |
| 18:2 | 10-100* | 0.957 | 5-50* | 0.997 | 1-50 | 0.990 |
| 20:0 | 1-100 | 0.999 | 1-50 | 0.904 | 1-50 | 0.987 |
Response curves were performed for the three post-derivatization strategies (no solvent extraction step, MTBE-water extraction, and DCM-water extraction). The concentration range for the no solvent extraction step had levels of 1, 5, 10, 50, and 100 μg/mL, while the DCM- and MTBE-water extraction curves had concentration levels of 1, 5, 10, 20, and 50 μg/mL. Although detected, the FOH 20:4, 22:6, and cholesterol were not linear over most of the concentration range for any of the post-derivatization methods employed.
indicates that these FOH were reliably detected below this concentration level. 17:0-OH was used as the internal standard.
Response curve samples, which were extracted by solvent following derivatization heating, had an average RSD for DCM and MTBE-water extractions over the concentration ranges of 1 - 50 μg/mL of 14 and 14%, respectively. Response curves constructed for the DCM-water extraction had an average R2 value of 0.963. In addition, the FOH 14:1, 16:1, and 18:2 were not detected below 5 μg/mL. Response curves performed for PFBoyl-derivatized standards extracted with MTBE-water resulted in the most linear method for both saturated and unsaturated FOH (average R2 value of 0.993). For the MTBE-water extractions, all of the FOH listed in the table were detected and linear over the range, unlike the DCM-water and no solvent extraction samples. Furthermore, for FOH standards analyzed at concentrations below the response curve (at 700 ng/mL), the MTBE-water extraction had S/N values (on average, n=3) ten times greater than the S/N values measured for the DCM-water extraction (data not shown). Although detected, the FOH 20:4, 22:6, and cholesterol were not linear over most of the concentration range for any of the post-derivatization methods employed.
3.5 Analysis of fatty alcohols in rat plasma
The methods developed with synthetic FOH were next applied to biological samples to compare post-derivatization preparation techniques. The RRF values of the PFBoyl-FOH obtained from the post-derivatization solvent extraction were compared to those obtained from samples in which no solvent extraction was performed. Previous studies have shown that using Bligh-Dyer extraction, the predominant FOH measured in animal and human samples are 16:0, 18:0, and 18:1 [3, 6, 50]. Plasma levels of FOH in biological samples are typically expressed as a percentage of total FOH. In humans, plasma FOH levels range from 10 to 400 ng/ml, with the higher levels observed in humans with Sjögren-Larsson syndrome [6, 8]. For example, in unaffected humans 16:0- and 18:0-OH plasma levels are 10 and 7 ng/ml, respectively [6]. However, in humans with Sjögren-Larsson syndrome 16:0- and 18:0-OH plasma levels are 92 and 150 ng/ml, respectively [6]. While the response curves listed in Table 2 only show a range down to 1 ug/ml, saturated FOH (e.g. 16:0-OH, 18:0-OH) can be detected at concentrations of 100 ng/ml and below using the MTBE-water extraction method, and thus this measure should be employed for these analyses in human plasma.
As shown in Figure 6, the MTBE-water extraction methods had significantly larger FOH peaks (for 16:0 and 18:0) and higher S/N ratios (12 and 6x greater, MTBE, respectively) for rat plasma FOHs compared to those obtained without the use of solvent extraction. The S/N ratios were comparable for the DCM-water and MTBE-water extractions of PFBoyl-cholesterol, when compared to those obtained without the use of solvent extraction. However, even though DCM-water and MTBE-water extraction methods had similar increases in S/N in comparison to the S/N obtained from the no solvent extraction method, the chromatographic baseline levels for the DCM-water extractions were much higher than those for the MTBE-water extraction (on average, 2.5× greater), thus hampering its ability to detect PFBoyl-FOH at low concentration levels (data not shown). For the analysis of cholesterol, even at high concentrations, both the DCM-water and MTBE-water extractions had higher S/N ratios than those obtained without solvent extraction. We did not detect 18:1 fatty alcohol in rat plasma.
Figure 6.
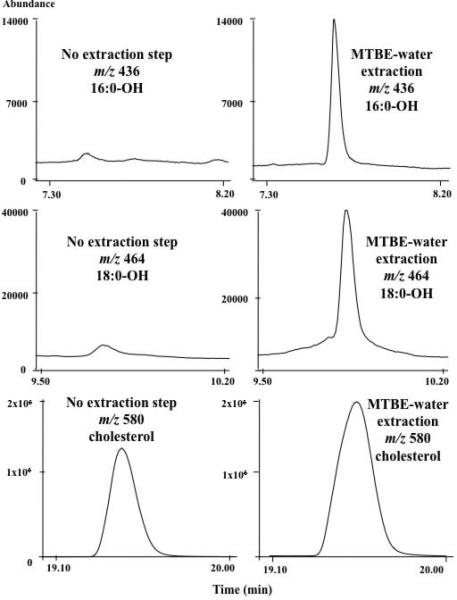
Chromatogram of PFBoyl-derivatized 18:0-OH (m/z 464), 16:0-OH (m/z 436), and cholesterol (m/z 580) detected in rat plasma (100 μL) by GC/ECNICI-MS using the no solvent extraction and MTBE-water extraction post-derivatization treatment. The rat plasma was Bligh-Dyer extracted and derivatized using PFBoylCl at 60 °C for 45 min.
4. Conclusion
PFBoyl-derivatization is useful for the sensitive detection of FOH; however, the lack of established reaction protocols, the time-consuming reaction times, and the presence of PFBoyl-related noise, can often hinder analysis. In this study, optimal PFBoyl-derivatization conditions (reaction time and temperature) were evaluated and presented (60 °C for 45 min). The reaction conditions were examined on a variety of FOH standards (differing in chain length and number of double bonds) and careful analyses of these reaction protocols provided insight into the optimal conditions required for FOH on an individual and comprehensive level. Two strategies aimed at reducing the PFBoyl-related drawbacks, extended reaction times and high PFBoyl-related noise, were also investigated. To reduce reaction times, the use of MAD provided slightly lower RRF values when compared to those obtained using traditional heating methods; however, reactions were performed in 3 minutes and did not exhibit an increase in RSD. The data presented clearly indicate that with further optimization, microwave derivatization reactions may offer the potential to be a more efficient heating mechanism. The detrimental effects of employing PFBoylCl derivatization reagent (such as its corrosive nature or the formation of PFBoyl-related noise), were reduced using a solvent extraction step implemented post-derivatization. DCM-water and MTBE-water extractions were successful in generating improved RRF values for the PFBoyl-FOH derivatives. Both methods showed an overall increase in RRF values and S/N ratios when compared to those obtained from the method employing no solvent extraction step. However, the MTBE-water extraction was the only method capable of providing quantitative analyses for both saturated and unsaturated FOH over the concentration ranges examined. MTBE was also able to detect PFBoyl-FOH at lower concentrations, in comparison to the DCM-water extraction and no solvent extraction methods. In addition, the MTBE-water extraction provided a rapid evaporation step and was a less harmful alternative to the DCM-water extraction. The improvements in PFBoyl-FOH detection, associated with employing the post-derivatization solvent extraction methods, were further validated in the analysis of BD-extracted rat plasma.
Acknowledgements
The authors would like to thank Devon Mahn and Aaron Miller for their help with sample preparation. The authors would also like to thank Biotage for use of the Initiator Microwave Synthesizer. This research was supported by NIH grants HL074214, HL088073 and HL098907 (DAF).
Footnotes
Publisher's Disclaimer: This is a PDF file of an unedited manuscript that has been accepted for publication. As a service to our customers we are providing this early version of the manuscript. The manuscript will undergo copyediting, typesetting, and review of the resulting proof before it is published in its final citable form. Please note that during the production process errors may be discovered which could affect the content, and all legal disclaimers that apply to the journal pertain.
References
- 1.Mahadevan V. Prog. Chem. Fats Lipids. 1978;15:255. doi: 10.1016/0079-6832(77)90010-6. [DOI] [PubMed] [Google Scholar]
- 2.Takahashi T, Schmid HHO. Chem. Phys. Lipids. 1970;4:243. doi: 10.1016/0009-3084(70)90056-3. [DOI] [PubMed] [Google Scholar]
- 3.Blank M, Snyder F. Lipids. 1970;5:337. doi: 10.1007/BF02531466. [DOI] [PubMed] [Google Scholar]
- 4.Rizzo WB, Craft DA, Dammann AL, Phillips MW. J. Biol. Chem. 1987;262:17412. [PubMed] [Google Scholar]
- 5.Rizzo WB. Mol. Genet. Metabol. 1998;65:63. doi: 10.1006/mgme.1998.2728. [DOI] [PubMed] [Google Scholar]
- 6.Rizzo WB, Craft DA. J. Lipid Res. 2000;41:1077. [PubMed] [Google Scholar]
- 7.Su KL, Schmid HHO. J. Lipid Res. 1972;13:452. [PubMed] [Google Scholar]
- 8.Rizzo WB, Dammann AL, Craft DA, Black SH, Tilton AH, Africk D, Chaves-Carballo E, Holmgren G, Jagell S. J. Pediatr. 1989;115:228. doi: 10.1016/s0022-3476(89)80070-8. [DOI] [PubMed] [Google Scholar]
- 9.Gordon N. Dev. Med. Child Neurol. 2007;49:152. doi: 10.1111/j.1469-8749.2007.00152.x. [DOI] [PubMed] [Google Scholar]
- 10.Schrakamp G, Schalkwijk CG, Schutgens RB, Wanders RJ, Tager JM, van den Bosch H. J. Lipid Res. 1988;29:325. [PubMed] [Google Scholar]
- 11.Motte JC, Windey R, Delafortrie A. J. Chromatogr. A. 1996;728:333. [Google Scholar]
- 12.Takechi H, Goto Y, Machida M. Chem. Pharm. Bull. 1998;46:159. [Google Scholar]
- 13.Johnson DW. J. Mass Spectrom. 2001;36:277. doi: 10.1002/jms.125. [DOI] [PubMed] [Google Scholar]
- 14.Barry SJ, Carr RM, Lane SJ, Leavens WJ, Manning CO, Monté S, Waterhouse I. Rapid Commun. Mass Spectrom. 2003;17:484. doi: 10.1002/rcm.933. [DOI] [PubMed] [Google Scholar]
- 15.Dunphy JC, Pessler DG, Morrall SW, Evans KA, Robaugh DA, Fujimoto G, Negahban A. Environ. Sci. Technol. 2001;35:1223. doi: 10.1021/es001491q. [DOI] [PubMed] [Google Scholar]
- 16.Quirke JME, Adams CL, Van Berkel GJ. Anal. Chem. 1994;66:1302. [Google Scholar]
- 17.Quirke JME, Van Berkel GJ. J. Mass Spectrom. 2001;36:179. doi: 10.1002/jms.119. [DOI] [PubMed] [Google Scholar]
- 18.Quirke JME, Hsu Y-L, Van Berkel GJ. J. Nat. Prod. 2000;63:230. doi: 10.1021/np990407l. [DOI] [PubMed] [Google Scholar]
- 19.Harvey DJ, Tiffany JM, Duerden JM, Pandher KS, Mengher LS. J. Chromatogr. B. 1987;414:253. doi: 10.1016/0378-4347(87)80051-8. [DOI] [PubMed] [Google Scholar]
- 20.Nicholson JD. The Analyst. 1978;103:193. [Google Scholar]
- 21.Blau K, King GS. Handbook of Derivatives for Chromatography. Heyden & Son, Ltd.; Philadelphia: 1978. [Google Scholar]
- 22.Knapp DR. Handbook of Analytical Derivatization Reactions. Wiley and Sons; New York: 1979. [Google Scholar]
- 23.Akre C, Fedeniuk R, MacNeil JD. Analyst. 2004;129 doi: 10.1039/b313274a. [DOI] [PubMed] [Google Scholar]
- 24.Xiao X-Y, McCalley DV, McEvoy J. J. Chromatogr. A. 2001;923:195. doi: 10.1016/s0021-9673(01)00955-4. [DOI] [PubMed] [Google Scholar]
- 25.Schwertner HA, Johnson ER, Lane TE. Clin. Chem. 1990;36:519. [PubMed] [Google Scholar]
- 26.Gashkoff P, Matalon R, Papa V, Sebasta D. Biol. Mass Spectrom. 1988;16:327. doi: 10.1002/bms.1200160163. [DOI] [PubMed] [Google Scholar]
- 27.Chung L-W, Lin K-L, Yang TC-C, Lee M-R. J. Chromatogr. A. 2009;1216:4083. doi: 10.1016/j.chroma.2009.03.020. [DOI] [PubMed] [Google Scholar]
- 28.Kuch HM, Ballschmiter K. Environ. Sci. Technol. 2001;35:3201. doi: 10.1021/es010034m. [DOI] [PubMed] [Google Scholar]
- 29.Allmyr M, McLachlan MS, Sandborgh-Englund G, Adolfsson-Erici M. Anal. Chem. 2006;78:6542. doi: 10.1021/ac060666x. [DOI] [PubMed] [Google Scholar]
- 30.Alugupalli S, Larsson L. J. Gen. Microbiol. 1992;138:2499. doi: 10.1099/00221287-138-12-2499. [DOI] [PubMed] [Google Scholar]
- 31.Wildsmith KR, Albert CJ, Anbukumar DS, Ford DA. J. Biol. Chem. 2006;281:16849. doi: 10.1074/jbc.M602505200. [DOI] [PubMed] [Google Scholar]
- 32.Wolf BA, Conrad-Kessel W, Turk J. J. Chromatogr. 1990;509:325. doi: 10.1016/s0021-9673(01)93090-0. [DOI] [PubMed] [Google Scholar]
- 33.Weintraub ST, Satsangi RK, Sprague EA, Prihoda TJ, Pinckard RN. J. Am. Soc. Mass Spectrom. 2000;11:176. doi: 10.1016/S1044-0305(99)00135-X. [DOI] [PubMed] [Google Scholar]
- 34.Bowden JA, Colosi DM, Mora-Montero DC, Garrett TJ, Yost RA. J. Chromatogr. B. 2009;877:3237. doi: 10.1016/j.jchromb.2009.08.005. [DOI] [PubMed] [Google Scholar]
- 35.Shareef A, Angove MJ, Wells JD. J. Chromatogr. A. 2006;1108:121. doi: 10.1016/j.chroma.2005.12.098. [DOI] [PubMed] [Google Scholar]
- 36.Söderholm S, Damm M, Kappe C. Mol. Divers. 2010 doi: 10.1007/s11030-010-9242-9. Epub ahead of print. [DOI] [PubMed] [Google Scholar]
- 37.Agatha G, Kauf E. Clin. Lab. 1999;45:387. [Google Scholar]
- 38.Bowden JA, Colosi DM, Stutts WL, Mora-Montero DC, Garrett TJ, Yost RA. Anal. Chem. 2009;81:6725. doi: 10.1021/ac900663c. [DOI] [PubMed] [Google Scholar]
- 39.Zuo Y, Zhang K, Lin Y. J. Chromatogr. A. 2007;1148:211. doi: 10.1016/j.chroma.2007.03.037. [DOI] [PubMed] [Google Scholar]
- 40.Deng C, Yin X, Zhang L, Zhang X. Rapid Commun. Mass Spectrom. 2005;19:2227. doi: 10.1002/rcm.2052. [DOI] [PubMed] [Google Scholar]
- 41.Strassnig S, Wenzl T, Lankmayr EP. J. Chromatogr. A. 2000;891:267. doi: 10.1016/s0021-9673(00)00642-7. [DOI] [PubMed] [Google Scholar]
- 42.Chávez G, Bravo B, Piña N, Arias M, Vivas E, Ysambertt F, Márquez N, Cáceres A. Talanta. 2004;64:1323. doi: 10.1016/j.talanta.2004.05.055. [DOI] [PubMed] [Google Scholar]
- 43.Chu T-Y, Chang C-H, Liao Y-C, Chen Y-C. Talanta. 2001;54:1163. doi: 10.1016/s0039-9140(01)00392-7. [DOI] [PubMed] [Google Scholar]
- 44.Damm M, Rechberger G, Kollroser M, Kappe CO. J. Chromatogr. A. 2009;1216:5875. doi: 10.1016/j.chroma.2009.06.035. [DOI] [PubMed] [Google Scholar]
- 45.Dasgupta A, Macaulay R. J. Chromatogr. A. 1995;695:136. [Google Scholar]
- 46.Lew A, Krutzik PO, Hart ME, Chamberlin AR. J. Comb. Chem. 2001;4:95. doi: 10.1021/cc010048o. [DOI] [PubMed] [Google Scholar]
- 47.Nüchter M, Ondruschka B, Bonrath W, Gum A. Green Chem. 2004;6:128. [Google Scholar]
- 48.Kappe C. Chem. Soc. Rev. 2008;37:1127. doi: 10.1039/b803001b. [DOI] [PubMed] [Google Scholar]
- 49.Bligh EG, Dyer WJ. Can. J. Physiol. Pharmacol. 1959;37:911. doi: 10.1139/o59-099. [DOI] [PubMed] [Google Scholar]
- 50.Bishop JE, Hajra AK. J. Biol. Chem. 1981;256:9542. [PubMed] [Google Scholar]