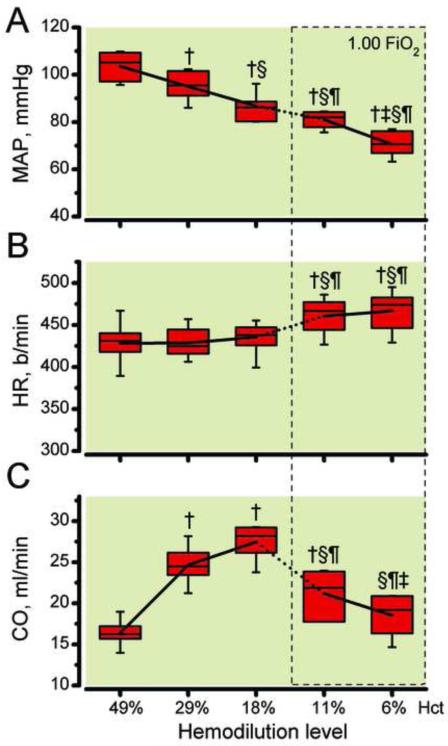
Figure 2.
A. Mean arterial pressure (MAP), B. heart rate (HR) and C. cardiac output (CO) as hemodilution progresses to 6% hematocrit. FiO2, fraction of inspired oxygen. †, P < 0.05 compared to baseline; §, P < 0.05 compared to 29% hematocrit; ¶, P < 0.05 compared to 18% hematocrit; ‡, P < 0.05 compared to 11% hematocrit.

