Abstract
We investigated the efficacy of the antihypertensive drug telmisartan (Tel) and the mechanisms underlying the progression from simple steatosis to nonalcoholic steatohepatitis (NASH) in a medaka (Oryzias latipes) NASH model. We used the NASH activity score (NAS) developed in humans to assess the histology of the medaka NASH model and found that NAS increased with time. Further, TUNEL-positive apoptosis hepatocytes were found in the medaka NASH model. Tel administration resulted in the increased expression of liver peroxisome proliferator-activated receptor-γ, carnitine palmitoyltransferase 1 and acyl-CoA oxidase 1 and decreased the number of 8-hydroxydeoxyguanosine-positive hepatocytes and the migration of macrophages positive for diastase-periodic-acid-Schiff. Medaka NAS was improved by Tel administration but fatty acid content was not affected. Tel reduced the infiltration of macrophages into the liver and ameliorated NASH pathology.
Keywords: Nonalcoholic steatohepatitis, Telmisartan, Macrophage, Apoptosis, Medaka, Oryzias latipes (Teleostei)
Introduction
The number of patients worldwide with nonalcoholic fatty liver disease (NAFLD) has been increasing in recent years. NAFLD is defined as fatty liver (steatosis) occurring in the absence of a history of alcohol abuse. NAFLD is closely linked to obesity, diabetes, hyperlipidaemia and insulin resistance and is considered to represent a hepatic manifestation of metabolic syndrome (Powell et al. 1990; Sanyal 2002). NAFLD can be classified into either nonprogressive simple steatosis or nonalcoholic steatohepatitis (NASH) with inflammation, ballooning degeneration and fibrosis (Schaffner and Thaler 1986; Younossi et al. 1998). NASH is a progressive chronic liver disease that can develop into cirrhosis of the liver and liver cancer; it occurs with high frequency in obese individuals and in type 2 diabetes patients and is thought to represent a hepatic manifestation of metabolic syndrome. No effective treatments have yet been established for NASH, and the mechanisms underlying the progression from simple steatosis to NASH have not been fully clarified.
Previous studies of NASH have made extensive use of murine models such as mice or rats but the use of small fish such as zebrafish (Danio rerio) is now common. Medaka (Oryzias latipes) is a small fish, like zebrafish (Chu and Chiu 2008; Terai 2010), that is found in Japan and continental Asia. Numerous pure medaka bloodlines have been used in Japan as model animals (Masahito et al. 1989). Compared with murine models, medaka is highly fecund, rapidly maturing, and small, thus reducing cost and space requirements. Further, the mapping of the medaka genome has been completed and methods for producing transgenic and knockout individuals have been established, fulfilling the requirements of an animal model (Kasahara et al. 2007). We have previously observed that feeding medaka a high-fat diet (HFD) results in liver histology resembling that of human NASH and we have reported this as a novel medaka NASH model (Matsumoto et al. 2010). Administration of n3 polyunsaturated fatty acids (n3 PUFAs) to this medaka NASH model ameliorates steatosis, indicating that this model is useful for the investigation of drug effectiveness (Matsumoto et al. 2010). Mutant lines with liver steatosis have been developed in zebrafish (foie gras mutant) and medaka (Kendama mutant) with forward genetic screening by using N-ethyl-N-nitrosourea treatment (Sadler et al. 2005; Watanabe et al. 2004). Medaka fish and zebrafish will be good models for the analysis of NASH pathology but, at present, our developed medaka NASH model is the only one to show similarity with human NASH (Matsumoto et al. 2010).
In the present study, we have used the medaka NASH model to investigate the efficacy of the antihypertensive drug telmisartan (Tel). This drug blocks angiotensin II type 1 receptors, excites peroxisome proliferator-activated receptor (PPAR)-γ and has been reported to improve glycolipid metabolism. We have also found that Tel administration ameliorates hepatic fibrosis induced in a model fed with a choline-deficient L-amino-acid-defined diet (Jin et al. 2007). NASH progression can be evaluated in clinical settings by means of the NAFLD activity score (NAS); this score (more precisely termed the medaka NAS; MNAS) has been employed in the present study to examine the pathological condition presented by NASH and to clarify changes in this condition. We have used the medaka NASH model to investigate the involvement of macrophages in the progression of NASH pathology.
Materials and methods
Animals and diets
Himedaka Cab fish (an orange-red variety of medaka) at 8 weeks old were used for most experiments. Fish were maintained in accordance with the Animal Care Guidelines of Yamaguchi University. During experiments, fish in groups of 10 were kept in tap water in plastic tanks covered with plastic covers and illuminated with fluorescent light from 08:00 to 22:00. Temperature was controlled at 26±1°C. Each tank was supplied with 200 mg food, daily, and all provided food was consumed within 14 h. The energy content of the control diet (Hikari Crest; Kyorin, Hyogo, Japan) was 3.3 kcal/g with 25.3% from fat, 62.5% from protein and 13.8% from carbohydrates, plus vitamins and minerals as recommended. The energy content of the HFD (HFD32; CLEA Japan, Tokyo, Japan) was 5.1 kcal/g with 56.7% from fat, 20.1% from protein and 23.2% from carbohydrates, plus vitamins and minerals as recommended. The fatty acid composition was as shown previously with a ratio of n3/n6 PUFAs of 0.02 (Matsumoto et al. 2010). Tel was dissolved in dimethyl sulfoxide to a concentration of 2 mg/ml prior to administration to the test tank at a final concentration of 1 mg/l.
Tissue collection and histology
Fish were killed and opened from the anal vent to the gills. The entire body was fixed with 4% paraformaldehyde in 0.1 M phosphate buffer (PB). The liver was dissected, dehydrated in alcohol and embedded in paraffin according to routine procedures. Serial sections were made at a thickness of 3-5 μm. Staining was performed by using haematoxylin and eosin (HE). The number of diastase-periodic-acid-Schiff (D-PAS)-positive cells per liver section (a single field of view at 400× magnification) was used to assess macrophage infiltration with inflammation (Brunt 2001).
Immunohistochemical examination and TUNEL assay
CD68 as a marker for macrophages and 8-hydroxydeoxy-guanosine (8-OHdG) for the detection of oxidative stress were immunohistochemically assessed by using the avidin-biotin-peroxidase complex method, as described previously (Kolak et al. 2007; Sakaida et al. 1994). The TUNEL (terminal deoxynucleotidyl transferase-mediated dUTP nick-end labelling) assay was performed by using a commercially available kit (In Situ Cell Death Detection Kit; Roche Diagnostics, Indianapolis, Ind., USA) according to the manufacturer’s instructions. Hepatocyte apoptosis in liver sections was quantified by counting the number of TUNEL-positive cells in random microscopic low-power fields (×100).
Blood analysis
Blood samples were obtained from medaka following a 12-h fast. Fish were kept on ice for 1–2 min and then bled by cutting a ventral portion of the tail fin. Blood was collected in a microcapillary tube and the collected volume was measured. Blood samples were kept at room temperature for 1 h before centrifugation at 1200g for 30 min at 4°C. Serum triglyceride concentrations were measured by using a Fuji Drychem 3500 auto-analyser (Fujifilm, Tokyo, Japan). Cholesterol and triglyceride (TG) profiles in total lipoproteins were analysed by means of a dual-detection high-performance liquid chromatography system with two tandem-connected TSK gel LipopropakXL columns (300×7.8 mm; Tosoh, Tokuyama, Japan) by Skylight Biotech (Akita, Japan).
Fatty acid analysis
The fatty acid composition of homogenized liver tissue (20 mg tissue/ml saline) was determined by capillary gas chromatography. Total lipids were extracted by using the procedure described by Folch et al. (1957) and fatty acids were methylated with boron trifluoride and methanol. Methylated fatty acids were analysed by using a GC-17A gas chromatograph (Shimadzu, Kyoto, Japan) equipped with a BPX70 capillary column (0.25 mm internal diameter × 30 mm; SGE International, Melbourne, Australia). Tricosanoic acid (C23:0) was used as the internal standard. The minimum detectable fatty acid concentration detected by this assay was 0.5 μg/ml.
Semi-quantitative real-time polymerase chain reaction
To avoid the acute effects of food intake, fish were fasted overnight prior to being killed. Total RNA was extracted from resections of the liver and purified by using the RNeasy kit (Qiagen, Hilden, Germany). Next, cDNAs were synthesized by using purified RNA with random hexamers in the Transcriptor First Strand cDNA synthesis kit (Roche, Indianapolis, Ind., US). Semi-quantitative real-time (RT) polymerase chain reaction (PCR) was performed with PCR master mix (Promega, Madison, Wis., US) and the primers are listed in Table 1. Gene expression levels were normalized against β-actin as an endogenous positive control; acetyl-CoA carboxylase (ACC) 1, carnitine palmitoyltransferase (CPT) 1, acyl CoA oxidase (ACO) 1, PPAR-γ and fatty acid synthase (FAS) were analysed.
Table 1.
Lists of primers for selected genes (ACC1 acetyl-CoA carboxylase 1, ACO1 acyl CoA oxidase 1, CPT1 carnitine palmitoyltransferase 1, FAS fatty acid synthase, PPAR-γ peroxisome proliferator-activated receptor-γ)
| Gene | Forward primer (5′ to 3′) | Reverse primer (3′ to 5′) |
|---|---|---|
| ACC1 | GAGTGACGTCCTGCTTGACA | ACCTTTGGTCCACCTCACAG |
| ACO1 | GCTCAGCTTTACAGCCTTGG | GGACGATTCCCTAACGATCA |
| CPT1 | ATGTCTACCTCCGTGGACGA | CAAGTTTGGCCTCTCCTTTG |
| FAS | GACGCTTCAGGAAATGGGTA | GGACAGGAACCGGACTATCA |
| PPAR-γ | ACGCTTCCATTTCCTCCTCT | GACAGTGAAGGTCGCAGTGA |
| β-Actin | CTGGACTTCGAGCAGGAGAT | GCTGGAAGGTGGACAGAGAG |
Statistical analyses
Numerical data are expressed as the mean ± standard deviation. Student’s t-test was performed to assess statistical significance among treatment groups. Differences were considered significant at P<0.05.
Results
Development of steatosis and inflammation of liver tissue in medaka NASH model and NAS evaluation
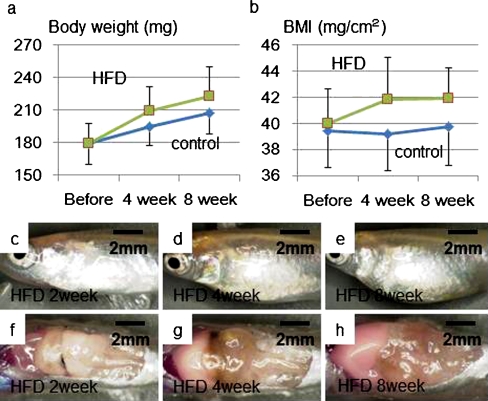
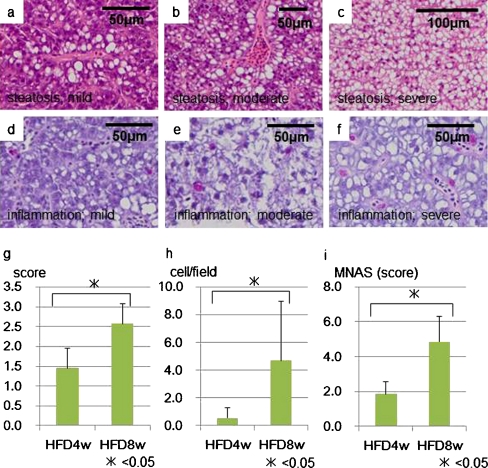
Medaka in the HFD group had a higher body weight and body mass index (BMI) than the control group fed on a normal diet. Gross evaluation of the liver showed a whitish hue developing over time in the HFD group (Fig. 1). Hepatic steatosis was assessed by scoring HE-stained liver sections. A three-stage scoring system was used: mild (score 1), fat development confined to the areas surrounding blood vessels; moderate (score 2), midway between mild and severe; severe (score 3), diffuse hepatic steatosis. The score after 4 weeks of HFD administration was 1.5±0.8, which increased to 2.6±0.8 after 8 weeks, indicating the progression of steatosis. The number of D-PAS-positive cells was 0.6±0.2 after 4 weeks of HFD administration and reached 4.7±1.3 after 8 weeks, showing a clear increase in inflammatory cell infiltration (Fig. 2a-h).
Fig. 1.
The high-fat diet (HFD) group showed a higher body weight(a) and body mass index (BMI; b) than the normal diet (control) group as a result of the high fat intake. In the HFD group, distention of the abdomen increased (c-e) and the liver showed a more noticeable whitish hue (f-h) over time
Fig. 2.
Histological analysis for nonalcoholic steatohepatitis (NASH) medaka. Hepatic steatosis was assessed by scoring sections of liver stained by haematoxylin and eosin (HE) on a three-stage scoring system: mild (score 1; a); moderate (score 2; b); severe diffuse (score 3; c). After 4 weeks of HFD, the score was 1.5±0.8, increasing to 2.6±0.8 after 8 weeks, thereby indicating steatosis progression (P<0.05; g). D-PAS staining was used to assess inflammatory cell infiltration according to the number of D-PAS-positive cells per tissue section (a single field of view at 400× magnification; *P<0.05; d-f, h). The medaka NAS (MNAS) was 1.9±0.7 after 4 weeks of HFD administration and 4.9±1.5 after 8 weeks, showing a clear increase in the score over time (*P<0.05; i). The scoring system for the three parameters is summarized in Table 2
In clinical settings, the recommendation has been made to distinguish NASH from simple steatosis by using the findings of NAS, which is based on the degree of steatosis, hepatocyte ballooning and lobular inflammation. We adapted NAS to medaka by employing the MNAS (scoring criteria summarized in Table 2). Steatosis was scored according to the three-stage scoring system described above. Lobular inflammation was scored by assigning a score scheme according to the number of D-PAS-positive cells per tissue section (single field of view at 400× magnification). Hepatocyte ballooning was scored as 1 for a small number of cells showing ballooning and 2 for a marked number of cells showing ballooning. MNAS was 1.9±0.7 after 4 weeks of HFD administration and 4.9±1.5 after 8 weeks, showing a clear increase over time (Fig. 2i).
Table 2.
Critera for nonalcoholic fatty liver disease (NAFLD) activity score (NAS) in medaka
| Parameter | Definition | NAS |
|---|---|---|
| Steatosis | None | 0 |
| Mild | 1 | |
| Moderate | 2 | |
| Severe | 3 | |
| Inflammation | ×400 0-1 | 0 |
| ×400 2-3 | 1 | |
| ×400 4-5 | 2 | |
| ×400 5 or greater | 3 | |
| Ballooning | None | 0 |
| Several | 1 | |
| Large number | 2 |
Tel suppresses weight gain in the medaka NASH model
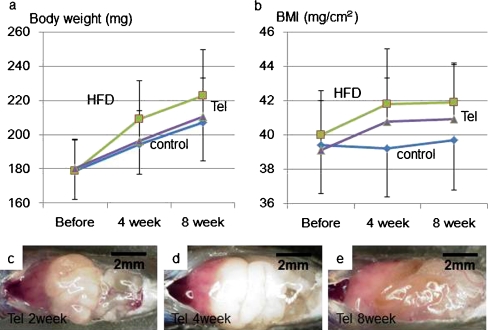
Compared with the HFD group, a lower weight gain was observed in the Tel group. Likewise, the increase in BMI was less in the Tel group. A comparison of the gross appearance of the liver also showed less steatosis in the Tel group than in the HFD group (Fig. 3).
Fig. 3.
Weight gain in the telmisartan (Tel) group was attenuated compared with that in the HFD group (a). Likewise, the BMI increase was also attenuated in the Tel group compared with the HFD group (b). A comparison of the gross appearance of livers also showed less steatosis in the Tel group (c–e) than in the HFD group (Fig. 1c-h)
Tel suppresses development of steatosis and inflammation in the medaka NASH model and improves MNAS
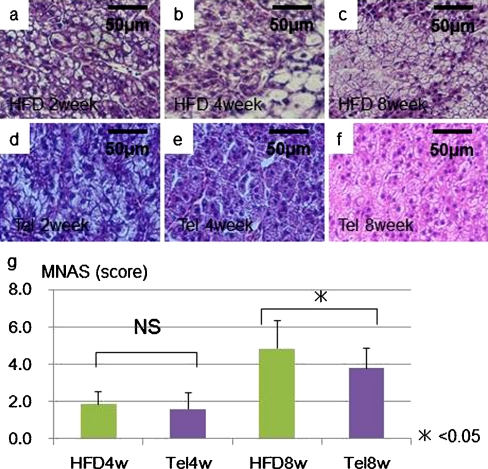
The histological investigation revealed the deposition of lipid droplets in hepatocytes after 2 weeks, with lipid deposition becoming striking and clear cell formation being found after 4 weeks on the HFD. Degenerated hepatocytes were found at 8 weeks. In the Tel group with administration at 1 ppm, hepatic steatosis was reduced. No mortality or effects on mobility were found in the Tel group (Fig. 4a-f). Compared with the HFD group, the Tel group showed ameliorated steatosis and inflammatory cell infiltration. MNAS was significantly improved in the Tel group (1.6±0.9 after 4 weeks, 3.8±1.0 after 8 weeks) compared with the HFD group (1.9±0.7 after 4 weeks, 4.9±1.5 after 8 weeks; Fig. 4g).
Fig. 4.
Medaka histology demonstrated lipid droplet deposition in hepatocytes after 2 weeks of HFD (a). Lipid deposition in hepatocytes was striking and clear cell formation was observed after 4 weeks (b). Degenerated hepatocytes were seen at 8 weeks (c). In the Tel group (1 ppm), hepatic steatosis was attenuated over the same period (d–f). In terms of MNAS, a significant difference was seen between the Tel group (1.6±0.9 after 4 weeks [Tel4w], 3.8±1.0 after 8 weeks [Tel8w], P<0.05) and the HFD group (1.9±0.7 after 4 weeks [HFD4w], 4.9±1.5 after 8 weeks [HFD8w], P<0.05) with the Tel group showing improved MNAS (Tel group after 8 weeks at 3.8±1.0 vs HFD group after 8 weeks at 4.9±1.5; *P<0.05; NS nonsignificant; g)
Blood examination in the medaka NASH model
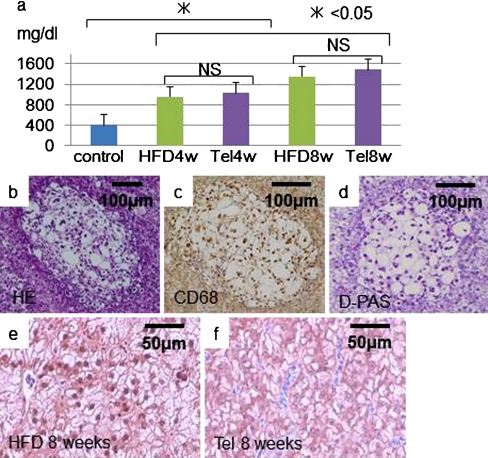
Measurement of blood levels of TG in the control, HFD and Tel groups at 4 and 8 weeks showed that TG increased over time in the HFD and Tel groups compared with the control group (Table 3). The TG level was slightly higher in the Tel group than in the HFD group (Fig. 5a). The HFD and Tel groups both showed clear increases in the amount of fatty acids in the liver at 4 weeks compared with the control group. The n3/n6 PUFA ratio was lower in the HFD and Tel groups than in the control group at 4 weeks but no differences were observed in the n3/n6 PUFA ratio between the HFD and Tel groups (Table 4).
Table 3.
Triglyceride (mg/dl) changes in medaka blood (1 sample = 10 fish; HFD high-fat diet, Tel telmisartan, w week)
| Treatment | Total | Chylomicron | Very low-density lipoprotein | Low-density lipoprotein | High-density lipoprotein |
|---|---|---|---|---|---|
| Normal | 407.4 | 6.0 | 107.9 | 38.4 | 255.1 |
| HFD4w | 955.9 | 179.6 | 353.0 | 65.0 | 358.2 |
| HFD8w | 1352.9 | 303.4 | 571.8 | 107.3 | 370.5 |
| Tel4w | 1035.1 | 188.1 | 403.2 | 91.3 | 352.6 |
| Tel8w | 1490.8 | 267.3 | 649.0 | 133.8 | 440.7 |
Fig. 5.
Blood tests for TG were carried out on the control, HFD and Tel groups at 4 and 8 weeks (a). Compared with the control group, TG increased over time in the HFD and Tel groups. The TG level of the Tel group was slightly higher than that of HFD group. We observed tissue with locally aggregated ballooning hepatocyte degeneration in some areas of medaka NASH model liver tissue (b). Cells positive for diastase-periodic-acid-Schiff (D-PAS) were found at each location (d) and cells positive for the macrophage immunostain CD68 were also found (c). The HFD group showed many more cells with nuclei positive for 8-hydroxydeoxyguanosine (e) compared with the Tel group (f)
Table 4.
Fatty acid composition of total lipids in livers of control, HFD medaka and HFD+Tel medaka (1 sample = 10 fish; SFA saturated fatty acid, MUFA mono-unsaturated fatty acid, PUFA polyunsaturated fatty acid)
| Fatty acid (mol%) | Control | HFD | HFD+Tel |
|---|---|---|---|
| C14 : 0 | 3.0 | 16.2 | 14.3 |
| C16 : 0 | 48.6 | 179.4 | 202.4 |
| C18 : 0 | 25.8 | 53.9 | 55.2 |
| C16 : 1 n-7 | 3.9 | 41.7 | 50.8 |
| C18 : 1 n-9 | 25.1 | 514.1 | 533.9 |
| C20 : 3 n-9 | 0.7 | 17.1 | 16.7 |
| C18 : 2 n-6 | 11.8 | 45.0 | 52.2 |
| C18 : 3 n-6 | 1.4 | 28.2 | 35.3 |
| C20 : 3 n-6 | 2.3 | 5.5 | 3.8 |
| C20 : 4 n-6 | 11.0 | 31.9 | 32.9 |
| C18 : 3 n-3 | 1.1 | 1.7 | 5.2 |
| C20 : 5 n-3 | 1.8 | 0.0 | 1.1 |
| C22 : 6 n-3 | 62.1 | 28.8 | 28.1 |
| Total SFA | 78.4 | 252.5 | 275.2 |
| Total MUFA | 31.3 | 565.1 | 591.8 |
| Total PUFA | 99.9 | 164.0 | 180.5 |
| n-3 PUFA | 70.4 | 32.0 | 36.1 |
| n-6 PUFA | 28.9 | 114.9 | 127.7 |
| n-3/n-6 ratio | 2.4 | 0.3 | 0.3 |
| Total lipid (mg/g tissue) | 209.6 | 981.6 | 1047.5 |
Macrophage infiltration and oxidative stress in medaka NASH liver tissue
D-PAS staining indicated that both inflammatory cells and macrophages in the liver tissue of the medaka NASH model increased over time on HFD (Fig. 2h). Furthermore, we observed tissue with locally aggregated hepatocyte degeneration in some areas of medaka NASH model liver tissue. D-PAS-positive cells were found at each location, with CD68-positive cells at ballooning hepatocyte foci (Fig. 5b-d). The HFD group showed many cells with 8-OHdG-positive nuclei (Fig. 5e, f). Hepatocyte degeneration resembling cell ballooning, inflammatory cell (macrophage) infiltration at the same location and oxidative stress were confirmed as the constituent elements of NASH pathology in medaka NASH model liver tissue. A reduced number of CD68-positive cells, indicating a reduction in oxidative stress, was detected in the Tel group.
Induction of apoptosis in medaka steatohepatic liver
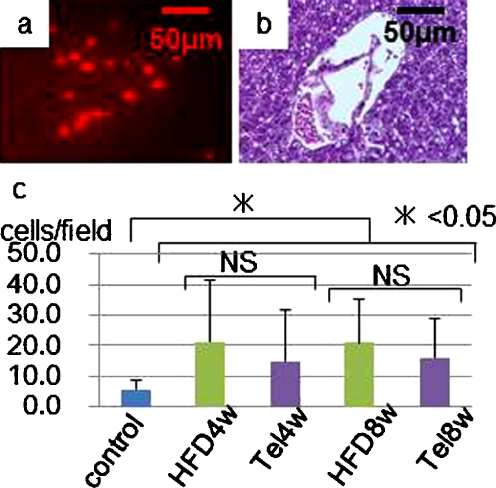
The number of apoptotic cells was greater in the HFD group than in the control group from 4 weeks as shown by TUNEL staining (Fig. 6). Apoptotic cells were observed mainly in the vicinity of blood vessels, such as the portal veins and other veins, and fewer apoptotic cells were seen in the Tel group than in the HFD group.
Fig. 6.
a Investigation of induction of apoptosis-positive cells in liver tissue by TUNEL staining. b Same tissue with HE staining. c The number of apoptotic cells was greater in the HFD group at 8 weeks than in the control group at 4 weeks (*P<0.05)
Changes in gene expression
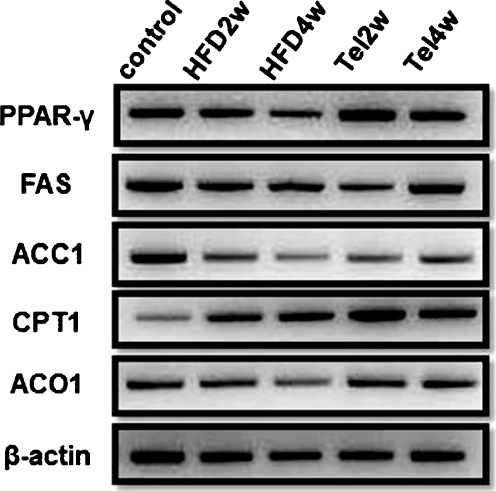
With regard to the mode of action of Tel on the liver, PPAR-γ mRNA expression increased in the Tel group (Fig. 7). RT-PCR analysis showed changes in expression for some genes involved in glycolipid metabolism and the pathway for de novo synthesis of fatty acids. The expression of FAS showed no clear changes in the HFD or Tel groups compared with the control group (Fig. 7), whereas the ACC1 genes showed reduced expression in both the HFD and Tel groups compared with the control group. The expression of CPT1, indicating β-oxidation in the mitochondria, was higher in the HFD group than in the control group and was higher still in the Tel group. The expression of ACO1, indicating β-oxidation in the peroxisomes, was lower in the HFD group than in the control group but similar levels of expression were seen in the Tel and control groups.
Fig. 7.
PPAR-γ expression increased in the Tel group. No clear changes in expression levels of FAS were found in either the HFD or Tel groups compared with the control group. ACC1 mRNA expression in both the HFD and Tel groups was lower than in the control group. CPT1 mRNA expression was higher in the HFD group than in the control group and even higher in the Tel group. ACO1 expression was lower in the HFD group than in the control group. The expression levels of ACO1 were similar in the Tel and control groups (PPAR-γ peroxisome proliferator-activated receptor-γ, FAS fatty acid synthase, ACC1 acetyl-CoA carboxylase 1, CPT1 carnitine palmitoyltransferase 1, ACO1 acyl CoA oxidase 1)
Discussion
We have previously reported the creation of a new NASH model by feeding medaka with an HFD and its use as a valid model for screening drugs (Matsumoto et al. 2010). In the present study, we were able to confirm that medaka fed HFD showed inflated abdomens and white liver and developed NASH liver (Fig. 1). Histologically, lipid droplet deposition was found in medaka hepatocytes from 2 weeks and became more marked with inflamed and degenerated hepatocytes being present from 4 weeks (Fig. 4). These results suggested that the medaka model was easily affected by diet itself. Next, we made a histological assessment of medaka liver tissue according to MNAS, based on NAS, a classification system for human NAFLD/NASH pathology in clinical settings (Kleiner et al. 2005). We confirmed that MNAS increased over time in the medaka NASH model. Moreover, liver tissue in the medaka NASH model showed fat deposition in hepatocytes and, if the hepatocyte degeneration was interpreted as ballooning, the NAFLD pathology could be assessed as type 3 according to the criteria of Matteoni et al. (1999) and could be regarded as being equivalent to the human NASH histology.
In our study, we have used this model to investigate the effects of Tel, an antihypertensive drug that acts as a partial antagonist of PPAR-γ, which has been reported to improve glycolipid metabolism. Tel has been reported to attenuate body weight gain and control fatty liver in rat and mouse NASH models (Benson et al. 2004; Schupp et al. 2005). We have performed gene expression analysis by using RT-PCR on medaka liver and found that PPAR-γ gene expression in the liver is accelerated by Tel administration. This confirms that Tel also stimulates PPAR-γ in medaka (Fig. 7). NASH pathology in medaka is ameliorated by Tel administration (Figs. 1-6), although no changes in the levels of TG or very low-density lipoprotein have been found in medaka blood. We have previously shown that n3 PUFA administration ameliorates medaka NASH and the n3/n6 PUFA ratio imbalance in liver fatty acid fractions; however, Tel administration in the present study does not seem to ameliorate the n3/n6 PUFA ratio imbalance in the liver (Table 4). Ballooning degeneration is assumed to be related to changes in the lipid composition of the fatty acid bilayer in the cellular membrane and to the n3/n6 PUFA ratio. Although no change in the n3/n6 PUFA ratio of the liver fatty acid fraction attributable to Tel administration has been found, Tel ameliorates ballooning degeneration.
The medaka NASH model shows increased liver tissue infiltration by D-PAS-positive and CD68-positive macrophages over time from the start of HFD (Figs. 2, 5b-c) but such cellular infiltrations are suppressed by Tel administration. These results suggest that the ballooning degeneration of hepatocytes might be closely regulated by macrophage infiltration. More detailed investigations of the relationship between ballooning degeneration and changes in the lipid composition of the fatty acid bilayer in the cellular membrane are needed.
These observations indicate that progression of NASH pathology is linked to the infiltration of macrophages into liver tissue and that Tel is effective as a dietary treatment to suppress such infiltration. A recent study has suggested that an increase in the number of macrophages infiltrating adipose tissue is correlated with obesity (Weisberg et al. 2003). Activated monocytes have been found in the arterial walls of humans and other animals with hypertension (Ishibashi et al. 2004; Weisberg et al. 2006). Moreover, insulin resistance and arteriosclerosis are clearly suppressed in CC chemokine receptor 2 (CCR2)-deficient mice (Ishibashi et al. 2004; Weisberg et al. 2006). Haukeland et al. (2006) report that serum concentrations of monocyte chemotactic protein 1 (MCP1) begin to increase with simple steatosis, peaking with NASH. These findings imply that macrophage infiltration plays an important role in the initiation of metabolic syndrome. MCP1 induces the migration of mononuclear leukocytes by combining with complement receptor type 2 (Fox et al. 1997). A recent study has shown that PPAR-γ agonists inhibit CCR2 expression in mononuclear leukocytes (Tanaka et al. 2005). Tel has also been reported to suppress macrophage infiltration by blocking the MCP1/CCR2 pathway in a mouse NASH model (Kudo et al. 2009). In our medaka NASH model, Tel might suppress macrophage migration to the liver.
In this medaka NASH model, oxidative stress has been evaluated by 8-OHdG immunostaining and has been found to be attenuated by Tel administration (Fig. 5e, f). Hepatocyte apoptosis has been reported as being the key to the second “hit” in the progression from simple steatosis to NASH in human NAFLD and is a significant pathological characteristic of NASH (Feldstein et al. 2003). Hepatocyte apoptosis in liver tissue from the medaka NASH model increases as a result of HFD administration, suggesting that apoptosis is linked to the progression from simple steatosis to NASH and disease development in the medaka NASH model (Fig. 6). One possible underlying mechanism is that the increased apoptosis is related to oxidative stress caused by HFD administration. In the present study, the suppression of apoptosis is greater in the Tel group than in the HFD group.
With regard to liver lipid metabolism, lipid deposited in the fatty liver is in the form of TG. This is attributable to changes in the balance between TG uptake into the liver and secretion out of the liver and to the balance between intrahepatic TG synthesis and breakdown. In our medaka NASH model, the influx of fats into the liver is likely to increase as a result of HFD; greater intrahepatic TG deposition is observed in the HFD group compared with the control group. Whereas no clear difference in FAS is apparent, the reduced expression of ACC1 in the HFD group probably indicates the decrease of de novo fatty acid synthesis pathways even within the relatively short timescale of 2–4 weeks. With respect to fatty acid oxidation pathways (CPT1 and ACO1), HFD administration appears to increase the oxidation of fatty acids, which is further increased by Tel administration. We have not assessed any direct changes of TG or lipid content of the liver in this series of experiments, despite TG deposition being the primary factor for the formation of fatty liver. However, Tel ameliorates steatosis in the liver. We have also shown that CPT1 and ACO1 expression is increased in the liver on administration of Tel. Thus, the administration of Tel may induce the β-oxidation of free fatty acids in the liver of medaka and thereby also contribute to the reduction of TG in the liver. We consider that this evidence demonstrates the effectiveness of Tel on TG or the oxidation of lipids.
In this study, we have investigated the pharmaceutical effectiveness of Tel, including its potential mechanisms of action. Tel seems to improve NASH, with the inhibition of macrophage infiltration and oxidative stress in the liver, but does not affect the n3/n6 PUFA ratio in NASH liver. These results show that Tel has a different drug effect on NASH and the n3/n6 PUFA ratio. Thus, the medaka NASH model is likely to become a significant experimental model for use in future NAFLD/NASH studies.
In conclusion, we have demonstrated that the medaka model produced on HFD exhibits the same changes as those seen in human NASH pathology. Furthermore, our study confirms that Tel has an effect on this model.
Acknowledgment
We thank Mrs. Mariko Yamada, Ms. Yoko Fukuzumi and Mrs. Isako Fujimoto for rearing the medaka used in this study.
Open Access
This article is distributed under the terms of the Creative Commons Attribution Noncommercial License which permits any noncommercial use, distribution, and reproduction in any medium, provided the original author(s) and source are credited.
Abbreviations
- ACC
acetyl CoA carboxylase
- ACO
acyl-CoA oxidase
- BMI
body mass index
- CCR2
CC chemokine receptor 2
- CPT
carnitine palmitoyltransferase
- D-PAS
diastase-periodic-acid-Schiff
- FAS
fatty acid synthase
- HE
haematoxylin and eosin
- HFD
high-fat diet
- MCP1
monocyte chemotactic protein 1
- MNAS
medaka NAS
- NAFLD
nonalcoholic fatty liver disease
- NAS
NAFLD activity score
- NASH
nonalcoholic steatohepatitis
- 8-OHdG
8-hydroxydeoxyguanosine
- PB
phosphate buffer
- PCR
polymerase chain reaction
- PPAR
peroxisome proliferator-activated receptor
- PUFA
polyunsaturated fatty acid
- RT
real-time
- Tel
telmisartan
- TG
triglyceride
Footnotes
Financial support
This study was supported by Grants-in-Aid for Scientific Research from the Japan Society for the Promotion of Science (nos. 18590737 18659209, 19590693, 19390199, 20659116, 21659189), the Knowledge Cluster Initiative, Japan, the Aerospace Exploration agency (JAXA), the Ministry of Health, Labour and Welfare and the Japan Science and Technology agency.
The authors have no competing interests to declare.
S.K., S.T. and I.S. conceived and designed the experiments. T.M., S.K., K.F., T.O. and N.Y. performed the experiments. T.M., Y.F. and Y.H. analyzed the data. M.F and H.N. contributed reagents/materials/analysis tools. S.K. and S.T. wrote the paper.
References
- Benson SC, Pershadsingh HA, Ho CI, Chittiboyina A, Desai P, Pravenec M, Qi N, Wang J, Avery MA, Kurtz TW. Identification of telmisartan as a unique angiotensin II receptor antagonist with selective PPARgamma-modulating activity. Hypertension. 2004;43:993–1002. doi: 10.1161/01.HYP.0000123072.34629.57. [DOI] [PubMed] [Google Scholar]
- Brunt EM. Nonalcoholic steatohepatitis: definition and pathology. Semin Liver Dis. 2001;21:3–16. doi: 10.1055/s-2001-12925. [DOI] [PubMed] [Google Scholar]
- Chu YC, Chiu HH. A completely imbedded fish bone presenting as an esophageal tumor-like lesion: an unusual presentation. Gastrointest Endosc. 2008;68:1190–1191. doi: 10.1016/j.gie.2008.07.020. [DOI] [PubMed] [Google Scholar]
- Feldstein AE, Canbay A, Guicciardi ME, Higuchi H, Bronk SF, Gores GJ. Diet associated hepatic steatosis sensitizes to Fas mediated liver injury in mice. J Hepatol. 2003;39:978–983. doi: 10.1016/S0168-8278(03)00460-4. [DOI] [PubMed] [Google Scholar]
- Folch J, Lees M, Sloane Stanley GH. A simple method for the isolation and purification of total lipides from animal tissues. J Biol Chem. 1957;226:497–509. [PubMed] [Google Scholar]
- Fox ES, Brower JS, Bellezzo JM, Leingang KA. N-acetylcysteine and alpha-tocopherol reverse the inflammatory response in activated rat Kupffer cells. J Immunol. 1997;158:5418–5423. [PubMed] [Google Scholar]
- Haukeland JW, Damas JK, Konopski Z, Loberg EM, Haaland T, Goverud I, Torjesen PA, Birkeland K, Bjoro K, Aukrust P. Systemic inflammation in nonalcoholic fatty liver disease is characterized by elevated levels of CCL2. J Hepatol. 2006;44:1167–1174. doi: 10.1016/j.jhep.2006.02.011. [DOI] [PubMed] [Google Scholar]
- Ishibashi M, Hiasa K, Zhao Q, Inoue S, Ohtani K, Kitamoto S, Tsuchihashi M, Sugaya T, Charo IF, Kura S, Tsuzuki T, Ishibashi T, Takeshita A, Egashira K. Critical role of monocyte chemoattractant protein-1 receptor CCR2 on monocytes in hypertension-induced vascular inflammation and remodeling. Circ Res. 2004;94:1203–1210. doi: 10.1161/01.RES.0000126924.23467.A3. [DOI] [PubMed] [Google Scholar]
- Jin H, Yamamoto N, Uchida K, Terai S, Sakaida I. Telmisartan prevents hepatic fibrosis and enzyme-altered lesions in liver cirrhosis rat induced by a choline-deficient L-amino acid-defined diet. Biochem Biophys Res Commun. 2007;364:801–807. doi: 10.1016/j.bbrc.2007.10.083. [DOI] [PubMed] [Google Scholar]
- Kasahara M, Naruse K, Sasaki S, Nakatani Y, Qu W, Ahsan B, Yamada T, Nagayasu Y, Doi K, Kasai Y, Jindo T, Kobayashi D, Shimada A, Toyoda A, Kuroki Y, Fujiyama A, Sasaki T, Shimizu A, Asakawa S, Shimizu N, Hashimoto S, Yang J, Lee Y, Matsushima K, Sugano S, Sakaizumi M, Narita T, Ohishi K, Haga S, Ohta F, Nomoto H, Nogata K, Morishita T, Endo T, Shin IT, Takeda H, Morishita S, Kohara Y. The medaka draft genome and insights into vertebrate genome evolution. Nature. 2007;447:714–719. doi: 10.1038/nature05846. [DOI] [PubMed] [Google Scholar]
- Kleiner DE, Brunt EM, Van Natta M, Behling C, Contos MJ, Cummings OW, Ferrell LD, Liu YC, Torbenson MS, Unalp-Arida A, Yeh M, McCullough AJ, Sanyal AJ. Design and validation of a histological scoring system for nonalcoholic fatty liver disease. Hepatology. 2005;41:1313–1321. doi: 10.1002/hep.20701. [DOI] [PubMed] [Google Scholar]
- Kolak M, Westerbacka J, Velagapudi VR, Wagsater D, Yetukuri L, Makkonen J, Rissanen A, Hakkinen AM, Lindell M, Bergholm R, Hamsten A, Eriksson P, Fisher RM, Oresic M, Yki-Jarvinen H. Adipose tissue inflammation and increased ceramide content characterize subjects with high liver fat content independent of obesity. Diabetes. 2007;56:1960–1968. doi: 10.2337/db07-0111. [DOI] [PubMed] [Google Scholar]
- Kudo H, Yata Y, Takahara T, Kawai K, Nakayama Y, Kanayama M, Oya T, Morita S, Sasahara M, Mann DA, Sugiyama T. Telmisartan attenuates progression of steatohepatitis in mice: role of hepatic macrophage infiltration and effects on adipose tissue. Liver Int. 2009;29:988–996. doi: 10.1111/j.1478-3231.2009.02006.x. [DOI] [PubMed] [Google Scholar]
- Masahito P, Aoki K, Egami N, Ishikawa T, Sugano H. Life-span studies on spontaneous tumor development in the medaka (Oryzias latipes) Jpn J Cancer Res. 1989;80:1058–1065. doi: 10.1111/j.1349-7006.1989.tb02259.x. [DOI] [PMC free article] [PubMed] [Google Scholar]
- Matsumoto T, Terai S, Oishi T, Kuwashiro S, Fujisawa K, Yamamoto N, Fujita Y, Hamamoto Y, Furutani-Seiki M, Nishina H, Sakaida I. Medaka as a model for human nonalcoholic steatohepatitis. Dis Model Mech. 2010;3:431–440. doi: 10.1242/dmm.002311. [DOI] [PubMed] [Google Scholar]
- Matteoni CA, Younossi ZM, Gramlich T, Boparai N, Liu YC, McCullough AJ. Nonalcoholic fatty liver disease: a spectrum of clinical and pathological severity. Gastroenterology. 1999;116:1413–1419. doi: 10.1016/S0016-5085(99)70506-8. [DOI] [PubMed] [Google Scholar]
- Powell EE, Cooksley WG, Hanson R, Searle J, Halliday JW, Powell LW. The natural history of nonalcoholic steatohepatitis: a follow-up study of forty-two patients for up to 21 years. Hepatology. 1990;11:74–80. doi: 10.1002/hep.1840110114. [DOI] [PubMed] [Google Scholar]
- Sadler KC, Amsterdam A, Soroka C, Boyer J, Hopkins N. A genetic screen in zebrafish identifies the mutants vps18, nf2 and foie gras as models of liver disease. Development. 2005;132:3561–3572. doi: 10.1242/dev.01918. [DOI] [PubMed] [Google Scholar]
- Sakaida I, Kubota M, Kayano K, Takenaka K, Mori K, Okita K. Prevention of fibrosis reduces enzyme-altered lesions in the rat liver. Carcinogenesis. 1994;15:2201–2206. doi: 10.1093/carcin/15.10.2201. [DOI] [PubMed] [Google Scholar]
- Sanyal AJ. AGA technical review on nonalcoholic fatty liver disease. Gastroenterology. 2002;123:1705–1725. doi: 10.1053/gast.2002.36572. [DOI] [PubMed] [Google Scholar]
- Schaffner F, Thaler H. Nonalcoholic fatty liver disease. Prog Liver Dis. 1986;8:283–298. [PubMed] [Google Scholar]
- Schupp M, Clemenz M, Gineste R, Witt H, Janke J, Helleboid S, Hennuyer N, Ruiz P, Unger T, Staels B, Kintscher U. Molecular characterization of new selective peroxisome proliferator-activated receptor gamma modulators with angiotensin receptor blocking activity. Diabetes. 2005;54:3442–3452. doi: 10.2337/diabetes.54.12.3442. [DOI] [PubMed] [Google Scholar]
- Tanaka T, Fukunaga Y, Itoh H, Doi K, Yamashita J, Chun TH, Inoue M, Masatsugu K, Saito T, Sawada N, Sakaguchi S, Arai H, Nakao K. Therapeutic potential of thiazolidinediones in activation of peroxisome proliferator-activated receptor gamma for monocyte recruitment and endothelial regeneration. Eur J Pharmacol. 2005;508:255–265. doi: 10.1016/j.ejphar.2004.10.056. [DOI] [PubMed] [Google Scholar]
- Terai S. Fish model leads to new findings in liver disease. Hepatol Res. 2010;40:111–113. doi: 10.1111/j.1872-034X.2009.00621.x. [DOI] [PubMed] [Google Scholar]
- Watanabe T, Asaka S, Kitagawa D, Saito K, Kurashige R, Sasado T, Morinaga C, Suwa H, Niwa K, Henrich T, Hirose Y, Yasuoka A, Yoda H, Deguchi T, Iwanami N, Kunimatsu S, Osakada M, Loosli F, Quiring R, Carl M, Grabher C, Winkler S, Del Bene F, Wittbrodt J, Abe K, Takahama Y, Takahashi K, Katada T, Nishina H, Kondoh H, Furutani-Seiki M. Mutations affecting liver development and function in medaka, Oryzias latipes, screened by multiple criteria. Mech Dev. 2004;121:791–802. doi: 10.1016/j.mod.2004.04.004. [DOI] [PubMed] [Google Scholar]
- Weisberg SP, McCann D, Desai M, Rosenbaum M, Leibel RL, Ferrante AW., Jr Obesity is associated with macrophage accumulation in adipose tissue. J Clin Invest. 2003;112:1796–1808. doi: 10.1172/JCI19246. [DOI] [PMC free article] [PubMed] [Google Scholar]
- Weisberg SP, Hunter D, Huber R, Lemieux J, Slaymaker S, Vaddi K, Charo I, Leibel RL, Ferrante AW., Jr CCR2 modulates inflammatory and metabolic effects of high-fat feeding. J Clin Invest. 2006;116:115–124. doi: 10.1172/JCI24335. [DOI] [PMC free article] [PubMed] [Google Scholar]
- Younossi ZM, Gramlich T, Liu YC, Matteoni C, Petrelli M, Goldblum J, Rybicki L, McCullough AJ. Nonalcoholic fatty liver disease: assessment of variability in pathologic interpretations. Mod Pathol. 1998;11:560–565. [PubMed] [Google Scholar]


