

Abstract
Despite the lack of ipsilateral receptive fields (RFs) for neurons in the hand representation of area 3b of primary somatosensory cortex, interhemispheric interactions have been reported to varying degrees. We investigated spatiotemporal properties of these interactions to determine the following: response types, timing between stimuli to evoke the strongest bimanual interactions, topographical distribution of effects, and their dependence on similarity of stimulus locations on the two hands. We analyzed response magnitudes and latencies of single neurons and multineuron clusters recorded from 100-electrode arrays implanted in one hemisphere of each of two anesthetized owl monkeys. Skin indentations were delivered to the two hands simultaneously and asynchronously at mirror locations (matched sites on each hand) and nonmirror locations. Since multiple neurons were recorded simultaneously, stimuli on the contralateral hand could be within or outside of the classical RFs of any given neuron. For most neurons, stimulation on the ipsilateral hand suppressed responses to stimuli on the contralateral hand. Maximum suppression occurred when the ipsilateral stimulus was presented 100 ms before the contralateral stimulus onset (p < 0.0005). The longest stimulus onset delay tested (500 ms) allowed contralateral responses to recover to control levels (p = 0.428). Stimulation on mirror digits did not differ from stimulation on nonmirror locations (p = 1.000). These results indicate that interhemispheric interactions are common in area 3b, somewhat topographically diffuse, and maximal when the suppressing ipsilateral stimulus precedes the contralateral stimulus. Our findings point to a neurophysiological basis for “interference” effects found in human psychophysical studies of bimanual stimulation.
Introduction
While other areas of the body are represented bilaterally even in primary somatosensory cortex area 3b, neuronal recordings from the hand representation consistently report receptive fields for monkey area 3b neurons exclusively localized to the contralateral hand (for review, see Pons et al., 1987), and anatomically, 3b has few callosal connections to directly mediate hand–hand interactions (Killackey et al., 1983). Bilateral receptive fields have been found in the hand representations of higher-level cortical areas, including areas 1, 2, S2 (for review, see Iwamura et al., 2002), and the parietal ventral area (PV) (Krubitzer and Kaas, 1990). While it may seem unlikely that stimuli on the two hands interact to influence responses in area 3b, evidence for such interactions exists. Ipsilateral stimulation may provide subthreshold activity that, when combined with contralateral stimulation, results in bimanual interactions. Bilateral responses have been reported in forelimb (Ogawa et al., 2000) and hindlimb (Shin et al., 1997; Alenda and Nuñez, 2004) portions of rat S1. Several studies have reported evidence for interhemispheric interactions in anterior parietal cortex during bimanual stimulation in humans (Schnitzler et al., 1995; Hoechstetter et al., 2001; Braun et al., 2005; Zhu et al., 2007) and nonhuman primates (Burton et al., 1998; Tommerdahl et al., 2006). In area 3b of monkeys, interhemispheric interactions have been described as primarily suppressive, in that simultaneous tactile stimulation of both hands suppresses neural activity in area 3b measured on one side through optical imaging (Tommerdahl et al., 2006). Loss of input, through amputation or local anesthesia of an ipsilateral digit, for instance, leads to a release from inhibition in contralateral area 3b neurons (Calford and Tweedale, 1990, 1991a,b). Interhemispheric effects likely involve intrahemispheric feedback projections to area 3b from other cortical areas containing neurons with bilateral receptive fields (for review, see Calford, 2002). The topography of sites producing these suppressive effects has not been well established, but the effects are expected to be rather widespread based on the diffuse nature of feedback projections (Cusick et al., 1989; Darian-Smith et al., 1993; Burton and Fabri, 1995; Burton et al., 1995).
We were interested in the effect on responses in 3b when tactile stimuli are presented to the hands asynchronously. Temporal and spatial characteristics of interhemispheric effects may be important in area 3b, but have not been studied systematically. In this study, we presented 500 ms skin indentations simultaneously on matching and nonmatching locations on the two hands of owl monkeys. For the selected paired locations, we also presented the contralateral stimulus at various onset delays. Thus, we were able to characterize the spatiotemporal stimulation effects on interhemispheric interactions. The results indicate that the responses of many neurons in the hand representation in area 3b of monkeys that are activated by tactile stimuli on the contralateral hand are suppressed by stimulation on the ipsilateral hand. These results suggest a neurophysiological basis for the perceptual effects of bimanual stimulation in humans, in which suprathreshold stimulation on the ipsilateral hand interferes with the ability to perceive a near-threshold tactile stimulus on the contralateral hand (Braun et al., 2005).
Materials and Methods
Preparation
All procedures followed the guidelines established by the National Institutes of Health and the Animal Care and Use Committee at Vanderbilt University. Two adult owl monkeys A and B (Aotus nancymaae) were prepared for electrophysiological recordings in the left hemisphere of primary somatosensory cortex following procedures presented previously in detail (Reed et al., 2008, 2010). [Note: these are the same individuals as monkeys 2 and 3, respectively, from the study by Reed et al. (2010).] Monkeys (monkey A, male, 1 kg and monkey B, female, 1.2 kg) were anesthetized with propofol during surgery (10 mg/kg/h, i.v.) and electrophysiological recording (0.3 mg/kg/h). During surgery and recording sessions monkeys were paralyzed via vecuronium bromide (0.1–0.3 mg/kg/h, i.v.) mixed with 5% dextrose and Lactated Ringer's solution and were artificially ventilated with a mixture of N2O: O2: CO2 (75: 23.5: 1.5) at a rate sufficient to maintain peak end tidal CO2 at ∼ 4%. In monkey B, 1.2 mg/kg sufentanil was added to the Lactated Ringer's solution during the surgical procedures to stabilize anesthetic depth. Following delivery of this amount of sufentanil, the monkey was maintained under anesthesia without supplemental sufentanil for the remainder of the experiment. Anesthesia and paralysis ensured that the hand remained stable during stimulation. The animal was carefully monitored to maintain a steady-state of anesthesia, specifically monitoring electrocardiograms, breathing, temperature, and electroencephalograms.
As described previously (Reed et al., 2008, 2010), the 100-electrode array (now Blackrock Microsystems) with 1-mm-long electrodes was inserted to a depth of 600 μm using a pneumatic inserter so that the electrode tips were expected to be located within layer 3 of cortex. While there is some variability due to the slight curvature of the brain, histological analysis was used to estimate the electrode depth (see Histology).
Tactile stimulation and recording procedures
Our equipment and stimulus parameters have been described previously (Reed et al., 2008, 2010) and were used in these experiments to test responses to paired stimuli applied bimanually to mirror and nonmirror digits. Briefly, stimuli were provided by two independent force- and position-feedback controlled motor systems (300B, Aurora Scientific), with contact made by round Teflon probes 1 mm in diameter. Stimuli consisted of pulses that indented the skin 0.5 mm for 0.5 s, followed by 2.0 s off the skin, repeated for 255 s (100 trials). Stimuli were delivered to paired skin sites simultaneously (0 ms) or at selected stimulus onset delays of 10, 30, 50, 100, and 500 ms of one of the two stimuli. Single-site control stimuli were delivered to the ipsilateral (left hand) and contralateral (right hand) sites before paired stimulation. Recordings were made from the left hemisphere. The fingernails were glued (cyanoacrylic) to Teflon screws fixed in plasticine to keep the hand stable during stimulus blocks.
In addition to controlled mechanical stimulation, we used light tactile stimulation to map the minimal receptive fields (mRFs) (Merzenich et al., 1983) of selected electrodes. Receptive field mapping aided our reconstruction of the electrode locations as within and outside of area 3b to complement our subsequent histological identification of area 3b. As we have published previously (Reed et al., 2008), the mRF was defined as the region of skin in which a near-threshold light touch with a probe reliably evoked spikes from the recorded neurons. Typical procedures for mRF mapping of somatic sensory responses in primates have been published (Merzenich et al., 1978; Nelson et al., 1980; Jain et al., 2001b).
Recordings were made using the 100-electrode array and the Bionics Data Acquisition System (now Blackrock Microsystems). The signals on each channel were amplified by 5000 and bandpass filtered between 250 Hz and 7.5 kHz. The response threshold for neurons at each electrode was automatically set for 3.25 times the mean activity, and the waveforms were sampled at 30 kHz for 1.5 ms windows (Samonds et al., 2003).
Histology
At the end of the experiment the electrode array was removed, animals were perfused with 0.9% saline, pH 7.4, followed by fixative (2% paraformaldehyde in phosphate buffer followed by 2% paraformaldehyde with 10% sucrose in phosphate buffer), and the brains were placed in 30% sucrose solution overnight in preparation for histological analysis. The cortex was flattened between glass slides, frozen, and cut parallel to the surface in 40 μm sections. Sections were processed for myelin using the silver staining procedure of Gallyas (1979) with slight modifications (Jain et al., 1998, 2001a) to aid in determining the electrode locations relative to the borders of area 3b hand representation [see the study by Reed et al. (2008), their Supporting Fig. 1 for example of tissue quality and further description of estimation of electrode locations]. In these sections, the location of an electrode penetration was apparent as a small hole in the tissue. Electrode depth was estimated by identifying the appearance and disappearance of electrode tracks across serial sections through the depth of cortex. Electrodes are no deeper than the last holes and the identification of layers was approximated based on depth estimates and differences in myelin staining across depths, as described by Jain et al. (1998, 2001a). The total electrode length is 1 mm; therefore, the recordings cannot come from layer 5, which is at a depth of ∼1.5 mm in owl monkeys. The inserter injected the electrodes 0.6 mm; thus, recordings predominantly come from layer 3. Single units are unlikely isolated from layer 4 due to the small granular cells and neuron packing density; however, it is possible that some multiunits were recorded from layer 4 from some of the electrodes in monkey B based on our depth estimates.
Figure 1.
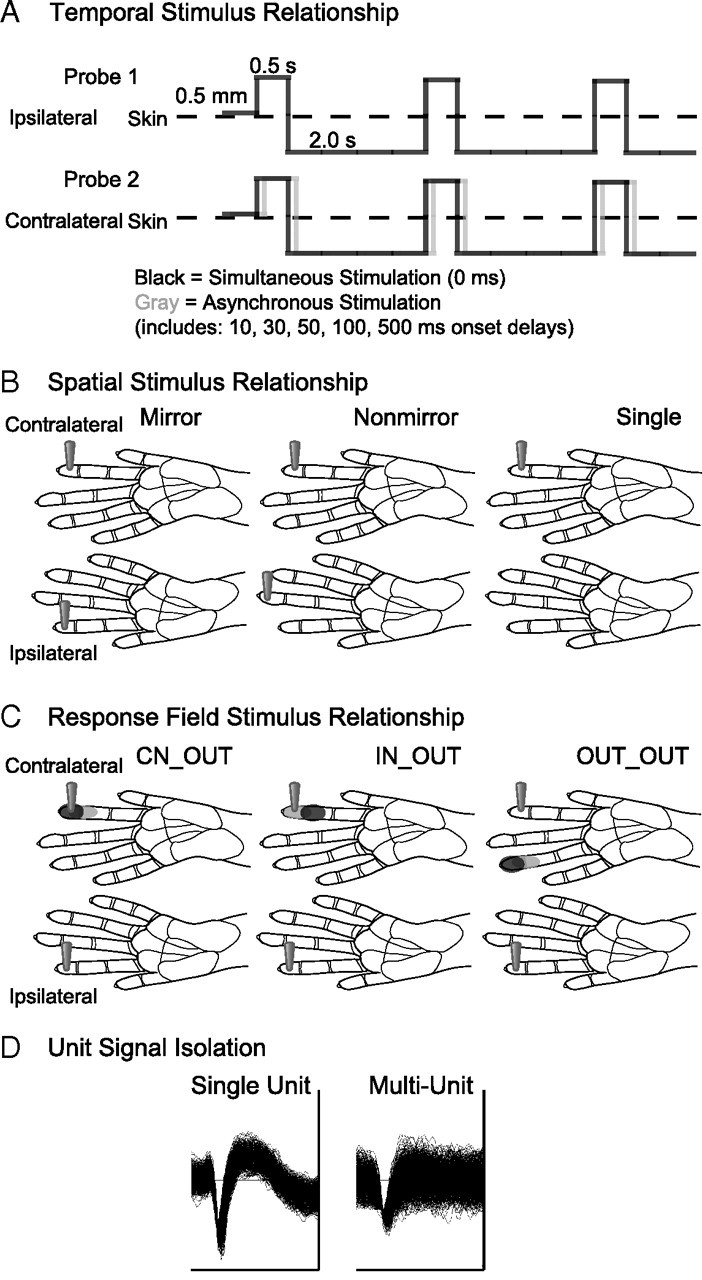
Schematic representations of data categories for analysis. A, The temporal pattern of stimulation is depicted by solid lines indicating the duration that the stimulus probe indents the skin (0.5 s), the depth of indentation (0.5 mm), and the duration the stimulus probe is off the skin per stimulus cycle (2.0 s). Paired stimulation, indicated by the schematics of Probe 1 and Probe 2, was simultaneous or asynchronous. To depict asynchronous stimulation generally, the gray solid line representing Probe 2 is shifted relative to the black solid line. The two probes are presented to different skin sites on the hand; however, the schematic depicts the overlap in contact time of the stimuli presented via Probe 1 and Probe 2. B, The spatial stimulus relationships were divided into three categories, illustrated by the locations of the stimulus probes on schematics of the owl monkey hands for dual probes on two hands (mirror and nonmirror locations) and a single probe on one hand as a control category. C, The response field category is determined by the response field of the unit relative to the stimulation location. Black shading on schematics of the owl monkey hand indicates the center of the response field for a hypothetical unit. Gray shading on the hand indicates locations inside the response field, but outside the center “hotspot” for the hypothetical reference unit. The locations of the two probes indicate the location of the stimulation relative to the response field for each response field category. D, Data were also classified by the quality of the signal isolation into single units or multiunits. Examples of each unit type are shown from monkey case B. The trace window for each unit shown span 128 μV and 1.6 ms.
Data analysis
Spike sorting.
The details of our spike sorting procedures have been described previously (Reed et al., 2008). Briefly, spike waveforms were sorted into single- and multiunits offline with an automatic spike classification program based on the t-distribution expectation maximization algorithm (Shoham et al., 2003), which is part of the Bionics Data Acquisition System. A second spike sorter program, Plexon Offline Sorter (Plexon), was used to verify the quality of unit isolation such that single units had refractory periods ≥ 1.2 ms, p ≤ 0.05 for multivariate ANOVA related to cluster separation, and distinct waveform amplitudes and shapes when compared with other activity on the same electrode (Nicolelis et al., 2003). Single- and multiunits were categorized separately but were both included in the same statistical model for factor analysis. When careful analysis of the waveform data showed that not all spikes had similar shapes, amplitudes, and durations, we did not assume that those spikes all came from a single neuron. Thus, waveforms that could not be isolated as from a single unit were termed “multiunit” recordings. Typically, we obtained multiunit recordings along with one or more single units, but occasionally the automatic spike sorting program designated units based on waveform shape and amplitude as different unit clusters, even when those units could not be isolated into single units. Multiple single units collected from individual electrodes were included in the analysis; however, when multiple clusters of neuronal waveforms could not be isolated into single units, only one neuron cluster was selected for analysis per electrode. The neuron cluster selected for analysis was chosen by having the highest firing rate.
Peak firing rate.
As described by Reed et al. (2008), to determine peak firing rate, spike trains were smoothed with a spike density function using Matlab (The Mathworks). A spike density function was produced by convolving the spike train from each trial with a function resembling a postsynaptic potential specified by τg, the time constant for the growth phase, and τd, the time constant for the decay phase, as follows: R(t) = (1 − exp(−t/τg)*exp(−t/τd).
Based on physiological data from excitatory synapses, τg was set to 1 ms (Mason et al., 1991; Moore and Nelson, 1998). We set τd to 5 ms (Mason et al., 1991; Moore and Nelson, 1998; Veredas et al., 2005) rather than the common value of 20 ms, because the transient nature of the on and off responses in primary somatosensory neurons was excessively smoothed at larger values, particularly when stimuli were presented at stimulus onset asynchronies of 10 and 30 ms. We examined onset responses within a 50 ms response time window from the onset of the stimulus of interest. When stimuli were presented with onset asynchronies, the poststimulus window began from the onset of the second (contralateral) stimulus; thus, the first (ipsilateral) stimulus acted as a “conditioning stimulus” similar to many other studies (Gardner and Costanzo, 1980; Chowdhury and Rasmusson, 2003; Greek et al., 2003).
The excitatory peak firing rate was determined as the maximum of the spike density function within the response time window (50 ms), and the average baseline firing rate (calculated over a 500 ms window before stimulation onset) was subtracted from this value. This peak firing rate value was required to be greater than a threshold value, which was the average baseline firing rate plus two SDs of this baseline with a minimum value of 5 spikes/s, as described previously (Reed et al., 2010). When the response did not reach threshold in the response window, responses were examined for significant reductions in firing rate. However, we did not encounter neurons with firing rates suppressed below levels of spontaneous activity in response to contralateral stimulation alone in this sample. Additionally, we did not analyze responses beyond the 50 ms response time window, including any responses that may occur after the 500 ms stimulus came off of the skin.
Response latency.
Response latencies were calculated using Matlab and determined from spike density function histograms as the initial time when the rate meets the half-height over the threshold value of the peak firing rate within the response time window (see Peak firing rate), as we have previously described (Reed et al., 2010). Results were checked manually for proper assignments. This method of determining excitatory response latency is similar to measures that determine the width or duration of peaks in histograms (Tutunculer et al., 2006; Davidson et al., 2007) and resembles other calculations of minimal latency. Calculating minimal response latency is useful to determine the initial time in which the neuron's firing rate differs from spontaneous activity for the arrival time of signals, rather than determining the timing of the peak firing rate. We examined peak latency for a subset of the data and found that this resulted in later latency values, but the timing of the peak response only changes by a few milliseconds under differing stimulus conditions.
Firing rate modulation index.
We developed a modulation index based on methods used to describe multisensory integration (Stanford et al., 2005; Alvarado et al., 2007). The observed average firing rate response within the 50 ms response window during a given bimanual stimulation condition was compared with the distribution of expected average responses based on summation of the unit's response to the two stimuli presented individually. We described this method in the study by Reed et al. (2010). The modulation categories were “superadditive,” “subadditive,” “additive,” “suppressive,” or “no difference” from the response to the contralateral stimulus, similar to the methods of Stanford et al. (2005). “Superadditive” responses were greater than the predicted distribution by two times the SD of the distribution, and “subadditive” responses were less than the predicted distribution by two times the SD of the distribution.
As an additional quantifier, a percentage modulation calculation was also performed similar to the multisensory integration index (Alvarado et al., 2007) and suppression index (Jiang and Stein, 2003) using the following equation: % modulation = (FRbimanual stimuli − FRcontralateral control)/FRcontralateral control *100.
These calculations incorporated a correction to subtract the average baseline firing rate from the observed average firing rate, and the overall calculation is a subtraction of the response to the contralateral stimulus from the response to the two-site stimulation, with the result divided by the response to the contralateral stimulus and multiplied by 100.
Response field.
Since we recorded from multiple neurons simultaneously from 100 electrodes over a 4 × 4 mm area, the stimulus locations were not in the receptive field of neurons at every recording site. We defined excitatory “response fields” as those skin locations where the firing rate for a given neuron was clearly above spontaneous activity (Reed et al., 2010). When a site on the hand was stimulated, that site was classified as inside a unit's excitatory response field if the peak firing rate after subtracting the average baseline firing rate was greater than or equal to three times the SD of the average firing rate for the population of neurons. Typically, responsive single neurons were found in 65 out of 100 recording sites. For a given neuron, responses were compared for all of the locations and all of the stimulus onset intervals that were tested in a given experiment. As more than one stimulation location could be within the response field, the location with the greatest firing rate was designated as the center of that unit's response field. The purpose of designating a center was to reflect the characteristics of the receptive fields, which typically have a “hot spot.” When the unit firing rate did not meet the criteria to be categorized as inside, the location was considered outside of the response field. Thus, the response field is a firing-rate-based estimate similar to the concept of a receptive field (as measured by suprathreshold stimulation) and was used to examine and classify spatial integration. When both hands were stimulated, the response field designations during stimulation of the two single sites were combined (see Data classification).
Data classification.
Data were classified based on several conditions that were used in a statistical model to estimate the contributions of those factors to the observed latencies and firing rates. These factors were the temporal relationship of the stimuli, the spatial relationship of the stimuli, the neuron's response field relationship to the stimuli, and the neuron isolation quality (Fig. 1).
For analysis of the bimanual stimulation condition the peak firing rates in response to contralateral and ipsilateral stimulation alone were compared. The condition with the highest firing rate was used for the statistical analysis of the stimulus pairing. This was always the contralateral (right hand) location and never the ipsilateral (left hand location). To assess the effect of the temporal relationship of stimuli, we compared the responses to the contralateral control with the responses of neurons under the paired stimulus conditions including presentations of the ipsilateral stimulus with the contralateral stimulus simultaneously (0 ms) or preceding the contralateral stimulus by 10, 30, 50, 100, or 500 ms (Fig. 1A). The spatial relationship of the stimuli refers to placement of two stimulus probes on mirror or nonmirror locations on the two hands or to the location of a single stimulus probe on one hand (Fig. 1B). The relationship of the paired stimuli to the response field of a given neuron was included as a factor that could influence the firing rate and latency (Fig. 1C). Although we allowed for the possibility that units would respond to the ipsilateral stimulus, the ipsilateral stimulus was outside of the response fields of all the units collected and included in this analysis. As such, the combined categories were outside–outside (OUT_OUT), inside–outside (IN_OUT), and center–outside (CN_OUT). Finally, we classified the data into single units (SU) and multiunits (MU) (Fig. 1D). We tested all of these categories to determine their influence on response latency and peak firing rate.
Statistical modeling of data
The values we obtained for excitatory response latency and peak firing rate from Matlab were summarized in Excel and imported into SPSS 17.0 for further analysis. The data distributions differed from the normal and Poisson distributions (Kolmogorov–Smirnov one-sample test); therefore, we used generalized estimating equations (for correlations in data due to repeated measures) in SPSS to analyze this complex dataset. [For detailed information regarding generalized estimating equations analysis, refer to Liang and Zeger (1986), Zeger and Liang (1986), Hardin and Hilbe (2003).] When the data do not fit the normal distribution, the generalized linear model (including generalized estimating equations) extends linear model theory to accommodate measures drawn from nonnormal distributions to select a variety of distributions from the exponential family of distributions (Hardin and Hilbe, 2003). Refer to Reed and Kaas (2010) for specific details of how we used generalized estimating equations analysis. We tested several parameters, and the final statistical model parameters for both latency and firing rate results were based on a gamma probability distribution with the log link function, a first-order autoregressive correlation matrix, and a robust model estimator. In these models, latency or peak firing rate acted as the dependent variable, and the predictor variables included the following: the temporal stimulus relationship, the spatial relationship of stimuli, the relationship of the stimulus to the response field of the neuron unit, and the classification of the unit as a single- or multiunit. See depictions of the predictor variable categories in Figure 1. The Bonferroni correction for multiple comparisons was applied (in all calculations), and the Wald χ2 statistic was used to test the significance of the effects of the statistical model. The Wald χ2 test is based on the linearly independent pairwise comparisons among the estimated marginal means. The generalized estimating equations analysis provides estimates of the population averages of the dependent variable based on the values of the predictor variables and provides estimates for the significance of the effects.
Results
We obtained single- and multiunit recordings from 100-electrode arrays histologically localized to cortical layer 3, primarily from area 3b, of two owl monkeys during stimulation of selected locations on the ipsilateral and contralateral hand. Figure 2 depicts the placement of the electrode arrays in the left hemispheres of each of the monkey cases, as determined from receptive field mapping during the recording procedures and myelin staining patterns in sections of flattened cortex. See Table 1 for a list of the conditions included from each monkey. To select units for analysis we used general inclusion criteria and criteria dependent on the measure (firing rate, latency, or modulation index). Foremost, only neurons from sites judged to be in area 3b were included in this study. Additionally, only one multiunit was included per electrode. The numbers of units meeting the general criteria for analysis were as follows: 117 SUs and 152 MUs from case A, and 132 SUs and 121 MUs from case B. Data were collapsed across the two monkeys for a population analysis. The criteria specific to each measure are as follows. For firing rate, we only analyzed responses within 50 ms after the stimulus onset; therefore, any responses to the stimulus coming off of the skin were not included. For the latency measure, units had to respond to stimulation to have a latency value. For the modulation index, a control value was needed, so only units that responded to single-site contralateral stimulation could be included to determine if dual-site stimulation caused increases, decreases, or no change in firing rate.
Figure 2.
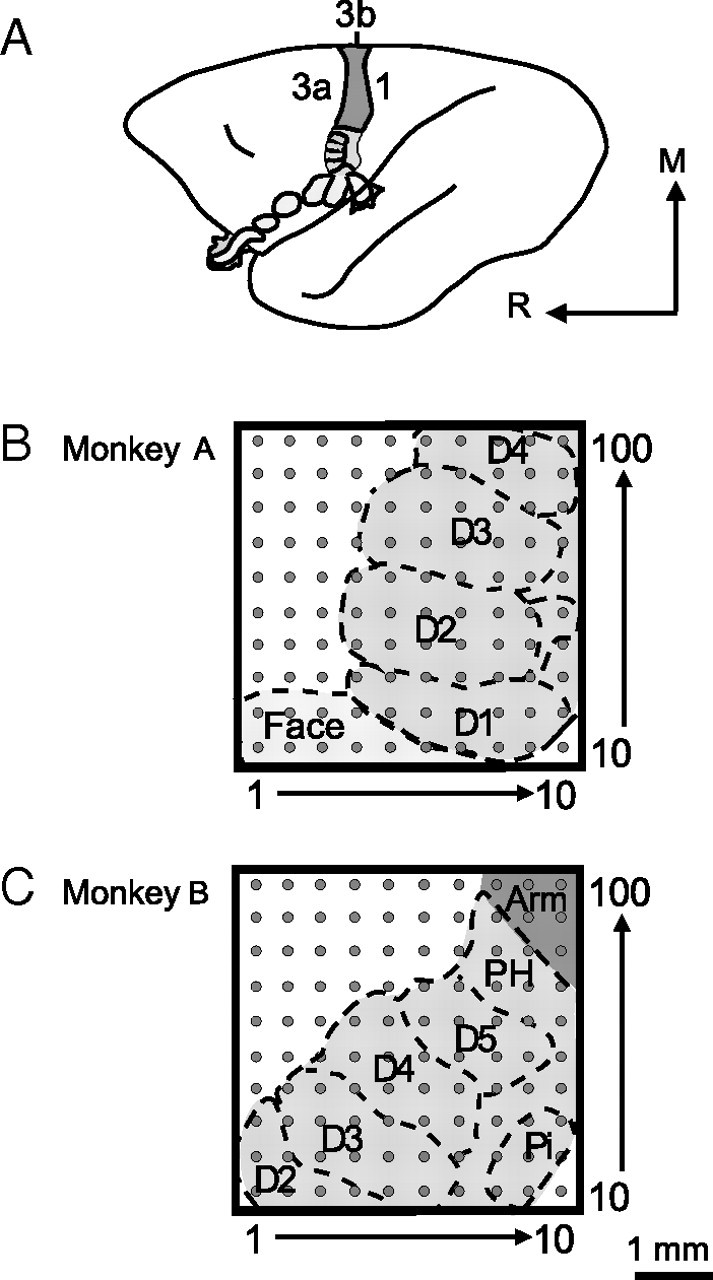
Schematic reconstructions show 100-electrode array placement in S1 of two owl monkey cases. A, A schematic of the owl monkey brain is shown with area 3b highlighted, as neurons in areas 3a and 1 tend not to respond well to light tactile stimulation under the anesthetic conditions of these experiments. The orientation of the brain is indicated by the arrows; R, rostral and M, medial. B–C, Electrode locations in each owl monkey case were approximated based on examination of myelin-stained sections of flattened cortex and the results of receptive field mapping during recording experiments to estimate the digit and palm pad representations. The placements of the 100-electrode array in each case tended to cover a large part of the area 3b hand representation. The 1 mm scale bar refers to the array size for both monkey cases. D, Digit; PH, hypothenar palm pad; Pi, insular palm pad.
Table 1.
Summary of stimulation locations and conditions
| Condition | Paired Location | Monkey |
|---|---|---|
| Mirror | LdD2 + RdD2 | A |
| LdD3 + RdD3 | A | |
| LdD4 + RdD4 | B | |
| LP3 + RP3 | B | |
| Nonmirror | LmD3 + RdD2 | A |
| LmD4 + RdD2 | A | |
| LdD2 + RdD3 | A | |
| LmD4 + RdD3 | A | |
| LdD4 + RdD3 | A | |
| LdD5 + RdD4 | B | |
| LdD5 + RP3 | B |
L, Left; R, right; D, digit; P, palm pad; d, distal; m, middle.
A series of example rasters and histograms in Figure 3 shows one neuron's responses to ipsilateral, contralateral, and bimanual stimulation on matching, mirror locations. We never found responses to ipsilateral stimulation alone, as shown in the example; however, ipsilateral stimulation modulated the response to the onset of contralateral stimulation. (We did not analyze the response when the stimulus was withdrawn from the skin.) Figure 4 shows the responses of the same neuron when the paired stimulation sites were located on nonmatching, nonmirror locations. The effects in this example neuron resemble the population results: ipsilateral stimulation suppressed responses to contralateral stimuli, and this effect was slightly more pronounced when the stimuli were presented on mirror locations instead of nonmirror locations, as determined by quantitative analysis reported below.
Figure 3.
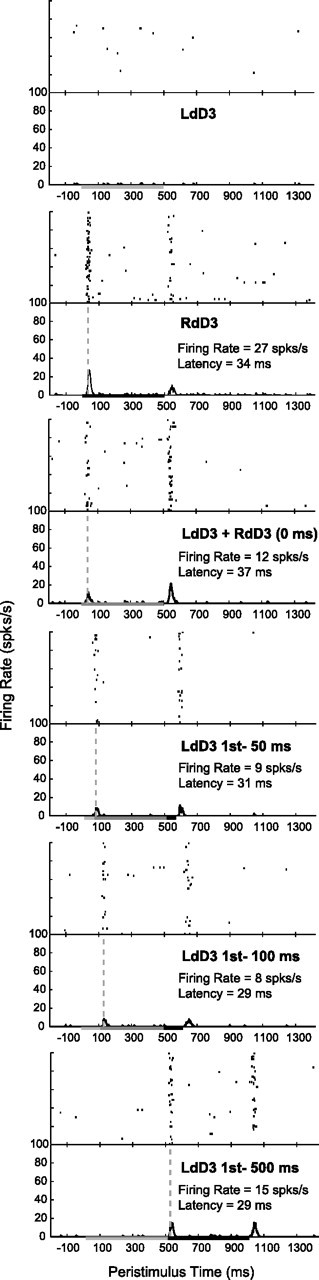
Example histograms from a single unit depict peak firing rate and latency changes in response to bimanual stimulation on mirror locations. Histograms are shown for one neuron's responses (unit 074a from case A) when the locations on each hand were stimulated individually, then for both locations simultaneously, and finally for stimulus blocks in which the ipsilateral (left hand) stimulus was presented at intervals before the onset of the contralateral (right hand) stimulus. (Six out of eight stimulation conditions recorded are shown.) Stimulation was presented in blocks of 100 trials. Histograms were smoothed by a spike density function. Vertical dashed lines indicate when the latency was determined in Matlab using the criteria described in the Materials and Methods. The duration for each stimulus was 500 ms, as indicated by the line on the x-axis; therefore, paired stimulation overlapped in time for all stimulus onset delays tested except for 500 ms. The measures we examined in the present study were only the peak firing rate within 50 ms of the contralateral stimulus onset and the associated latency of that response. The peak firing rates were suppressed by bimanual stimulation in this example. Contralateral stimulation alone resulted in a peak firing rate (with baseline activity subtracted) of 27 spikes/s, while the firing rate response dropped to its lowest level of 8 spikes/s when the ipsilateral stimulus preceded the contralateral stimulus by 100 ms.
Figure 4.
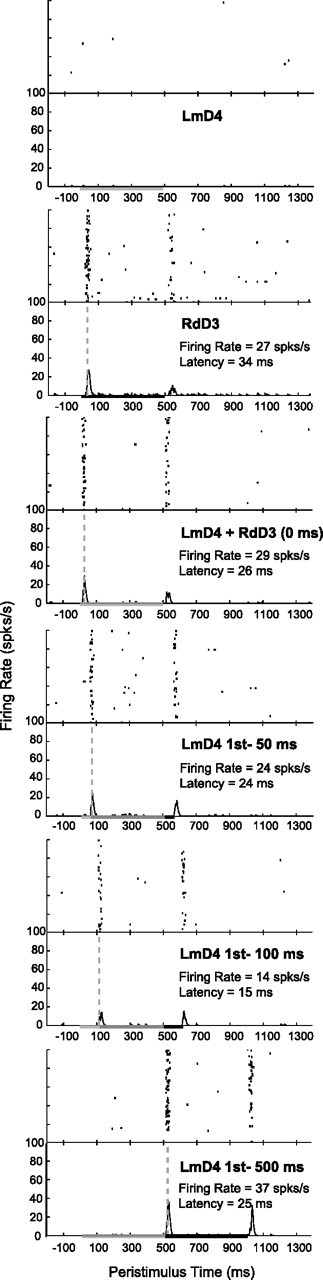
Example histograms from a single unit depict peak firing rate and latency changes in response to bimanual stimulation on nonmirror locations. Stimulation on nonmirror locations resulted in less suppression in the same unit shown in Figure 3 compared with responses during stimulation on mirror locations. In both cases, the firing rate response dropped to its lowest level (14 spikes/s) when the ipsilateral stimulus preceded the contralateral stimulus by 100 ms.
Variations in peak firing rate and response latency
We collected 1743 SU firing rate observations from 117 SUs and 1911 MU firing rate observations from 152 MUs that met the firing rate inclusion criteria under the spatiotemporal stimulus conditions. The mean peak firing rate for the dataset was 19.37 spikes/s (SD 25.14) and the median peak firing rate was 11.32 spikes/s. We obtained fewer response latencies than firing rate observations because not all firing rates met the response criteria, particularly when neurons were strongly suppressed (i.e., we determined the firing rates even when there was no response peak exceeding 5 spikes/s, and hence, no response latency). We collected 1322 SU response latencies (117 SUs) and 1558 MU response latencies (152 MUs) that met our latency inclusion criteria under the spatiotemporal stimulus conditions. The mean response latency for the dataset over all conditions was 23.74 ms (SD 6.91) and the median response latency was 22.20 ms.
The modeling analysis predicted that several factors influenced the peak firing rate values, and these spatiotemporal stimulus conditions affected peak firing rate more than latency. Tests of the model effects were performed using the Wald χ2 statistic for significance of main effects and selected two-, three-, and fourway interactions (Tables 2, 3). The results for which significance calculations are reported are estimates of the peak firing rate and latency values based on the analysis (rather than observed data values). Deviations between the observed data values and the predicted estimates were slight, and the estimates from the analysis followed the trends in the data. Plots in Figures 5 and 6 are observed values. For the statistical analysis, an individual factor is isolated while the other factors are averaged.
Table 2.
Tests of model effects for variance in peak firing rate classified by spatial and temporal stimulus characteristics, unit type, and interactions
| Variance source | Wald χ2 | df | p value |
|---|---|---|---|
| (Intercept) | 3542.320 | 1 | < 0.0005 |
| Temporal relationship | 41.450 | 5 | < 0.0005 |
| Spatial relationship | 0.140 | 1 | 0.709 |
| Response field | 173.406 | 2 | < 0.0005 |
| Unit type | 4.354 | 1 | 0.037 |
| Temporal × spatial | 21.475 | 5 | 0.001 |
| Temporal × RF | 41.138 | 12 | < 0.0005 |
| Temporal × unit | 5.259 | 6 | 0.511 |
| Temporal × spatial × RF | 12.228 | 12 | 0.428 |
| Temporal × spatial × RF × unit | 41.858 | 32 | 0.114 |
Tests of model effects using Type III analysis from generalized linear modeling with general estimating equations on the dependent variable peak firing rate. N = 522 units with correlated measures from the seven levels of the variable “Temporal relationship” (observations = 3654).
Table 3.
Tests of model effects for variance in latency classified by spatial and temporal stimulus characteristics, unit type, and interactions
| Variance source | Wald χ2 | df | p value |
|---|---|---|---|
| (Intercept) | 86865.269 | 1 | < 0.0005 |
| Temporal relationship | 9.401 | 5 | 0.094 |
| Spatial relationship | 0.000 | 1 | 0.983 |
| Response field | 5.089 | 2 | 0.079 |
| Unit type | 35.201 | 1 | < 0.0005 |
| Temporal × spatial | 18.025 | 5 | 0.003 |
| Temporal × RF | 11.380 | 12 | 0.497 |
| Temporal × unit | 2.548 | 6 | 0.863 |
| Temporal × spatial × RF | 18.678 | 12 | 0.097 |
| Temporal × spatial × RF × unit | 28.147 | 32 | 0.662 |
Tests of model effects using Type III analysis from generalized linear modeling with general estimating equations on the dependent variable latency. N = 522 unit subjects with correlated measures from the seven levels of the variable “Temporal relationship” (included observations = 2875, missing observations = 779).
Figure 5.
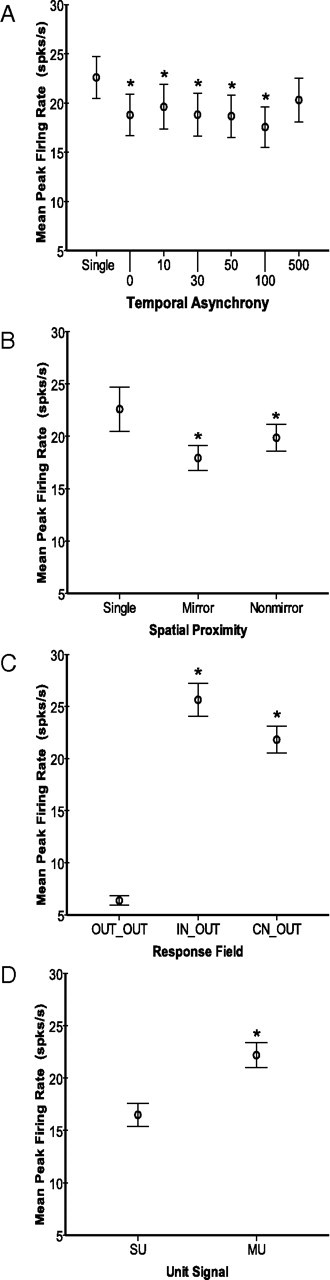
Average response magnitudes differ across spatial and temporal stimulus factors. Plots of group averages shown for spatiotemporal stimulus categories. Error bars represent 95% confidence intervals for all panels. Asterisks indicate significant differences relative to the first category in each panel. A, Means of peak firing rate values (spikes/s) are plotted for each temporal stimulation category. Control stimulation on the contralateral location resulted in significant differences from all of the other groups except for the 500 ms stimulus onset delay group. The 100 ms delay group was significantly different from all other groups. The 500 ms delay group was significantly different from all other groups except for 10 ms (and the contralateral control group). All other comparisons not noted were significantly different. B, Means of peak firing rate values are plotted for the two spatial proximity categories: Mirror and Nonmirror. These two groups were not significantly different. C, Means of peak firing rate values are plotted for each type of relationship of the response field to the stimulus locations. Peak firing rates were lower when the stimuli were outside of the response field (OUT_OUT) compared with when the contralateral stimulus was inside the RF (IN_OUT and CN_OUT), and the IN_OUT and CN_OUT groups were not significantly different from each other. D, Means of peak firing rate values are plotted for single units and multiunits, averaged across all stimulus conditions. MUs tended to have higher peak firing rates than SUs.
Figure 6.
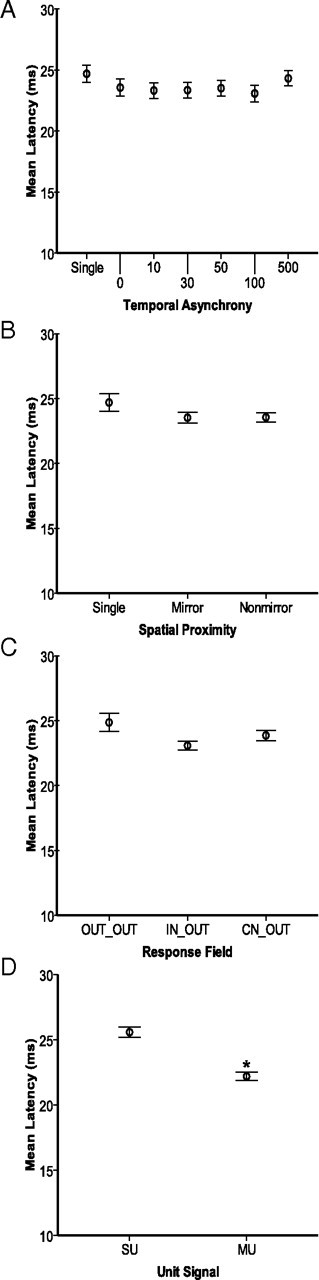
Average response latencies show few differences across spatial and temporal stimulus factors. Conventions follow Figure 5. Error bars represent 95% confidence intervals for all panels. Asterisks indicate significant differences relative to the first category in each panel. A, Mean response latencies (ms) are plotted for each temporal stimulation condition. The control refers to the contralateral stimulus, and numbers refer to the delay between the onset of the ipsilateral stimulus and the onset of the contralateral stimulus (second) from 0 to 500 ms. No pairwise comparisons were significantly different. B, Mean response latencies are plotted for conditions in which the stimulation locations on the two hands were in matched locations on mirror digits (Mirror) and when the stimulation sites were located on different digits of the two hands (Nonmirror). The mean latencies were not significantly different. C, Mean response latencies are plotted for the relationships of the response field of the neurons to the stimulus locations. Latencies were longer when both stimuli were presented outside of the neuron's response field (OUT_OUT) compared with when the contralateral stimulus was inside the response field (IN_OUT and CN_OUT). D, Mean response latencies are plotted for single units and multiunits, averaged across all stimulus conditions. MUs tended to have shorter latencies than SUs.
Temporal stimulation relationship
We found decreases in peak response magnitudes compared with contralateral stimulation only (17.44 spikes/s ± 0.59) for all of the temporal stimulation conditions in which the ipsilateral stimulus was presented simultaneously with or preceding the contralateral stimulus. As shown in Figure 5A, maximum suppression was found when the ipsilateral stimulus was presented 100 ms before the onset of the contralateral stimulus (for all paired stimulus locations combined) (12.67 spikes/s ± 0.71, p < 0.0005). The longest stimulus onset delay of 500 ms allowed the contralateral response to decay nearly back to control levels (15.93 spikes/s ± 0.81, p = 0.428). The remaining pairwise comparisons with contralateral control stimulation are as follows: 0 ms = 14.00 spikes/s ± 0.76, p < 0.0005; 10 ms = 15.02 spikes/s ± 0.80, p = 0.003; 30 ms = 14.43 spikes/s ± 0.80, p < 0.0005; and 50 ms = 14.22 spikes/s ± 0.80, p < 0.0005. While not shown on Figure 5, we examined all pairwise comparisons. Notably, stimulation at the 100 ms delay was significantly different from all other conditions as follows: contralateral control, p < 0.0005; 0 ms, p = 0.042; 10 ms, p < 0.0005; 30 ms, p = 0.020; 50 ms, p = 0.031; 500 ms, p < 0.0005. The remaining pairwise comparisons reaching significance were the following conditions compared with the 500 ms delay condition: 0 ms, p = 0.004; 30 ms, p = 0.009; 50 ms, p < 0.0005. Thus, the interhemispheric effects on the responses to contralateral stimulation occurred not only when stimuli were presented simultaneously, but they had a maximum suppressive effect when the onset of the ipsilateral stimulus preceded the contralateral stimulus by 100 ms. Note, however, that the significance is estimated from the statistical model and differences are small between the comparisons with the 100 ms group.
Unlike peak firing rate, the response latency to the contralateral stimulus was not significantly affected by the presentation of the ipsilateral stimulus (p = 0.094) (Fig. 6A). Thus, ipsilateral stimulation in conjunction with contralateral stimulation did not affect the latency of responses, but did affect the peak response magnitude (for all paired stimulus locations combined).
Spatial stimulation relationship
Bimanual stimulation resulted in suppression of peak firing rates compared with contralateral stimulation alone (contralateral = 17.44 spikes/s ± 0.58; mirror = 14.62 spikes/s ± 1.03, p = 0.010; nonmirror = 14.08 spikes/s ± 0.80, p < 0.0005) (Fig. 5B). Stimulation on mirror digits was not different from stimulation on nonmirror digits (p = 1.000). There was no effect of the spatial discordance when we subdivided the conditions to account for nonmirror stimulation on adjacent digits versus nonadjacent digits (p = 0.573, data not shown), but note that the sample size for this comparison is small (Table 1). Also, presenting paired stimuli on mirror or nonmirror hand locations did not impact the latency of the response to contralateral stimulation (p = 0.983) (Fig. 6B). Overall, the interhemispheric effects did not show strong topography.
Response field relationship
As expected, when both stimuli were outside of the response field (OUT_OUT, 6.08 spikes/s ±0.51), the peak firing rates were significantly lower than other conditions when the contralateral stimulus was inside the response field (IN_OUT, 25.01 spikes/s ± 2.08; p < 0.0005; CN_OUT, 20.29 spikes/s ± 1.66; p < 0.0005) (Fig. 5C). The highest firing rates were found when the contralateral stimulus was within the response field of the reference unit, and the responses in these two categories were not significantly different (IN_OUT and CN_OUT, p = 0.229). Thus, the distinction between the center (CN) or “hotspot” and the inside (IN) of the contralateral response field was not a source of the variability in the peak firing rates. However, the overall location of the contralateral stimulus in relation to the response field of the reference unit had a large effect on the firing rate due to the difference between OUT_OUT compared with IN_OUT and CN_OUT, and the interaction of response field with the temporal stimulus relationship was a significant source of the variance in firing rates (p < 0.0005, Table 2).
While the response field relationship may exhibit a weak tendency to affect the latency of the response to the contralateral stimulus (p = 0.079, Table 3) such that latencies are longer when the paired stimuli are both outside the response field, none of the pairwise comparisons between the response field categories were significantly different from each other (Fig. 6C). Thus, the response field categorization affected the variance in peak firing rates but had little effect on latencies.
Unit isolation
Peak firing rate responses of MUs were slightly but significantly higher than those of SUs (mean MU = 16.05 spikes/s ± 1.06; mean SU = 13.22 spikes/s ± 0.92; p = 0.043) (Fig. 5D). Similarly, excitatory response latencies of MUs were slightly, but significantly faster than those of SUs (mean MU = 22.37 ms ± 0.33; mean SU = 25.44 ms ± 0.42; p < 0.0005) (Fig. 6D).
Statistical interactions
Although the effect of the spatial stimulus relationship was not a significant source of variance in the statistical model, the interaction of temporal stimulus relationship with spatial stimulus relationship was significant for peak firing rate (p = 0.001, Table 2) and for latencies (p = 0.003, Table 3). This interaction effect resulted from the suppression relative to contralateral stimulation (17.44 spikes/s ± 0.59) that was stronger during simultaneous stimulation of mirror locations (13.40 spikes/s ± 1.02, p = 0.002) than simultaneous stimulation on nonmirror locations (14.63 spikes/s ± 1.13, p = 0.328), and the suppression when stimuli were applied asynchronously at 10 ms delays was weaker for stimulation on mirror locations (15.99 spikes/s ± 1.16, p = 1.000) than for nonmirror locations (14.11 spikes/s ± 0.42, p = 0.039). In contrast, latencies in response to bimanual stimulation differed most from latencies in response to contralateral stimulation alone (24.76 ms ± 0.37) when the stimulation sites were on nonmirror locations and the ipsilateral stimulus preceded the contralateral stimulus by 30 ms (22.89 ms ± 0.46, p = 0.026). However, this latency difference and all other pairwise differences in latency were very small (1–2 ms differences), and were thus not convincing contributions to the variance in latencies.
Notably, the interaction between the temporal stimulation category and the unit isolation was not significant for peak firing rate (p = 0.511, Table 2) or latency (p = 0.863, Table 3). We conclude that single units and multiunits behave similarly rather than differently in response to the temporal stimulation under our conditions. The three- and fourway interactions tested were not significant sources of variance and are not displayed graphically. Since the interaction of all four factors, including the signal isolation, did not contribute to the variance in the peak firing rates (p = 0.114, Table 2) and latencies (p = 0.662, Table 3), our results provided further indications that single- and multiunits appeared to behave in similar ways in response to the spatiotemporal stimulation conditions.
In summary, the peak firing rate in response to contralateral stimulation was affected by the time of onset of the contralateral and ipsilateral stimuli. While there was little difference on average between peak firing rates when the paired stimuli were presented to mirror or nonmirror locations on the hand, there was a significant spatiotemporal interaction (such that stimulation on mirror vs nonmirror locations resulted in firing rate differences depending on the stimulus onset delay). In contrast, the latency in response to the contralateral stimulus was affected little by the spatiotemporal relationship with the ipsilateral stimulus.
Firing rate modulation index
We analyzed the single unit and multiunit data together for firing rate modulation calculations because single units were not significantly different from multiunits (p = 0.261). Examples to depict population responses from recordings across the 100-electrode array are shown in Figure 7, in which we plotted the peak firing responses in a color map of the array for a subset of stimulus parameters. During stimulation on the contralateral location, groups of neurons were activated with high peak firing rates. Some of these firing rates decreased when a location on the ipsilateral hand was stimulated at the same time as the contralateral hand. When the onset of the ipsilateral stimulus preceded that of the contralateral stimulus, the peak firing rates of the active neurons were often reduced. Individual neuron units (represented by colored squares) sometimes showed different changes in firing rate under the same stimulation parameters, but the color map plots are not easily quantified. Therefore, we calculated a trial-by-trial modulation index for each unit to determine whether paired bimanual stimulation affected the response to the contralateral stimulus at a population level.
Figure 7.

Peak firing rates represented as color maps across the 100-electrode array during bimanual stimulation. Examples of the peak firing activity across the multielectrode array are shown under four experimental conditions in monkey A. Each square represents an electrode in the array and the peak firing rate value of the unit with the highest firing rate averaged over 100 trials during the 50 ms response window. The color scale ranges from 5 to 120 spikes/s, with hot colors representing higher peak firing rates. Electrodes from which no significant responses were obtained during the stimulation are indicated in dark blue (no squares). The dashed lines indicate approximate locations of the representations within area 3b. A, Peak firing rates in case A during a stimulation series on mirror locations on distal digit 2 (dD2) show that no driven activity (> 5 spikes/s) was found when a single site on the ipsilateral digit was stimulated (top left). As expected, activity was evoked when the contralateral distal digit 3 (dD3) was stimulated (top right). When the two nonmirror sites were stimulated simultaneously (lower left), peak firing rates decreased on average across the recording area; however, the effect was not uniform. When the ipsilateral digit was stimulated 100 ms before the onset of the contralateral stimulus, the firing rates were suppressed (lower right). This is one example of the response patterns that were summarized by quantifying the modulation of individual neurons across conditions.
When we tallied the response modulation types based on the spatial and temporal stimulus characteristics, we found that stimulation on mirror and nonmirror locations in which the stimulus probes were within or outside of the neuron's response field resulted in the same basic trends (Fig. 8A). Thus, stimulating matching sites did not cause stronger modulation than stimulating nonmatching sites. Summarizing over the stimulation parameters, we found that the majority of unit responses were suppressed by paired ipsilateral stimulation (1865/2994, 62.3%). Approximately one third (1005/2994, 33.6%) of the unit responses to contralateral stimulation were not significantly changed by ipsilateral stimulation. Only ∼4% of unit responses (124/2994) were facilitated by ipsilateral stimulation. The presence of response facilitation is somewhat unexpected, but only a small proportion of responses showed this form of modulation during bimanual stimulation in general.
Figure 8.
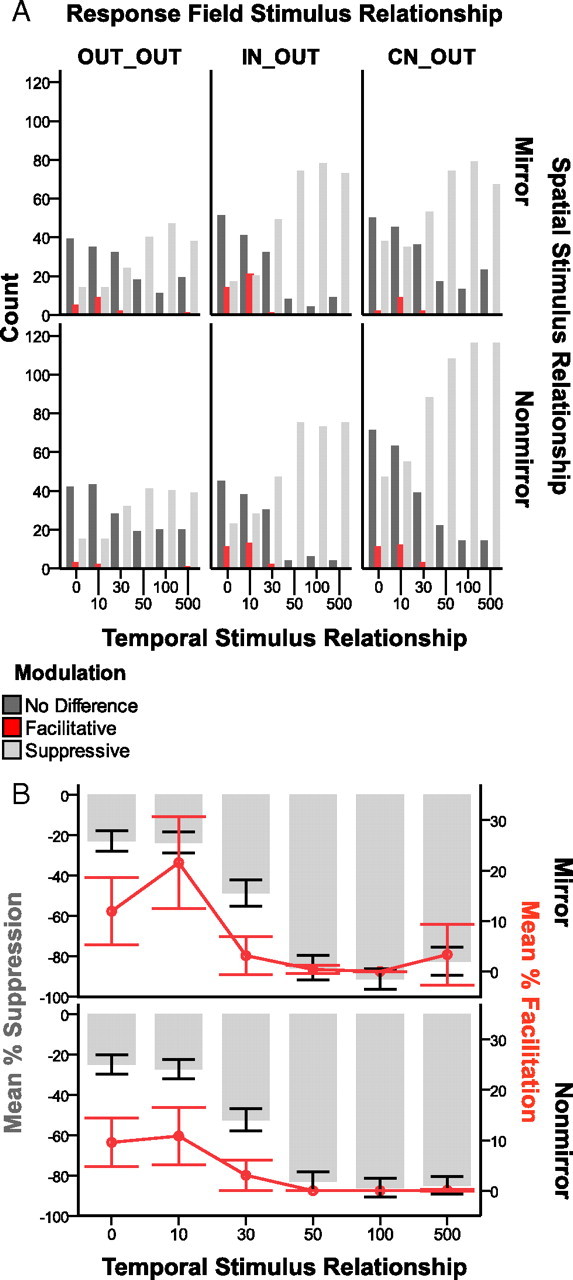
Suppression dominates firing rate modulation across spatiotemporal stimulus conditions. A, Comparing the expected sum of the responses to ipsilateral and contralateral stimulation to the actual responses resulted in modulation categories of: “No Difference” compared with the response to the contralateral stimulus alone, “Facilitative” compared with the summation of the responses of the controls, and “Suppressive” compared with the response to the contralateral control. Shaded bars represent the modulation categories. The types of paired stimulation conditions are grouped on the x-axis referring to the stimulus onset delays from 0 to 500 ms, in which the contralateral stimulus was always presented after the ipsilateral stimulus. The row panels show the total counts of these categories for the two spatial stimulus proximity categories, Mirror and Nonmirror. The column panels divide the data based on the response field category: OUT_OUT, IN_OUT, and CN_OUT. As expected, we collected fewer responses to stimulation when both stimulation sites were outside the response field of the neuron, and the counts reflect this, but the trends were the same across the categories. Suppression dominated the modulation types, particularly at longer stimulus onset delays (50–500 ms); whereas many responses were classified as no difference for short stimulus onset delays (0–30 ms). Facilitation occurred rarely, but was predominantly found when the stimulus onset delays were short (0–30 ms). B, The percentage of facilitation and suppression was quantified to provide an index for how much the peak firing rates during paired stimulation differed from expected across the temporal stimulation conditions (x-axis). The values are collapsed across the response field categories, but separate panels show the effects for stimulation on Mirror locations and Nonmirror locations. The plots have dual y-axes such that the mean percentage of suppression in each category is shown by the gray bars and the values follow the left axis. The mean percentage of facilitation is shown by the red line, and data markers and the values follow the right axis. Error bars are 95% confidence intervals. Using this index, when the response to paired stimulation does not differ from the contralateral response, the value is zero. The average percentages for suppression and facilitation include the zero values. The magnitude of facilitation dropped near zero when stimulus onsets were separated by 50–500 ms and hovered around a 10% difference when stimulus onsets were closer in time. The average magnitude of suppression was low when the stimulus onsets were close in time, and increased when the stimulus onsets were separated by longer delays. Responses were suppressed the most on average, by 92%, when mirror locations were stimulated with a 100 ms delay in stimulus onsets.
Facilitation occurred rarely, but when facilitation was found, the ipsilateral stimulus was presented at short onset delays (0, 10, or 30 ms) before the contralateral stimulus. The proportions of units showing suppression increased as the stimulus onset delays increased. Particularly when mirror locations were stimulated, the most instances of suppression were found when the ipsilateral stimulus preceded the contralateral stimulus by 100 ms. Overall, the dominant effect of a preceding ipsilateral stimulus was to suppress the response to the contralateral stimulus at long onset delays (50, 100, or 500 ms).
In addition to the increased number of suppressed responses with increasing stimulus onset delays, the magnitude of the suppression increased as well (Fig. 8B). The greatest percentage of suppression occurred when the ipsilateral stimulus preceded the contralateral stimulus by 100 ms. The magnitude of facilitation changed in an opposing manner. The magnitude of facilitation was very low when the stimuli were presented at long onset delays, and reached 10% or greater when the stimuli were presented within 10 ms of each other. The magnitude of suppression was low, but still ∼20% when stimuli were presented at short onset delays, and increased in magnitude when stimuli were presented at long onset delays. In general, both mirror and nonmirror stimulation resulted in the same trends for proportions of units suppressed, facilitated, and unchanged; however, the effects on modulation magnitude were more pronounced when mirror locations were stimulated.
Discussion
Our goal was to determine how primate somatosensory cortex responds to tactile stimuli applied to both hands. We found that ipsilateral stimuli typically reduced responses to stimuli on the contralateral hand (Table 2, Fig. 5), with only weak effects on latencies (Table 3, Fig. 6). As reported previously (Reed et al., 2010), single neurons had higher mean values for peak firing rates and lower means for latency compared with multiunits. However, as they responded similarly to spatiotemporal stimulation (Tables 2, 3), they are discussed together.
Peak firing rate
Firing was primarily suppressed by bimanual skin indentation compared with contralateral stimulation alone (Fig. 5A,B). Maximal suppression occurred when the ipsilateral stimulus preceded the contralateral stimulus onset by 100 ms (Figs. 5A, 8); however, when adjacent digits on the contralateral hand were stimulated, maximum response suppression in area 3b neurons occurred at interstimulus intervals between 30 and 50 ms (Reed et al., 2010). Thus, maximum response suppression for bimanual stimuli requires larger stimulus onset differences than paired unilateral stimuli. This timing allows for considerable cortical processing steps. However, suppression still existed when both hands were stimulated at shorter onset asynchronies, indicating that some processing occurs relatively quickly. Previous studies have not always provided clear evidence for suppressive effects of ipsilateral stimulation on area 3b neurons. For example, Burton et al. (1998) did not find strong effects of pairing ipsilateral with contralateral vibratory stimulation on neurons in area 3b (34 neurons recorded) of macaque monkeys when an ipsilateral stimulus preceded the contralateral stimulus. Human neurophysiological studies have also failed to provide consistent evidence that primary somatosensory cortex is suppressed by bimanual stimulation. For example, in magnetoencephalographic studies, Hoechstetter et al. (2001) and Disbrow et al. (2001) found that significant suppressive interactions occurred in secondary somatosensory cortex, but not primary somatosensory cortex. However, evidence for suppressive effects in area 3b was found in other studies. When a digit ipsilateral to the recorded neurons was amputated or anesthetized, the receptive field of the given neuron contralateral to the amputated or anesthetized digit increased in size (Calford and Tweedale, 1990, 1991a,b), suggesting the loss of ongoing chronic suppression from the ipsilateral hand. In an optical imaging study in squirrel monkeys, simultaneous stimulation of both hands produced less activity in contralateral areas 3b and 1 than contralateral stimulation alone (Tommerdahl et al., 2006). The fact that we found substantial numbers of neurons unaffected by bimanual stimulation (∼ 34% of responses) may relate in part to why suppressive interactions during bimanual stimulation were not always found in primary somatosensory cortex.
As inputs to area 3b are largely excitatory (Conti and Manzoni, 1994; Gonchar et al., 1995), suppressive effects of ipsilateral hand stimulation are likely mediated locally by activation of inhibitory neurons. Consistent with this possibility, suppression by an ipsilateral stimulus was not universal (Fig. 8A). While facilitative response modulation during bimanual stimulation was not reported by Burton et al. (1998) and Tommerdahl et al. (2006), the proportion of facilitated neurons in our study was low (4%), and was likely revealed by our large sample of simultaneous recordings and our variations in spatiotemporal stimulation. If the facilitative inputs to area 3b that are activated by ipsilateral stimulation contact primarily inhibitory neurons, then such small neurons are less likely to be recorded than larger excitatory pyramidal neurons (Mountcastle et al., 1969).
In addition, interhemispheric interactions within the area 3b hand representation could occur through other mechanisms. A few callosal connections exist between the hand representations in area 3b of both hemispheres (Killackey et al., 1983), a small portion of which may be inhibitory and cause direct inhibition (Conti and Manzoni, 1994) as described in rats (Gonchar et al., 1995). Because bilateral receptive fields and denser callosal connections are found for higher-order somatosensory areas, inhibitory callosal effects on these areas could result in reduced excitatory feedback input to area 3b (Fig. 9).
Figure 9.

Inter- and intrahemispheric connections in monkeys possibly mediating interhemispheric interactions in area 3b. Schematic diagram of selected somatosensory cortical areas that may mediate interhemispheric interactions in area 3b. Connections indicated are based on neuroanatomical studies and reviews (Killackey et al., 1983; Krubitzer and Kaas, 1990; Kaas, 2000; Wu and Kaas, 2003). The dotted vertical line indicates the midline separating the two cerebral hemispheres. Intrahemispheric connections are shown with thick arrows and interhemispheric connections are shown with thin arrows. The interhemispheric connection between the hand representations of area 3b is sparse (Killackey et al., 1983) and is shown by a dashed line. Otherwise, the schematic is not drawn to represent the scale of areas or the density of connections. However, the schematic illustrates the known pathways through which neurons in area 3b may be influenced by the opposite hemisphere. Note that there are no known direct ipsilateral pathways for information from the hand, thus, subcortical somatosensory areas are not shown.
Like Tommerdahl et al. (2006), we did not find significant differences between simultaneous stimulation on mirror and nonmirror hand locations, and only when we stimulated sites asynchronously did we uncover topographic specificity related to interhemispheric interactions (Figs. 5B, 8), suggesting that these effects are mediated by diffusely distributed feedback connections from areas 1, 2, S2, and PV (Cusick et al., 1989; Krubitzer and Kaas, 1990; Darian-Smith et al., 1993; Burton and Fabri, 1995; Burton et al., 1995; Angelucci et al., 2002; Disbrow et al., 2003; Shmuel et al., 2005). However, Tommerdahl et al. (2006) did not find a cortical effect on contralateral hand stimulation with simultaneous ipsilateral foot simulation, indicating that some somatotopic matching is needed for an effect.
Response latency
Response latencies showed very little variation during various types of bimanual stimulation (Fig. 6). Although we found a statistical interaction between the temporal stimulus relationship and the spatial stimulus relationship (p = 0.003, Table 3), the latency differences were only ∼1–2 ms.
Effects of bimanual stimulation on latencies of area 3b neurons in primates have not been described. However, with unilateral stimulation of the median nerve of the ipsilateral or contralateral hand alone, the onset latency of the ipsilateral field potential (mean ∼23 ms) in area 3b of macaque monkeys was much longer than the contralateral response (mean ∼ 6.4 ms), as the ipsilateral response began in extragranular layers rather than granular layers (Lipton et al., 2006). Feedback processes are likely responsible for this ipsilateral cortical activity. The latencies were shorter for local field potentials than for neuron spikes, as they reflect inputs rather than neuron action potentials, and electrical stimulation produces faster activation. Unilateral tactile stimulation activates contralateral and ipsilateral anterior parietal cortex in subsets of human subjects (Zhu et al., 2007), and ipsilateral median nerve stimulation produces evoked potentials (Noachtar et al., 1997; Sutherland and Tang, 2006) in anterior parietal fields. Electrical median nerve stimulation in humans causes unnatural sensations and causes activation in ipsilateral area 3b in primates while tactile stimulation does not [Lipton et al. (2006): macaque; Zhu et al. (2007): human]. Imaging and evoked potential measures likely include subthreshold neuron activity, unlike our electrophysiological measures of spiking output only.
Considerations and significance
As our studies were performed in anesthetized animals, the effects reflect responses to passive stimulation without influence of attention or task-relevance. While advantages of using anesthetized animals include hand stability for reproducible stimulation conditions over a large stimulus battery and removal of fluctuations due to attention, neuronal responses under anesthesia are not equivalent to responses in unanesthetized animals. Effects of propofol, the anesthetic in this experiment, are not fully known, but it is believed to act primarily as a GABAA receptor agonist (Trapani et al., 2000). With propofol, dose-dependent reductions in the amplitudes of somatosensory evoked potentials and prolonged latencies have been reported in rats (Logginidou et al., 2003). A predominance of inhibitory effects would be expected under the influence of propofol. However, in awake macaque monkeys, suppression also dominates the results of pairing ipsilateral and contralateral tactile stimulation (Burton et al., 1998).
Our suppression results likely reflect neurophysiological bases of the interference effects revealed in psychophysical studies in humans. Braun et al. (2005) found that suprathreshold stimuli applied to the left hand 200 or 500 ms before a near-threshold test stimulus on the right hand resulted in the subjects more often incorrectly identifying the location of the test stimulus. Thus, presentation of the ipsilateral stimulus “interfered” with subjects' ability to correctly localize the contralateral stimulus. Our findings that suprathreshold ipsilateral stimuli suppressed responses to suprathreshold contralateral stimuli in many neurons sampled from area 3b (∼ 62% of the responses) correspond well with human psychophysical studies such as that of Braun et al. (2005).
Our results are consistent with a mechanism through which information from one hemisphere reaches neurons in area 3b of the opposite hemisphere indirectly via callosal connections with higher-order somatosensory areas and feedback connections to area 3b. In a comparative study of primary somatosensory cortex in owl monkeys and macaque monkeys, Killackey et al. (1983) found that the area 3b representations of the hands and feet had sparse callosal connections in owl monkeys, and even sparser callosal connections in macaque monkeys. Thus, direct callosal connections are an unlikely source of the suppression in area 3b, rather, interhemispheric influences are likely to occur via cortical feedback mechanisms. Based on our findings and others', stimulation on both hands simultaneously results globally in weak suppression in both hemispheres, with facilitation in small populations of neurons. This would permit the most salient stimuli on each hand to activate area 3b neurons in the contralateral cerebral hemisphere, while suppressing responses to minor stimuli. The activity produced by the more salient stimuli would be relayed to higher cortical areas such as area 2 and S2, where neurons with bimanual excitatory receptive fields are found (for review, see Iwamura et al., 2002). An area 3b suppression of weak stimulus inputs by stronger stimulus inputs also occurs with paired stimuli on two digits of the contralateral hand (Reed et al., 2010). These unimanual and bimanual effects would facilitate tactile discrimination and the sensory guidance of motor responses.
Footnotes
This work was supported by the James S. McDonnell Foundation (J.H.K.) and National Institutes of Health Grants NS16446 (J.H.K.) and F31-NS053231 (J.L.R.). We are grateful for the guidance, assistance, space, and equipment provided by Dr. A. B. Bonds throughout these experiments. We thank Drs. M. J. Burish, Z. Zhou, and M. R. Bernard for expert assistance during surgical and recording procedures and Drs. O. Gharbawie and C. Camalier for help collecting data. Matlab scripts were written primarily by Dr. P. Pouget and J. Haitas in collaboration with J.L.R. and J. Cockhren. Dr. F. Ebner provided helpful comments on this manuscript.
References
- Alenda A, Nuñez A. Sensory-interference in rat primary somatosensory cortical neurons. Eur J Neurosci. 2004;19:766–770. doi: 10.1111/j.1460-9568.2004.03150.x. [DOI] [PubMed] [Google Scholar]
- Alvarado JC, Vaughan JW, Stanford TR, Stein BE. Multisensory versus unisensory integration: contrasting modes in the superior colliculus. J Neurophysiol. 2007;97:3193–3205. doi: 10.1152/jn.00018.2007. [DOI] [PubMed] [Google Scholar]
- Angelucci A, Levitt JB, Lund JS. Anatomical origins of the classical receptive field and modulatory surround field of single neurons in macaque visual cortical area V1. In: Azmita EC, DeFelipe J, Jones EG, Rakic P, Ribak CE, editors. Progress in brain research, Chap 29. Vol. 136. Elsevier Science B.V; 2002. pp. 373–388. [DOI] [PubMed] [Google Scholar]
- Braun C, Hess H, Burkhardt M, Wühle A, Preissl H. The right hand knows what the left hand is feeling. Exp Brain Res. 2005;162:366–373. doi: 10.1007/s00221-004-2187-4. [DOI] [PubMed] [Google Scholar]
- Burton H, Fabri M. Ipsilateral intracortical connections of physiologically defined cutaneous representations in area 3b and 1 of macaque monkeys: projections in the vicinity of the central sulcus. J Comp Neurol. 1995;355:508–538. doi: 10.1002/cne.903550404. [DOI] [PubMed] [Google Scholar]
- Burton H, Fabri M, Alloway K. Cortical areas within the lateral sulcus connected to cutaneous representations in areas 3b and 1: a revised interpretation of the second somatosensory area in macaque monkeys. J Comp Neurol. 1995;355:539–562. doi: 10.1002/cne.903550405. [DOI] [PubMed] [Google Scholar]
- Burton H, Sinclair RJ, Whang K. Vibrotactile stimulus order effects in somatosensory cortical areas of rhesus monkeys. Somatosens Mot Res. 1998;15:316–324. doi: 10.1080/08990229870727. [DOI] [PubMed] [Google Scholar]
- Calford MB. Dynamic representational plasticity in sensory cortex. Neuroscience. 2002;111:709–738. doi: 10.1016/s0306-4522(02)00022-2. [DOI] [PubMed] [Google Scholar]
- Calford MB, Tweedale R. Interhemispheric transfer of plasticity in the cerebral cortex. Science. 1990;249:805–807. doi: 10.1126/science.2389146. [DOI] [PubMed] [Google Scholar]
- Calford MB, Tweedale R. Acute changes in cutaneous receptive fields in primary somatosensory cortex after digit denervation in adult flying fox. J Neurophysiol. 1991a;65:178–187. doi: 10.1152/jn.1991.65.2.178. [DOI] [PubMed] [Google Scholar]
- Calford MB, Tweedale R. Immediate expansion of receptive fields of neurons in area 3b of macaque monkeys after digit denervation. Somatosens Mot Res. 1991b;8:249–260. doi: 10.3109/08990229109144748. [DOI] [PubMed] [Google Scholar]
- Chowdhury SA, Rasmusson DD. Corticocortical inhibition of peripheral inputs within primary somatosensory cortex: the role of GABAA and GABAB receptors. J Neurophysiol. 2003;90:851–856. doi: 10.1152/jn.01059.2002. [DOI] [PubMed] [Google Scholar]
- Conti F, Manzoni T. The neurotransmitters and postsynaptic action of callosally projecting neurons. Behav Brain Res. 1994;64:37–53. doi: 10.1016/0166-4328(94)90117-1. [DOI] [PubMed] [Google Scholar]
- Cusick CG, Wall JT, Felleman DJ, Kaas JH. Somatotopic organization of the lateral sulcus of owl monkeys: area 3b, S-II, and a ventral somatosensory area. J Comp Neurol. 1989;282:169–190. doi: 10.1002/cne.902820203. [DOI] [PubMed] [Google Scholar]
- Darian-Smith C, Darian-Smith I, Burman K, Ratcliffe N. Ipsilateral cortical projections to areas 3a, 3b, and 4 in the macaque monkey. J Comp Neurol. 1993;335:200–213. doi: 10.1002/cne.903350205. [DOI] [PubMed] [Google Scholar]
- Davidson AG, O'Dell R, Chan V, Schieber MH. Comparing effects in spike-triggered averages of rectified EMG across different behaviors. J Neurosci Materials and Methods. 2007;163:283–294. doi: 10.1016/j.jneumeth.2007.03.010. [DOI] [PMC free article] [PubMed] [Google Scholar]
- Disbrow E, Roberts T, Poeppel D, Krubitzer L. Evidence for interhermispheric processing of inputs from the hands in human S2 and PV. J Neurophysiol. 2001;85:2236–2244. doi: 10.1152/jn.2001.85.5.2236. [DOI] [PubMed] [Google Scholar]
- Disbrow E, Litinas E, Recanzone GH, Padberg J, Krubitzer L. Cortical connections of the second somatosensory area and the parietal ventral area in macaque monkeys. J Comp Neurol. 2003;462:382–399. doi: 10.1002/cne.10731. [DOI] [PubMed] [Google Scholar]
- Gallyas F. Silver staining of myelin by means of physical development. Neurol Res. 1979;1:203–209. doi: 10.1080/01616412.1979.11739553. [DOI] [PubMed] [Google Scholar]
- Gardner EP, Costanzo RM. Temporal integration of multiple-point stimuli in primary somatosensory cortical receptive fields of alert monkeys. J Neurophysiol. 1980;43:444–468. doi: 10.1152/jn.1980.43.2.444. [DOI] [PubMed] [Google Scholar]
- Gonchar YA, Johnson PB, Weinberg RJ. GABA-immunopositive neurons in rat neocortex with contralateral projections to S-I. Brain Res. 1995;697:27–34. doi: 10.1016/0006-8993(95)00746-d. [DOI] [PubMed] [Google Scholar]
- Greek KA, Chowdhury SA, Rasmusson DD. Interactions between inputs from adjacent digits in somatosensory thalamus and cortex of the raccoon. Exp Brain Res. 2003;151:364–371. doi: 10.1007/s00221-003-1493-6. [DOI] [PubMed] [Google Scholar]
- Hardin JW, Hilbe JM. Generalized estimating equations. Boca Raton, FL: Chapman and Hall/CRC; 2003. pp. 58–76. [Google Scholar]
- Hoechstetter K, Rupp A, Stancák A, Meinck HM, Stippich C, Berg P, Scherg M. Interaction of tactile input in the human primary and secondary somatosensory cortex—a magnetoencephalographic study. Neuroimage. 2001;14:759–767. doi: 10.1006/nimg.2001.0855. [DOI] [PubMed] [Google Scholar]
- Iwamura Y, Tanaka M, Iriki A, Taoka M, Toda T. Processing of tactile and kinesthetic signals from bilateral sides of the body in the postcentral gyrus of awake monkeys. Behav Brain Res. 2002;135:185–190. doi: 10.1016/s0166-4328(02)00164-x. [DOI] [PubMed] [Google Scholar]
- Jain N, Catania KC, Kaas JH. A histologically visible representation of the fingers and palm in primate area 3b and its immutability following long term deafferentation. Cereb Cortex. 1998;8:227–236. doi: 10.1093/cercor/8.3.227. [DOI] [PubMed] [Google Scholar]
- Jain N, Qi HX, Catania KC, Kaas JH. Anatomic correlates of the face and oral cavity representations in the somatosensory cortical area 3b of monkeys. J Comp Neurol. 2001a;429:455–568. doi: 10.1002/1096-9861(20010115)429:3<455::aid-cne7>3.0.co;2-f. [DOI] [PubMed] [Google Scholar]
- Jain N, Qi HX, Kaas JH. Long-term chronic multichannel recordings from sensorimotor cortex and thalamus of primates. In: Nicolelis MAL, editor. Progress in brain research, Chap 5. Vol. 130. Elsevier Science B.V; 2001b. pp. 1–10. [PubMed] [Google Scholar]
- Jiang W, Stein BE. Cortex controls multisensory depression in superior colliculus. J Neurophys. 2003;90:2123–2135. doi: 10.1152/jn.00369.2003. [DOI] [PubMed] [Google Scholar]
- Kaas JH. The reorganization of somatosensory and motor cortex after peripheral nerve or spinal cord injury in primates. Prog Brain Res. 2000;128:173–179. doi: 10.1016/S0079-6123(00)28015-1. [DOI] [PubMed] [Google Scholar]
- Killackey HP, Gould HJ, III, Cusick CG, Pons TP, Kaas JH. The relation of corpus callosum connections to architectonic fields and body surface maps in sensorimotor cortex of new and old world monkeys. J Comp Neurol. 1983;219:384–419. doi: 10.1002/cne.902190403. [DOI] [PubMed] [Google Scholar]
- Krubitzer LA, Kaas JH. The organization and connections of somatosensory cortex in marmosets. J Neurosci. 1990;10:952–974. doi: 10.1523/JNEUROSCI.10-03-00952.1990. [DOI] [PMC free article] [PubMed] [Google Scholar]
- Liang KY, Zeger SL. Longitudinal data analysis using generalized linear models. Biometrika. 1986;73:13–22. [Google Scholar]
- Lipton ML, Fu KM, Branch CA, Schroeder CE. Ipsilateral hand input to area 3b revealed by converging hemodynamic and electrophysiological analyses in macaque monkeys. J Neurosci. 2006;26:180–185. doi: 10.1523/JNEUROSCI.1073-05.2006. [DOI] [PMC free article] [PubMed] [Google Scholar]
- Logginidou HG, Li BH, Li DP, Lohmann JS, Schuler HG, DiVittore NA, Kreiser S, Cronin AJ. Propofol suppresses the cortical somatosensory evoked potential in rats. Anesth Analg. 2003;97:1784–1788. doi: 10.1213/01.ANE.0000090318.16879.A8. [DOI] [PubMed] [Google Scholar]
- Mason A, Nicoll A, Stratford K. Synaptic transmission between individual pyramidal neurons of the rat visual cortex in vitro. J Neurosci. 1991;11:72–84. doi: 10.1523/JNEUROSCI.11-01-00072.1991. [DOI] [PMC free article] [PubMed] [Google Scholar]
- Merzenich MM, Kaas JH, Sur M, Lin CS. Double representations of the body surface within cytoarchitectonic areas 3b and 1 in “SI” in the owl monkey (Aotus trivirgatus) J Comp Neurol. 1978;181:41–73. doi: 10.1002/cne.901810104. [DOI] [PubMed] [Google Scholar]
- Merzenich MM, Kaas JH, Wall J, Nelson RJ, Sur M, Felleman D. Topographic reorganization of somatosensory cortical areas 3b and 1 in adult monkeys following restricted deafferentation. Neuroscience. 1983;8:33–55. doi: 10.1016/0306-4522(83)90024-6. [DOI] [PubMed] [Google Scholar]
- Moore CI, Nelson SB. Spatio-temporal subthreshold receptive fields in the vibrissa representation of rat primary somatosensory cortex. J Neurophysiol. 1998;80:2882–2892. doi: 10.1152/jn.1998.80.6.2882. [DOI] [PubMed] [Google Scholar]
- Mountcastle VB, Talbot WH, Sakata H, Hyvärinen J. Cortical neuronal mechanisms in flutter-vibration studied in unanesthetized monkeys. Neuronal periodicity and frequency discrimination. J Neurophysiol. 1969;32:452–484. doi: 10.1152/jn.1969.32.3.452. [DOI] [PubMed] [Google Scholar]
- Nelson RJ, Sur M, Felleman DJ, Kaas JH. Representations of the body surface in postcentral parietal cortex of Macaca fascicularis. J Comp Neurol. 1980;192:611–643. doi: 10.1002/cne.901920402. [DOI] [PubMed] [Google Scholar]
- Nicolelis MA, Dimitrov D, Carmena JM, Crist R, Lehew G, Kralik JD, Wise SP. Chronic, multisite, multielectrode recordings in macaque monkeys. Proc Natl Acad Sci U S A. 2003;100:11041–11046. doi: 10.1073/pnas.1934665100. [DOI] [PMC free article] [PubMed] [Google Scholar]
- Noachtar S, Lüders HO, Dinner DS, Klem G. Ipsilateral median somatosensory evoked potentials recorded from human somatosensory cortex. Electroencephalogr Clin Neurophysiol. 1997;104:189–198. doi: 10.1016/s0168-5597(97)00013-0. [DOI] [PubMed] [Google Scholar]
- Ogawa S, Lee TM, Stepnoski R, Chen W, Zhu XH, Ugurbil K. An approach to probe some neural systems interaction by functional MRI at neural time scale down to milliseconds. Proc Natl Acad Sci U S A. 2000;97:11026–11031. doi: 10.1073/pnas.97.20.11026. [DOI] [PMC free article] [PubMed] [Google Scholar]
- Pons TP, Wall JT, Garraghty PE, Cusick CG, Kaas JH. Consistent features of the representation of the hand in area 3b of macaque monkeys. Somatosens Res. 1987;4:309–331. doi: 10.3109/07367228709144612. [DOI] [PubMed] [Google Scholar]
- Reed JL, Kaas JH. Statistical analysis of large-scale neuronal recording data. Neural Netw. 2010;23:673–684. doi: 10.1016/j.neunet.2010.04.005. [DOI] [PMC free article] [PubMed] [Google Scholar]
- Reed JL, Pouget P, Qi HX, Zhou Z, Bernard MR, Burish MJ, Haitas J, Bonds AB, Kaas JH. Widespread spatial integration in primary somatosensory cortex. Proc Natl Acad Sci U S A. 2008;105:10233–10237. doi: 10.1073/pnas.0803800105. [DOI] [PMC free article] [PubMed] [Google Scholar]
- Reed JL, Qi HX, Zhou Z, Bernard MR, Burish MJ, Bonds AB, Kaas JH. Response properties of neurons in primary somatosensory cortex of owl monkeys reflect widespread spatiotemporal integration. J Neurophysiol. 2010;103:2139–2157. doi: 10.1152/jn.00709.2009. [DOI] [PMC free article] [PubMed] [Google Scholar]
- Samonds JM, Allison JD, Brown HA, Bonds AB. Cooperation between area 17 neuron pairs enhances fine discrimination of orientation. J Neurosci. 2003;23:2416–2425. doi: 10.1523/JNEUROSCI.23-06-02416.2003. [DOI] [PMC free article] [PubMed] [Google Scholar]
- Schnitzler A, Salmelin R, Salenius S, Jousmäki V, Hari R. Tactile information from the human hand reaches the ipsilateral primary somatosensory cortex. Neurosci Lett. 1995;200:25–28. doi: 10.1016/0304-3940(95)12065-c. [DOI] [PubMed] [Google Scholar]
- Shin HC, Won CK, Jung SC, Oh S, Park S, Sohn J-H. Interhemispheric modulation of sensory transmission in the primary somatosensory cortex of rats. Neurosci Lett. 1997;230:137–139. doi: 10.1016/s0304-3940(97)00486-2. [DOI] [PubMed] [Google Scholar]
- Shmuel A, Korman M, Sterkin A, Harel M, Ullman S, Malach R, Grinvald A. Retinotopic axis specificity and selective clustering of feedback projections from V2 to V1 in the owl monkey. J Neurosci. 2005;25:2117–2131. doi: 10.1523/JNEUROSCI.4137-04.2005. [DOI] [PMC free article] [PubMed] [Google Scholar]
- Shoham S, Fellows MR, Normann RA. Robust, automatic spike sorting using mixtures of multivariate t-distributions. J Neurosci Materials and Methods. 2003;127:111–122. doi: 10.1016/s0165-0270(03)00120-1. [DOI] [PubMed] [Google Scholar]
- Stanford TR, Quessy S, Stein BE. Evaluating the operations underlying multisensory integration in the cat superior colliculus. J Neurosci. 2005;25:6499–6508. doi: 10.1523/JNEUROSCI.5095-04.2005. [DOI] [PMC free article] [PubMed] [Google Scholar]
- Sutherland MT, Tang AC. Reliable detection of bilateral activation in human primary somatosensory cortex by unilateral median nerve stimulation. Neuroimage. 2006;33:1042–1054. doi: 10.1016/j.neuroimage.2006.08.015. [DOI] [PubMed] [Google Scholar]
- Tommerdahl M, Simons SB, Chiu JS, Favorov O, Whitsel BL. Ipsilateral input modifies the primary somatosensory cortex response to contralateral skin flutter. J Neurosci. 2006;26:5970–5977. doi: 10.1523/JNEUROSCI.5270-05.2006. [DOI] [PMC free article] [PubMed] [Google Scholar]
- Trapani G, Altomare C, Liso G, Sanna E, Biggio G. Propofol in anesthesia. Mechanism of action, structure-activity relationships, and drug delivery. Curr Med Chem. 2000;7:249–271. doi: 10.2174/0929867003375335. [DOI] [PubMed] [Google Scholar]
- Tutunculer B, Foffani G, Himes BT, Moxon KA. Structure of the excitatory receptive fields of infragranular forelimb neurons in the rate primary somatosensory cortex responding to touch. Cereb Cortex. 2006;16:791–810. doi: 10.1093/cercor/bhj023. [DOI] [PubMed] [Google Scholar]
- Veredas FJ, Vico FJ, Alonso JM. Factors determining the precision of the correlated firing generated by a monosynaptic connection in the cat visual pathway. J Physiol 567. 2005;3:1057–1078. doi: 10.1113/jphysiol.2005.092882. [DOI] [PMC free article] [PubMed] [Google Scholar]
- Wu CW, Kaas JH. Somatosensory cortex of prosimian galagos: physiological recording, cytoarchitecture, and cortiocortical connections of anterior parietal cortex and cortex of the lateral sulcus. J Comp Neurol. 2003;457:263–292. doi: 10.1002/cne.10542. [DOI] [PubMed] [Google Scholar]
- Zeger SL, Liang KY. Longitudinal data analysis for discrete and continuous outcomes. Biometrics. 1986;42:121–130. [PubMed] [Google Scholar]
- Zhu Z, Disbrow EA, Zumer JM, McGonigle DJ, Nagarajan SS. Spatiotemporal integration of tactile information in human somatosensory cortex. BMC Neurosci. 2007;8:21. doi: 10.1186/1471-2202-8-21. [DOI] [PMC free article] [PubMed] [Google Scholar]