

Abstract
Recent reports showed noxious forepaw stimulation in rats evoked an unexpected sustained decrease in cerebral blood volume (CBV) in the bilateral striatum, whereas increases in spike activity and Fos-immunoreactive cells were observed. This study aimed to further evaluate the hemodynamic and metabolic needs in this model and the sources of negative functional magnetic resonance imaging (fMRI) signals by measuring blood oxygenation-level-dependent (BOLD), cerebral-blood-flow (CBF), CBV, and oxygen-consumption (i.e., cerebral metabolic rate of oxygen (CMRO2)) changes using an 11.7-T MRI scanner, and glucose-consumption (i.e., cerebral metabolic rate of glucose (CMRglc)) changes using micro-positron emission tomography. In the contralateral somatosensory cortex, BOLD, CBF, CBV, CMRO2 (n=7, P<0.05), and CMRglc (n=5, P<0.05) increased. In contrast, in the bilateral striatum, BOLD, CBF, and CBV decreased (P<0.05), CMRO2 decreased slightly, although not significantly from baseline, and CMRglc was not statistically significant from baseline (P>0.05). These multimodal functional imaging findings corroborate the unexpected negative hemodynamic changes in the striatum during noxious forepaw stimulation, and support the hypothesis that striatal hemodynamic response is dominated by neurotransmitter-mediated vasoconstriction, overriding the stimulus-evoked fMRI signal increases commonly accompany elevated neuronal activity. Multimodal functional imaging approach offers a means to probe the unique attributes of the striatum, providing novel insights into the neurovascular coupling in the striatum. These findings may have strong implications in fMRI studies of pain.
Keywords: CBF, CBV, CMRglc, CMRO2, high-field fMRI, striatum
Introduction
The striatum receives numerous afferent inputs from different brain regions and acts as an important neurochemical signal relay in the brain (Graybiel, 1990), including motor, cognitive functions, and many other aspects of brain signaling. Accumulating evidence suggests that the striatum also has a key role in mediating pain processing, such as sensory discrimination, affective and cognitive control, and modulating nociceptive information, as well as gating nociceptive information to higher motor areas (Chudler and Dong, 1995). The striatum receives inputs from numerous pain-associated regions, including the prefrontal cortex, primary and secondary somatosensory cortices, area 7b, anterior cingulate cortex, central nucleus of amygdala, substantia nigra pars compacta, centromedian–parafascicular complex, thalamic nucleus submedius, and dorsal raphe. The striatum also directly projects to the globus pallidus and substantia nigra pars reticulata (Chudler and Dong, 1995). Dysfunctions of the striatum have been implicated in many neurologic disorders, including Parkinson's disease and Huntington's disease (Wichmann and DeLong, 1996).
Functional magnetic resonance imaging (fMRI) study of the striatum in animal models is challenging because anesthetics suppress higher-order brain function, including that of the striatum. Pain stimulation has been reported to reduce cerebral blood flow (CBF) in the striatum of conscious rats using autoradiography (Morrow et al, 1998). Electrical somatosensory stimulation reduced blood oxygenation-level-dependent (BOLD) fMRI signals in medetomidine-sedated rats (Pawela et al, 2010; Zhao et al, 2008). We have recently reported that unilateral noxious forepaw electrical stimulation evoked a sustained negative cerebral-blood-volume (CBV) fMRI response in the bilateral striatum of α-chloralose-anesthetized rats. Surprisingly, these negative CBV fMRI responses were accompanied by increases in neuronal-spiking activities and Fos-immunoreactive cells (Shih et al, 2009), which should have resulted in increased CBV fMRI responses. These unexpected changes suggest a complete neurovascular uncoupling of CBV in the striatum associated with noxious stimulation. Moreover, preinjection of either a dopamine D2/D3 receptor antagonist (Shih et al, 2009) or a μ-opioid receptor antagonist (Shih et al, 2010), known to reduce endogenous pain inhibition, significantly attenuated the magnitude of stimulation-evoked negative CBV fMRI signal changes. The unilateral lesion of dopamine neurons in the substantia nigra using 6-hydroxydopamine (Chen et al, 2009) also significantly reduced the magnitude of stimulation-evoked negative CBV fMRI responses in the ipsilateral striatum. These results suggest unique vasoconstriction in the striatum, which overrides the stimulus-evoked increases in CBV fMRI signals commonly accompanied by increased neuronal activity. It remains unknown how metabolic needs are adequately met during increased neuronal activity in the presence of such substantial vasoconstriction and how other hemodynamic parameters (such as BOLD and CBF) respond to such stimulation. Importantly, understanding of the sources of negative hemodynamic changes would help to avoid erroneous interpretation of pain-induced fMRI data in the striatum.
To further evaluate the metabolic needs in the striatum and the sources of negative fMRI signal changes, we measured the stimulus-evoked changes of multiple hemodynamic parameters, oxygen consumption, and glucose consumption in the striatum and the cortex associated with noxious forepaw electrical stimulations. BOLD and CBF fMRI were measured using the continuous arterial spin labeling (CASL) technique (Silva et al, 1999), and CBV fMRI was measured using monocrystalline iron oxide nanoparticles (MIONs) (Mandeville et al, 1998) in the same animal at 11.7 T. Cerebral metabolic rate of oxygen (CMRO2) changes were estimated using calibrated fMRI and the biophysical BOLD model by Davis et al (1998). Stimulus-evoked cerebral metabolic rate of glucose (CMRglc) changes were measured using 18F-fluorodeoxyglucose (18F-FDG) positron emission tomography (PET). Neurovascular–metabolic couplings among these parameters were analyzed. Comparisons were also made with noxious hindpaw and innocuous forepaw stimulations. These results have strong implications in fMRI studies of pain in general, and in fMRI studies of neural systems mediated by opioid-dopamine neurotransmission in particular.
Materials and methods
Experimental Design
A total of 17 adult male Sprague Dawley rats (weighing 250 to 300 g; Charles River Laboratories, Wilmington, MA, USA) were studied. All experimental procedures were approved by the Institutional of Animal Care and Utilization Committee, UT Health Science Center at San Antonio. Animals were housed in the vivarium (12:12-hour light–dark cycle, controlled humidity and temperature) with free access to food and water. The following groups of experiments were performed. Blood oxygen-level-dependent and CBF fMRI of hypercapnic (5% CO2) challenges (n=7) and noxious forepaw electrical stimulation were studied. Thereafter, MION (30 mg/kg, intravenous) fMRI of noxious forepaw electrical stimulation was measured in the same animals. In all, 2 to 10 repeated trials were made on each measurement. In a subgroup of rats (n=5 of 7), CBV fMRI responses to innocuous forepaw stimulation and noxious hindpaw stimulation were also measured. In a separate group of animals, 18F-FDG PET was performed with noxious stimulation (n=5) and without stimulation (n=5).
Rats were initially anesthetized with 3% isoflurane and orally intubated for mechanical ventilation (Harvard Model 683 Small Animal Ventilator, Holliston, MA, USA). The right femoral vein and the lateral tail vein were catheterized for subsequent drug administration. After the animal was secured in an MRI-compatible rat stereotaxic headset, isoflurane was discontinued and α-chloralose (60 mg/kg first dose, followed by 30 mg/kg per h, intravenous infusion) was administered for anesthesia. The rat was then paralyzed with pancuronium bromide (3 mg/kg first dose, followed by 1.5 mg/kg per h, intravenous). End-tidal CO2 was continuously monitored using a capnometer (Surgivet, Smith Medical, Waukesha, WI, USA). Noninvasive end-tidal CO2 values were previously calibrated against invasive blood-gas samplings under identical conditions (Sicard et al, 2003). Rectal temperature was maintained at 37.0°C±0.5°C using a circulating warm-water pad. Heart rate and blood oxygen saturation level were monitored using MouseOx system (STARR Life Science, Oakmont, PA, USA). All recorded physiologic parameters were maintained within normal ranges.
Forepaw Stimulation
Electrical stimulation was unilaterally applied to either the right forepaw or the left hindpaw. Two needle electrodes were inserted under the skin of the paw: one between the first and second digits and the other between the third and fourth digits. These electrodes were then fixed using surgical tape and the patency was confirmed by digit twitching. Electrical stimulation at 10 (noxious) and 1 mA (innocuous, Van et al, 2006) with a 3-Hz square wave and 10-ms pulse duration was applied to the same rats by a constant-current stimulator (model 2100, AM Systems, Carlsburg, WA, USA). It must be noted that a 0.3-ms pulse width has been widely used to evoke the response in the S1FL area of the rat brain under α-chloralose anesthesia, but the optimal stimulation parameters to evoke changes in the striatum remain to be determined. Previous findings reported that the degree of striatal vasoconstriction was positively correlated with nociception (Shih et al, 2009; Zhao et al, 2008). Longer stimulation duration and higher stimulus intensity were thus used so as to evoke stronger striatal response in this study. The electrical stimulation paradigm was OFF–ON–OFF–ON–OFF, where OFF=2 minutes and ON=1 minute.
Functional Magnetic Resonance Imaging Experiments
Functional magnetic resonance imaging used an 11.7-T/16-cm magnet and a 74-G/cm B-GA9S gradient insert (Bruker, Billerica, MA, USA). A custom-made small circular surface coil (inner diameter ∼2 cm) was placed on the rat head. Magnetic field homogeneity was optimized using standard FASTMAP shimming with first-order shims on an isotropic voxel of 7 × 7 × 7 mm3 encompassing the imaging slices. A T2-weighted pilot image was taken in the mid-sagittal plane to localize the anatomic position by identifying the anterior commissure (bregma −0.8 mm). Combined BOLD and CBF fMRI was acquired using CASL, single-shot gradient echo, repetition time=3,000 ms, echo time=10.5 milliseconds, labeling duration=2.9 seconds, bandwidth=300 kHz, matrix size=64 × 64 (zero-filled to 128 × 128), field of view=2.24 × 2.24 cm, slice thickness=1.5 mm, and nominal in-plane resolution=175 × 175 μm. For CBV-weighted fMRI, the imaging parameters were identical to CASL, except no labeling was applied and repetition time=1,500 ms.
Positron Emission Tomography Experiments
Positron emission tomography studies used a Focus 220 microPET (Siemens Medical Solutions, Knoxville, TN, USA). A dose of 2.0 to 2.2 mCi (∼0.5 mL) 18F-FDG was administered through the femoral vein. Three-dimensional list-mode data were collected for 70 minutes after the 18F-FDG injection. Positron emission tomography image reconstruction was performed by the MAP-OSEM algorithm with a setting provided by the scanner manufacturer, resulting in matrix size=256 × 256 × 96 and voxel size=475 × 475 × 796 μm. Animals were prepared and monitored in a similar manner as in fMRI experiments, except that the repeated OFF–ON stimulation paradigm was performed during the entire data acquisition, where OFF=1 minute and ON=1 minute.
Data Analysis
Image and region-of-interest (ROI) analyses were performed using a custom-built image processing interface (Shih et al, 2007, 2008a) based on the rat brain atlas and MANGO (Research Imaging Institute, UT Health Science Center at San Antonio, TX, USA; http://ric.uthscsa.edu/mango/). Correlation coefficient analysis was performed on a pixel-by-pixel basis to correlate multimodal fMRI signal changes with the stimulation paradigm. Blood oxygen-level-dependent time-series images were obtained from nonlabeled images of the CASL data, whereas quantitative CBF data in units of mL/g per min were calculated as (Duong et al, 2000):
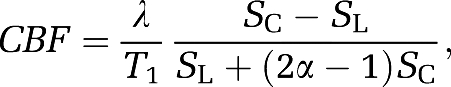 |
where SC and SL are MR signal intensities from the control and labeled images, respectively. λ is the water brain–blood partition coefficient, T1 that of tissue, and α the arterial spin-labeling efficiency. The values of λ, T1, and α were 0.9 (Herscovitch and Raichle, 1985), 2 seconds, and 0.7 respectively.
The stimulus-evoked ΔR2* value, which varies linearly with the stimulus-evoked CBV fraction, was calculated as follows (Mandeville et al, 1998) after MION injection:
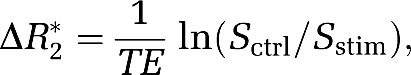 |
where Sctrl and Sstim are the MR signal intensities before and during stimulation, respectively.
The stimulus-evoked percent-CBV change was further computed by dividing the basal CBV:
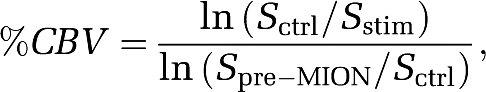 |
where Spre-MION is the MR signal intensity before MION injection.
Cerebral metabolic rate of oxygen percent changes were calculated from the BOLD, CBF, and CBV data using the model by Davis et al (1998) as follows:
 |
where β=1.5 was used (Hoge et al, 1999), and M was calculated from hypercapnia (5% CO2 challenge) data using CASL only (Liu et al, 2004; Shen et al, 2008):
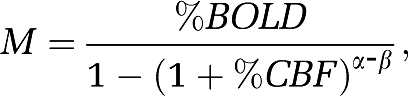 |
where α=0.38 was used to estimate CBV changes (Grubb et al, 1974).
Rectangular ROIs located at the contralateral S1FL and the ipsilateral CPu were used to plot fMRI time courses (see Figure 2A). Regions of interest were centered on the strongest responsive region based on the CASL data. Changes of each fMRI signals (BOLD, CBF, CBV, and CMRO2) in each animal were obtained from the same ROIs. To quantify group-averaged percent signal changes for each fMRI modality, the ROIs were defined through a coregistered MR image and a digitized Paxinos and Watson's rat brain atlas using the method proposed previously (Shih et al, 2007, 2008a) (see Figures 3 and 4). A single ROI defined on the atlas was applied for each animal to avoid bias to a particular activation map.
Blood oxygen-level-dependent, CBF, CBV, and CMRO2 percent changes were tabulated for the primary somatosensory cortex of the forepaw (S1FL) and for the striatum of both hemispheres. In addition, the ipsilateral striatum was divided into four ROIs, including the dorsal medial, dorsal lateral, ventral medial, and ventral lateral parts for subsequent analysis.
Percent changes of CMRglc were computed by normalizing the PET signal intensity to the posterior parietal cortex as:
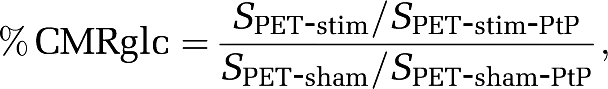 |
where SPET-stim and SPET-sham are the 18F-FDG signal intensities from the stimulation and sham control group, respectively. SPET-stim-PtP and SPET-sham-PtP are the signal intensities in the posterior parietal cortex. This posterior parietal cortex has been shown to have no CMRglc changes to noxious stimuli (Mao et al, 1993) and was verified not to change during stimulation. Three-dimensional coregistration was performed using the MANGO software and ROIs were defined on the group-averaged data (see Figure 5), with S1FL=16 voxels, CPu=23 voxels, and posterior parietal cortex=12 voxels. Regions of interest were then applied for each animal. Percent CMRglc changes of the primary somatosensory cortex and striatum in each animal were obtained from the same ROIs.
Statistical analysis was performed using the SPSS software (SPSS, Chicago, IL, USA). Paired t-test was used to assess the difference between the two hemispheres. Independent t-test was used to compare the difference between the sham control and stimulation group in the PET study. Multiple comparisons of the fMRI responses in four operationally defined striatal subregions were performed by ANOVA (analysis of variance). Homogeneity of the variances was assessed by Levene's test, in which samples with equal variances were followed by Fisher's post hoc test. The significance level was set at P<0.05.
Results
Innocuous Versus Noxious Stimulation
The effects of innocuous (1 mA) and noxious (10 mA) forepaw stimulation were studied using CBV-weighted fMRI (n=5). Figure 1A shows that striatal vasoconstriction was elicited by 10-mA right forepaw electrical stimulation, but not by 1 mA. In addition, the 10-mA forepaw stimulation evoked significantly stronger vasodilation in the contralateral S1FL than did the 1-mA stimulation (P<0.05; Figure 1B).
Figure 1.

Effect of innocuous forepaw, noxious forepaw, and noxious hindpaw electrical stimulation. (A) CBV-weighted fMRI of the two imaging slices from a representative animal. Contralateral activation of the sensory cortices can be consistently observed, but striatal vasoconstriction can be detected only under noxious stimulation. (B) Group-averaged percent-CBV changes of innocuous and noxious stimulation in the contralateral S1FL (see Figure 2 for ROIs; n=5). Significant stronger vasodilation was observed with 10-mA stimulation. (C) Group-averaged percent-CBV changes in the ipsilateral striatum under noxious stimulation (n=5). Significant stronger vasoconstriction was observed with noxious forepaw stimulation. Although the magnitude change was significantly different, the spatial distribution of the striatal vasoconstrictive pattern was very similar in noxious right forepaw and noxious left hindpaw stimulation. *P<0.05, significant. Error bars represent s.e.m. values. CBV, cerebral blood volume; fMRI, functional magnetic resonance imaging; ROI, region of interest.
Hindpaw stimulation was also studied. The vasodilative response in the contralateral S1 evoked by hindpaw stimulation was more medial and posterior to the forepaw region, as expected based on rat somatotopic organization. Spatial distribution of the striatal vasoconstriction was similar between noxious hindpaw and noxious forepaw stimulation, although responses of noxious forepaw stimulation were larger than those of the hindpaw (P<0.05; Figure 1C). Striatal vasoconstrictive response to noxious stimulation was not limited to forepaw stimulation.
Multiparametric Functional Magnetic Resonance Imaging of the Noxious Forepaw Stimulation
Increases in BOLD, CBF, CBV, and CMRO2 were observed in the contralateral S1FL after noxious forepaw stimulation, whereas sustained BOLD, CBF, and CBV fMRI decreases were found in the bilateral striatum (Figure 2A). A slight decrease in CMRO2 was detected in the striatum but was not statistically significant from baseline. Figure 2B shows the averaged signal time courses of the contralateral S1FL and ipsilateral striatum (n=7). In the contralateral S1FL, an initial overshoot after stimulus onset was observed in BOLD and CBF, but not in CBV. Poststimulus undershoot was observed in BOLD and CBV, but not in CBF. The CBV undershoot was unlikely caused by the signal drift or MION washout. Compared with S1FL, no apparent overshoot or undershoot was observed in the striatal BOLD and CBF, whereas a slight poststimulus CBV increase was detected. Group-averaged BOLD, CBF, CBV, and CMRO2 changes in the S1FL and the striatum of both hemispheres are summarized in Figure 3 (n=7). Paired t-test indicated that a significant ipsilateral and contralateral difference was found in the S1FL (P<0.05), but not in the striatum as detected by all four fMRI modalities.
Figure 2.

Multiparametric fMRI of noxious forepaw electrical stimulation. (A) BOLD, CBF, CBV, and CMRO2 maps from a representative animal. Increases in BOLD, CBF, CBV, and CMRO2 were predominantly localized in the S1FL, whereas decreases of these fMRI signals were found in the bilateral striatum. It must be noted that only a slight decrease in the striatal CMRO2 was observed. (B) Group-averaged fMRI time courses of the contralateral S1FL and ipsilateral striatum (ROIs shown in the % BOLD map; n=7). The color-shaded regions indicate stimulus ON epochs. Error bars represent s.e.m. values. BOLD, blood oxygen-level dependent; CBF, cerebral blood flow; CBV, cerebral blood volume; CMRO2, cerebral metabolic rate of oxygen; fMRI, functional magnetic resonance imaging; ROI, region of interest.
Figure 3.

Group-averaged percent-BOLD, CBF, CBV, and CMRO2 changes in the S1FL and the striatum of both hemispheres (n=7). The ROIs (inset) were defined by anatomy to avoid bias to a particular activation map. Clear lateralization of the stimulus-evoked response was found in the S1FL, but not in the striatum in all four fMRI modalities. **P<0.01, significant. Error bars represent s.e.m. values. BOLD, blood oxygen-level dependent; CBF, cerebral blood flow; CBV, cerebral blood volume; CMRO2, cerebral metabolic rate of oxygen; fMRI, functional magnetic resonance imaging; ROI, region of interest.
Group-averaged contralateral S1FL:striatum ratios for BOLD, CBF, CBV, CMRO2 percent magnitude changes were 3.57, 6.05, 4.08, and 39.09, respectively. The CBF versus BOLD, CBV, and CMRO2 ratios were 31.35, 5.21, and 2.31, respectively, in the contralateral S1FL, and 18.49, 3.52, and 14.91 in the striatum, respectively.
Subregional Responses in the S1FL and Striatum
The ipsilateral striatum was subdivided into four subregions: dorsal medial, dorsal lateral, ventral medial, and ventral lateral (n=7, Figure 4). Repeated-measures ANOVA with Fisher's post hoc testing indicated that a significantly stronger negative BOLD response was observed in the ventral medial striatum compared with the dorsal medial and dorsal lateral striatum (both P<0.05). A similar pattern was observed in CBF responses (both P<0.05). In addition, the ventral lateral striatum also showed stronger negative CBF changes than did the dorsal medial and dorsal lateral striatum (both P<0.05). No significant differences were observed in CBV and CMRO2 responses among different striatal regions.
Figure 4.

Group-averaged percent-BOLD, CBF, CBV, and CMRO2 changes in dorsal medial, dorsal lateral, ventral medial, and ventral lateral areas of the ipsilateral striatum (ROIs see insets; n=7). *P<0.05, significant. Error bars represent s.e.m. values. BOLD, blood oxygen-level dependent; CBF, cerebral blood flow; CBV, cerebral blood volume; CMRO2, cerebral metabolic rate of oxygen; ROI, region of interest.
18F-Fluorodeoxyglucose Positron Emission Tomography of the Noxious Forepaw Stimulation
The stimulus-evoked CMRglc maps caused by noxious forepaw stimulation are shown in Figure 5 (total n=10). Stimulus-evoked CMRglc increase was statistically different in the contralateral S1FL (P<0.05), but not in the ipsilateral S1FL, the contralateral and ipsilateral striatum (P>0.05) compared with the control group. A significant difference was also found between the contralateral and ipsilateral S1FL in the stimulation group (P<0.01). Stimulus-evoked CMRglc was slightly higher in the contralateral than in the ipsilateral striatum but did not reach statistical significance (P>0.05). Averaged CMRglc increase (subtraction of stimulation and sham control) in the contralateral S1FL was 17.76 times higher than that in the striatum. This is the first PET study depicting contralateral S1 responses to forepaw electrical stimulation in rats to our knowledge.
Figure 5.

18F-FDG PET maps of noxious forepaw electrical stimulation in (A) coronal, (B) transverse, and (C) sagittal views from a representative animal. Clear contralateral activation was observed in the S1FL. (D) Relative glucose metabolic changes of noxious forepaw electrical stimulation (n=5 for each group). Percent CMRglc was computed by normalizing the PET signal intensities to that in the posterior parietal cortex (PtP). Significant increase in CMRglc was observed in the contralateral S1FL. The ipsilateral S1FL which served as a control of the image analysis, showed no response. No significant change was detected in the striatum. *P<0.05, **P<0.01. Error bars represent s.e.m. values. CMRglc, cerebral metabolic rate of glucose; 18F-FDG-PET, 18F-fluorodeoxyglucose positron emission tomography.
Discussion
Multiparametric fMRI at 11.7 T reveals sustained negative BOLD, CBF, and CBV changes in the bilateral striatum during noxious forepaw electrical stimulation. Stimulus-evoked CMRO2 decreases slightly in the striatum but was not statistically significant from baseline. Cerebral metabolic rate of glucose PET shows no statistically significant stimulus-evoked increase in glucose consumption in the striatum. By contrast, contralateral S1FL consistently shows increases in BOLD, CBF, CBV, CMRO2, and CMRglc during noxious forepaw electrical stimulation. These multimodal functional imaging findings corroborate the unexpected negative hemodynamic changes in the striatum during noxious forepaw stimulation, and support the hypothesis that the striatal hemodynamic response is dominated by neurotransmitter-mediated vasoconstriction, overriding the stimulus-evoked increases in CBF, CBV, and BOLD fMRI signals that commonly accompany increased neuronal activity. Multimodal functional imaging approach offers a means to probe the unique attributes of the striatum, providing novel insights into the neurovascular coupling in the striatum. Caution must be exercised when interpreting negative fMRI signal changes in the striatum. These findings could have strong implications in pain fMRI studies.
Potential Causes of the Negative Functional Magnetic Resonance Imaging Signal Changes
Sustained negative BOLD, CBF, and CBV fMRI responses to noxious stimulation were observed in the striatum, but the sources of these changes remain unclear. Plausible causes include: (1) decrease in neuronal activity associated with noxious stimulation (Shmuel et al, 2006), (2) marked and sustained increase in CMRO2 that is unmet by CBF increase (Schridde et al, 2008), and (3) blood ‘steal' effect in which blood is diverted to active sites from neighboring brain regions (Harel et al, 2002).
Electrophysiological recordings showed that noxious stimulation increased neuronal activity in the rat striatum (Chudler and Dong, 1995; Shih et al, 2009), 14C-2-deoxyglucose autoradiography of a chronic neuropathic pain showed increased glucose consumption from 50 to 86 μmol/100 g per min (Mao et al, 1993), and 18F-FDG PET of a formalin pain model in conscious rat also showed a 40% increase in 18F-FDG uptake (Shih et al, 2008b). In contrast, no apparent CMRO2 and CMRglc changes in the striatum were detected in this study. The discrepancy between previous and current studies could not be explained by measurement errors because CMRO2 and CMRglc increases in the contralateral S1FL were reliably detected. However, this discrepancy could be caused by differences in pain stimuli, or biophysical BOLD model (Davis et al, 1998). Despite the notion that spike activities, CMRglc, and CMRO2 measure different aspects of neuronal activities, none of the literature and current findings in animal models showed significant decreases in ‘neuronal activity' in the striatum associated with noxious stimulation. Thus, the negative hemodynamic response could not be explained as reduction in neuronal activities.
Second, an increase in CMRO2 in the absence of compensatory CBF increase could result in a negative BOLD change (Schridde et al, 2008). This is unlikely because stimulus-evoked CMRO2 in the striatum decreased slightly. The negative BOLD change could not be explained by CMRO2 measurement errors because S1FL CMRO2 changes were reliably detected. Third, although the blood steal effect has been reported in brain regions in close proximity to the activated sites (Harel et al, 2002), it could not explain the negative hemodynamic responses which encompasses very large regions in the bilateral striatum, distant from the unilateral S1FL with increased BOLD, CBF, and CBV responses.
Dopaminergic axons have been shown to directly innervate the intraparenchymal microvessels, in which perivascular application of dopamine can cause dose-dependent vasoconstriction (Krimer et al, 1998). Several pharmacological MRI studies have also shown that stimulation of dopamine D1/D5 and D2/D3 receptors could induce vasodilation and vasoconstriction, respectively (Choi et al, 2006, 2010). In addition, recent evidence showed that noxious stimulation induces neurotransmitter-mediated vasoconstriction in the striatum. Intravenous injection of a dopamine D2/D3 receptor antagonist (Shih et al, 2009) or lesion of dopamine neurons in the substantia nigra (Chen et al, 2009) significantly reduced the magnitude of stimulus-evoked striatal-negative CBV fMRI signals, indicating that the dopamine system—particularly the D2/D3 receptor and the nigrostriatal pathway—may have an important role.
In addition, intravenous injection of naloxone, a μ-opioid receptor antagonist that has been widely used to reduce endogenous pain inhibition, can also eliminate the stimulus-evoked striatal vasoconstriction (Shih et al, 2010). Taken together, these findings suggest a dominating role of neural-control, neurotransmitter-modulated vasoconstriction, which overrides the stimulus-evoked increases in CBF, CBV, and BOLD fMRI signals commonly accompanied by increased neuronal activity. The purpose of pain-related vasoconstriction in the striatum is unknown, but it is possible that active vasoconstriction is a means to reduce neural activity to decrease pain.
Irrespective of the cause of vasoconstriction, it is unclear how the metabolic needs in the striatum are met during noxious stimulation in the presence of such vasoconstriction. The stimulus-evoked CMRglc change in the striatum was markedly smaller than the contralateral S1FL. Normalization of the PET data to the posterior parietal cortex may potentially bias the current data interpretation. However, the same conclusion was reached if the cerebellum was used to normalize the image (data not shown). In addition, both the contralateral and ipsilateral S1FL served as important controls of the analysis. Our findings do not argue against the neuro-metabolic coupling in the striatum, but rather for a notion that noxious forepaw stimulation cannot strongly increase striatal CMRglc (with a contralateral S1FL:striatum ratio of 17.76:1). It is possible that only a small number of striatal nociceptive neurons were responsive to the 10-mA noxious forepaw stimulation, thus not evoking a significant CMRglc increase to be detectable by PET. Further studies are required.
The CBF:CMRO2 coupling ratio in the contralateral S1FL under noxious stimulation was 2.31, in reasonable agreement with the previous reports ranging from 2 to 4 under innocuous stimulation (Buxton, 2010; Liu et al, 2004; Sicard et al, 2005). Similarly, the CBF:CBV coupling ratio was 5.21, consistent with that reported in the literature of 5.8 (Shen et al, 2008). In contrast, the CBF:CMRO2 ratio of the striatum was about six times larger than that in the S1FL, further supporting the notion of an apparent neurovascular uncoupling in the striatum.
Cerebral Metabolic Rate of Oxygen Measurement
The biophysical model by Davis et al (1998) for CMRO2 estimation is eloquent because of its simplicity but it has some limitations. One such limitations is that BOLD and CBV fMRI signals do not come from the same sources. Stimulus-evoked BOLD fMRI signals are mostly associated with venous oxygenation changes (Kim et al, 2007), whereas CBV signals mainly originate from the arterial rather than from the venous side (Hillman et al, 2007). Moreover, this study used the total CBV changes to estimate CMRO2 changes which may underestimate the CMRO2 change because venous CBV change is much less than total CBV change during hypercapnia (Lee et al, 2001) and negligible during forepaw stimulation (Kim et al, 2007) in rats. As a consequence, CMRO2 changes may be underestimated in this study because of larger CBV (total CBV) changes being used in the calibrated BOLD method.
Moreover, the BOLD contribution to the MION fMRI signal could be significant, particularly at higher field and with low MION dose (Lu et al, 2007). To minimize the BOLD contribution, a higher MION dose (30 mg/kg) was used compared with the 10 to 15 mg/kg used at lower magnetic fields (Mandeville et al, 1998; Shen et al, 2008). A previous study at 11.7 T also used a similar MION dosage of 30 mg/kg (Keilholz et al, 2006). Correction of the BOLD contribution would require repeating the measurement of R2 during stimulation at different levels of blood susceptibility (Kennan et al, 1998). This was not performed.
Although CMRO2 determination using Davis's model needs further elucidation, we found a strong CMRO2 increase in the contralateral S1FL during noxious forepaw stimulation, in which a significantly weaker change was observed in the striatum. The magnitude changes in these two brain regions were not in a comparable range. We suspected that the bilateral striatal vascular responses may be evoked by a different neurovascular mechanism from that in the contralateral S1FL and that the local neuronal metabolism may not dominate the striatal-negative BOLD, CBF, and CBV responses during noxious stimulation.
Regional Functional Magnetic Resonance Imaging Response Differences
In the striatum, BOLD and CBF depicted stronger negative changes primarily in the ventral striatum compared with the dorsal part, whereas no differential activation was observed in CBV and CMRO2 among striatal subregions. Plausible explanations for stronger BOLD and CBF decreases in the ventral striatum could be the anatomic arrangement of the corticostriatal projections and the somatotopic organization of the striatum. The dorsal striatum is the major region that receives axonal projections from the cortex and peripheral stimulation (Brown, 1992; McGeorge and Faull, 1989). The higher neuronal activity and energy demand in the dorsal striatum may lead to regional CBF increases and thus counteract neurotransmission-related negative responses. Another possibility would be a more extensive overlap of dopamine D1/D5 and D2/D3 receptors in the dorsal striatum. As stimulation of the dopamine D1/D5 and D2/D3 receptors exerts opposing effect on cerebral perfusion (Choi et al, 2006), the influence of the D1/D5 receptors and the differential affinity for dopamine may contribute to the regional specificity in the striatum.
Striatal vasoconstriction is not limited to noxious forepaw stimulation. Similar striatal vasoconstriction was also observed with noxious hindpaw stimulation, indicating that the evoked responses were not unique to a particular body site but likely a common phenomenon of endogenous pain signaling. The weaker striatal responses during hindpaw stimulation compared with those during forepaw could be caused by the hindpaw is much less densely innervated compared with the forepaw in rats (Dawson and Killackey, 1987).
In conclusion, this study corroborates the negative fMRI responses in the striatum after noxious forepaw stimulation in rats. These findings support the notion that noxious stimulation evokes neural-mediated vasoconstriction in the striatum. Multimodal functional imaging approach offers a means to probe the unique attributes of the striatum, and provides novel insights into the neurovascular and metabolic-vascular coupling associated with pain stimulation in the striatum. These findings have strong implications in pain fMRI studies. The purpose of pain-related vasoconstriction in the striatum remains unclear and warrants further investigations.
Acknowledgments
The authors acknowledge Dr Fuqiang Zhao and Dr Ai-Ling Lin for valuable discussion and Mr David A Lewis and Dr Kihak Lee for their assistance with the PET scans. The authors acknowledge the resource supports of the Defense Advanced Research Projects Agency (Comprehensive Facility for Animal Imaging Research (CFAIR), HR0011-07-C-0027) and NIH/NCRR (S10 RR023038).
The authors declare no conflict of interest.
Footnotes
This work is supported by NIH R01-NS45879 to TQD, American Heart Association (10POST4290091), and San Antonio Area Foundation to YYIS.
References
- Brown LL. Somatotopic organization in rat striatum: evidence for a combinational map. Proc Natl Acad Sci USA. 1992;89:7403–7407. doi: 10.1073/pnas.89.16.7403. [DOI] [PMC free article] [PubMed] [Google Scholar]
- Buxton RB. Interpreting oxygenation-based neuroimaging signals: the importance and the challenge of understanding brain oxygen metabolism. Front Neuroenerg. 2010;2:1–16. doi: 10.3389/fnene.2010.00008. [DOI] [PMC free article] [PubMed] [Google Scholar]
- Chen CC, Shih YY, Mo KC, Yao NW, Lin ZJ, Huang CH, Shyu BC, Chang C. Mapping dopaminergic denervation in Parkinson disease in vivo and in situ: the visualization of structural details by CBV-weighted fMRI. J Cereb Blood Flow Metab. 2009;29:S607–S608. [Google Scholar]
- Choi JK, Chen YI, Hamel E, Jenkins BG. Brain hemodynamic changes mediated by dopamine receptors: role of the cerebral microvasculature in dopamine-mediated neurovascular coupling. NeuroImage. 2006;30:700–712. doi: 10.1016/j.neuroimage.2005.10.029. [DOI] [PubMed] [Google Scholar]
- Choi JK, Mandeville JB, Chen YI, Grundt P, Sarkar SK, Newman AH, Jenkins BG. Imaging brain regional and cortical laminar effects of selective D3 agonists and antagonists. Psychopharmacology. 2010;212:59–72. doi: 10.1007/s00213-010-1924-6. [DOI] [PMC free article] [PubMed] [Google Scholar]
- Chudler EH, Dong WK. The role of the basal ganglia in nociception and pain. Pain. 1995;60:3–38. doi: 10.1016/0304-3959(94)00172-B. [DOI] [PubMed] [Google Scholar]
- Davis TL, Kwong KK, Weisskoff RM, Rosen BR. Calibrated functional MRI: mapping the dynamics of oxidative metabolism. Proc Natl Acad Sci USA. 1998;95:1834–1839. doi: 10.1073/pnas.95.4.1834. [DOI] [PMC free article] [PubMed] [Google Scholar]
- Dawson DR, Killackey HP. The organization and mutability of the forepaw and hindpaw representations in the somatosensory cortex of the neonatal rat. J Comp Neurol. 1987;256:246–256. doi: 10.1002/cne.902560205. [DOI] [PubMed] [Google Scholar]
- Duong TQ, Silva AC, Lee SP, Kim SG. Functional MRI of calcium-dependent synaptic activity: cross correlation with CBF and BOLD measurements. Magn Reson Med. 2000;43:383–392. doi: 10.1002/(sici)1522-2594(200003)43:3<383::aid-mrm10>3.0.co;2-q. [DOI] [PubMed] [Google Scholar]
- Graybiel AM. Neurotransmitters and neuromodulators in the basal ganglia. Trends Neurosci. 1990;13:244–254. doi: 10.1016/0166-2236(90)90104-i. [DOI] [PubMed] [Google Scholar]
- Grubb RL, Jr, Raichle ME, Eichling JO, Ter-Pogossian MM. The effects of changes in PaCO2 on cerebral blood volume, blood flow, and vascular mean transit time. Stroke. 1974;5:630–639. doi: 10.1161/01.str.5.5.630. [DOI] [PubMed] [Google Scholar]
- Harel N, Lee SP, Nagaoka T, Kim DS, Kim SG. Origin of negative blood oxygenation level-dependent fMRI signals. J Cereb Blood Flow Metab. 2002;22:908–917. doi: 10.1097/00004647-200208000-00002. [DOI] [PubMed] [Google Scholar]
- Herscovitch P, Raichle ME. What is the correct value for the brain—blood partition coefficient for water. J Cereb Blood Flow Metab. 1985;5:65–69. doi: 10.1038/jcbfm.1985.9. [DOI] [PubMed] [Google Scholar]
- Hillman EM, Devor A, Bouchard MB, Dunn AK, Krauss GW, Skoch J, Bacskai BJ, Dale AM, Boas DA. Depth-resolved optical imaging and microscopy of vascular compartment dynamics during somatosensory stimulation. NeuroImage. 2007;35:89–104. doi: 10.1016/j.neuroimage.2006.11.032. [DOI] [PMC free article] [PubMed] [Google Scholar]
- Hoge RD, Atkinson J, Gill B, Crelier GR, Marrett S, Pike GB. Investigation of BOLD signal dependence on cerebral blood flow and oxygen consumption: the deoxyhemoglobin dilution model. Magn Reson Med. 1999;42:849–863. doi: 10.1002/(sici)1522-2594(199911)42:5<849::aid-mrm4>3.0.co;2-z. [DOI] [PubMed] [Google Scholar]
- Keilholz SD, Silva AC, Raman M, Merkle H, Koretsky AP. BOLD and CBV-weighted functional magnetic resonance imaging of the rat somatosensory system. Magn Reson Med. 2006;55:316–324. doi: 10.1002/mrm.20744. [DOI] [PubMed] [Google Scholar]
- Kennan RP, Scanley BE, Innis RB, Gore JC. Physiological basis for BOLD MR signal changes due to neuronal stimulation: separation of blood volume and magnetic susceptibility effects. Magn Reson Med. 1998;40:840–846. doi: 10.1002/mrm.1910400609. [DOI] [PubMed] [Google Scholar]
- Kim T, Hendrich KS, Masamoto K, Kim SG. Arterial versus total blood volume changes during neural activity-induced cerebral blood flow change: implication for BOLD fMRI. J Cereb Blood Flow Metab. 2007;27:1235–1247. doi: 10.1038/sj.jcbfm.9600429. [DOI] [PubMed] [Google Scholar]
- Krimer LS, Muly EC, III, Williams GV, Goldman-Rakic PS. Dopaminergic regulation of cerebral cortical microcirculation. Nat Neurosci. 1998;1:286–289. doi: 10.1038/1099. [DOI] [PubMed] [Google Scholar]
- Lee SP, Duong TQ, Yang G, Iadecola C, Kim SG. Relative changes of cerebral arterial and venous blood volumes during increased cerebral blood flow: implications for BOLD fMRI. Magn Reson Med. 2001;45:791–800. doi: 10.1002/mrm.1107. [DOI] [PubMed] [Google Scholar]
- Liu ZM, Schmidt KF, Sicard KM, Duong TQ. Imaging oxygen consumption in forepaw somatosensory stimulation in rats under isoflurane anesthesia. Magn Reson Med. 2004;52:277–285. doi: 10.1002/mrm.20148. [DOI] [PMC free article] [PubMed] [Google Scholar]
- Lu H, Scholl CA, Zuo Y, Stein EA, Yang Y. Quantifying the blood oxygenation level dependent effect in cerebral blood volume-weighted functional MRI at 9.4T. Magn Reson Med. 2007;58:616–621. doi: 10.1002/mrm.21354. [DOI] [PubMed] [Google Scholar]
- Mandeville JB, Marota JJ, Kosofsky BE, Keltner JR, Weissleder R, Rosen BR, Weisskoff RM. Dynamic functional imaging of relative cerebral blood volume during rat forepaw stimulation. Magn Reson Med. 1998;39:615–624. doi: 10.1002/mrm.1910390415. [DOI] [PubMed] [Google Scholar]
- Mao J, Mayer DJ, Price DD. Patterns of increased brain activity indicative of pain in a rat model of peripheral mononeuropathy. J Neurosci. 1993;13:2689–2702. doi: 10.1523/JNEUROSCI.13-06-02689.1993. [DOI] [PMC free article] [PubMed] [Google Scholar]
- McGeorge AJ, Faull RL. The organization of the projection from the cerebral cortex to the striatum in the rat. Neuroscience. 1989;29:503–537. doi: 10.1016/0306-4522(89)90128-0. [DOI] [PubMed] [Google Scholar]
- Morrow TJ, Paulson PE, Danneman PJ, Casey KL. Regional changes in forebrain activation during the early and late phase of formalin nociception: analysis using cerebral blood flow in the rat. Pain. 1998;75:355–365. doi: 10.1016/s0304-3959(98)00016-5. [DOI] [PMC free article] [PubMed] [Google Scholar]
- Pawela CP, Biswal BB, Hudetz AG, Li R, Jones SR, Cho YR, Matloub HS, Hyde JS. Interhemispheric neuroplasticity following limb deafferentation detected by resting-state functional connectivity magnetic resonance imaging (fcMRI) and functional magnetic resonance imaging (fMRI) NeuroImage. 2010;49:2467–2478. doi: 10.1016/j.neuroimage.2009.09.054. [DOI] [PMC free article] [PubMed] [Google Scholar]
- Schridde U, Khubchandani M, Motelow JE, Sanganahalli BG, Hyder F, Blumenfeld H. Negative BOLD with large increases in neuronal activity. Cereb Cortex. 2008;18:1814–1827. doi: 10.1093/cercor/bhm208. [DOI] [PMC free article] [PubMed] [Google Scholar]
- Shen Q, Ren H, Duong TQ. CBF, BOLD, CBV, and CMRO(2) fMRI signal temporal dynamics at 500-msec resolution. J Magn Reson Imaging. 2008;27:599–606. doi: 10.1002/jmri.21203. [DOI] [PMC free article] [PubMed] [Google Scholar]
- Shih YY, Chen YY, Chen JC, Chang C, Jaw FS. ISPMER: Integrated System for Combined PET, MRI, and Electrophysiological Recording in Somatosensory Studies in Rats. Nucl Instrum Meth A. 2007;580:938–943. [Google Scholar]
- Shih YY, Chen YY, Chen CC, Chen JC, Chang C, Jaw FS. Whole-brain functional magnetic resonance imaging mapping of acute nociceptive responses induced by formalin in rats using atlas registration-based event-related analysis. J Neurosci Res. 2008a;86:1801–1811. doi: 10.1002/jnr.21638. [DOI] [PubMed] [Google Scholar]
- Shih YY, Chiang YC, Chen JC, Huang CH, Chen YY, Liu RS, Chang C, Jaw FS. Brain nociceptive imaging in rats using (18)f-fluorodeoxyglucose small-animal positron emission tomography. Neuroscience. 2008b;155:1221–1226. doi: 10.1016/j.neuroscience.2008.07.013. [DOI] [PubMed] [Google Scholar]
- Shih YY, Chen CC, Shyu BC, Lin ZJ, Chiang YC, Jaw FS, Chen YY, Chang C. A new scenario for negative functional magnetic resonance imaging signals: endogenous neurotransmission. J Neurosci. 2009;29:3036–3044. doi: 10.1523/JNEUROSCI.3447-08.2009. [DOI] [PMC free article] [PubMed] [Google Scholar]
- Shih YY, Chiang YC, Hsu YH, Jaw FS, Chen JC, Shyu BC, Duong TQ, Chang C.2010Endogenous opioid-dopamine neurotransmission evokes sustained negative CBV-weighted fMRI responses Proc Intl Soc Mag Reson Med(#710)
- Shmuel A, Augath M, Oeltermann A, Logothetis NK. Negative functional MRI response correlates with decreases in neuronal activity in monkey visual area V1. Nat Neurosci. 2006;9:569–577. doi: 10.1038/nn1675. [DOI] [PubMed] [Google Scholar]
- Sicard KM, Shen Q, Brevard ME, Sullivan R, Ferris CF, King JA, Duong TQ. Regional cerebral blood flow and BOLD responses in conscious and anesthetized rats under basal and hypercapnic conditions: implications for functional MRI studies. J Cereb Blood Flow Metab. 2003;23:472–481. doi: 10.1097/01.WCB.0000054755.93668.20. [DOI] [PMC free article] [PubMed] [Google Scholar]
- Sicard M, Duong TQ. Effects of hypoxia, hyperoxia and hypercapnia on baseline and stimulus-evoked BOLD, CBF and CMRO2 in spontaneously breathing animals. Neuroimage. 2005;25:850–858. doi: 10.1016/j.neuroimage.2004.12.010. [DOI] [PMC free article] [PubMed] [Google Scholar]
- Silva AC, Zhang W, Williams DS, Koretsky AP. Estimation of water extraction fractions in rat brain using magnetic resonance measurement of perfusion with arterial spin labeling. Magn Reson Med. 1997;37:58–68. doi: 10.1002/mrm.1910370110. [DOI] [PubMed] [Google Scholar]
- Silva AC, Lee SP, Yang G, Iadecola C, Kim SG. Simultaneous blood oxygenation level-dependent and cerebral blood flow functional magnetic resonance imaging during forepaw stimulation in the rat. J Cereb Blood Flow Metab. 1999;19:871–879. doi: 10.1097/00004647-199908000-00006. [DOI] [PubMed] [Google Scholar]
- Van CN, Verhoye M, Van der LA. Stimulation of the rat somatosensory cortex at different frequencies and pulse widths. NMR Biomed. 2006;19:10–17. doi: 10.1002/nbm.986. [DOI] [PubMed] [Google Scholar]
- Wichmann T, DeLong MR. Functional and pathophysiological models of the basal ganglia. Curr Opin Neurobiol. 1996;6:751–758. doi: 10.1016/s0959-4388(96)80024-9. [DOI] [PubMed] [Google Scholar]
- Zhao F, Zhao T, Zhou L, Wu Q, Hu X. BOLD study of stimulation-induced neural activity and resting-state connectivity in medetomidine-sedated rat. NeuroImage. 2008;39:248–260. doi: 10.1016/j.neuroimage.2007.07.063. [DOI] [PMC free article] [PubMed] [Google Scholar]