

Abstract
Positron emission tomography (PET) is used in drug development to assist dose selection and to establish the relationship between blood and tissue pharmacokinetics (PKs). We present a new biomathematical approach that allows prediction of repeat-dose (RD) brain target occupancy (TO) using occupancy data obtained after administration of a single dose (SD). A PET study incorporating a sequential adaptive design was conducted in 10 healthy male adults who underwent 4 PET scans with [11C]DASB ([11C]N,N-dimethyl-2-(2-amino-4-cyanophenylthio) benzylamine): 1 at baseline, 2 after 20 mg SD of the 5-hydroxytryptamine transporter (5-HTT) inhibitor duloxetine, and 1 after 4 days daily administration of 20 mg duloxetine. An adaptive design was used to select optimal times after SD for measurement of occupancy. Both direct and indirect PK/TO models were fitted to the SD data to characterise the model parameters and then applied to a predicted RD duloxetine plasma time course to predict the 5-HTT occupancy after RD. Repeat-dose prediction from the indirect model (OC50=2.62±0.93 ng/mL) was significantly better (P<0.05) than that from the direct model (OC50=2.29±1.11 ng/mL). This approach increases the value of SD occupancy studies that are performed as part of first time in human drug development programmes by providing an estimate of the dose required to achieve the desired TO at RD.
Keywords: drug occupancy, duloxetine, 5-HTT, mathematical modelling, positron emission tomography (PET)
Introduction
Molecular imaging with positron emission tomography (PET) has become a key technology for drug development. Of particular importance is the ability of PET to measure target occupancy (TO) of candidate molecules in humans in vivo. These data provide drug development teams with a surrogate for pharmacodynamics, efficacy, and safety parameters, and also provide valuable information for the design of larger clinical trials (Lee and Farde, 2006). This pharmacokinetic (PK) and pharmacodynamic information can be used to optimise the dose regimen and formulation for subsequent clinical trials, thereby avoiding doses that are either too low (i.e., not effective) or too high (i.e., cause unnecessary safety problems). In this context, it may be desirable to achieve consistent occupancy of the target or to have variability in TO over time (e.g., high occupancy during the day, but reduction in occupancy at night). Availability of data relating the time-dependent profile of plasma drug concentration to one at the target, allows for the selection of a rational dosing regimen. The determination of the desired levels of TO can be derived either from clinical populations (e.g., therapeutic levels of D2 receptor occupancy by typical antipsychotics in schizophrenia) or from preclinical models (in which measures of occupancy are available from associated preclinical PET experiments).
Until recently, the application of PET for the assessment of in vivo drug TO has focussed around measurements at a single time point after either a single dose (SD) or a repeat dose (RD) of a candidate drug (Cunningham et al, 2004). However, as concentrations of the drug in both the plasma and the target tissue are not truly at equilibrium after a SD, single time-point measurements may fail to fully characterise the system, which leads to limitations in the ability to predict RD TO from SD data. To characterise a dynamic system, it is necessary to take multiple measurements at different time points to determine its full kinetic profile. The development of more sophisticated experimental designs, which measure both drug TO and plasma concentrations at multiple time points, yields a time-occupancy curve and a plasma concentration curve (CP) (Cunningham et al, 2004; Lim et al, 2007). Such experimental designs allow for full PK/TO modelling of the relationship between plasma concentration of the drug and its kinetic profile at the target. Furthermore, the application of this biomathematical model to RD plasma data (either measured directly or simulated from data obtained from standard SD PK studies) could allow for the prediction of RD occupancy profiles after RD of the drug. The ability to predict RD occupancy accurately, from SD imaging studies, would facilitate a reduction in drug development timelines. The design of such studies can be optimised further by the inclusion of an optimal adaptive design methodology, which aims to maximise the information obtained from the SD study by optimally selecting time points at which PET scans are performed (Zamuner et al, 2010).
This study aims to explore the use of ‘direct' and ‘indirect' PK/TO models to characterise the relationship between the plasma concentration of a drug and its TO, and to explore the abilities of these models to predict the actual occupancy that is achieved on repeat dosing. For many drugs acting on the central nervous system, a direct relationship is observed (Derendorf and Meibohm, 1999; Csajka and Verotta, 2006). However, some compounds acting at the central nervous system with longer target residence times do not show this direct relationship, and consequently a direct model would be unable to characterise the system and accurately predict occupancy after repeat dosing. Therefore, more sophisticated modelling approaches should be applied to account for the nonequilibrium nature of the system. Such models have been considered previously in the PK/pharmacodynamic modelling field and are referred to as indirect models (Ariens, 1964; Derendorf and Meibohm, 1999). These models do not assume that all drug concentrations in the different tissue compartments are in equilibrium.
The PET radioligand [11C]N,N-dimethyl-2-(2-amino-4-cyanophenylthio) benzylamine ([11C]DASB) and the marketed antidepressant duloxetine were selected for this study. [11C]DASB binds with high affinity (1.1 nmol/L) and selectivity to the 5-hydroxytryptamine transporter (5-HTT) (Wilson et al, 2002), can be quantified reliably, and does not require arterial cannulation to estimate occupancy (Frankle et al, 2006; Meyer, 2007). In addition, it has a favourable dosimetry profile allowing administration of 4 PET scans to each subject (7 μSv/MBq, an ∼9.2 mSv dose with 4 scans of 300 MBq) (Lu et al, 2004). Duloxetine is a dual serotonin-noradrenaline reuptake inhibitor, marketed for the treatment of mood disorders, with a good safety profile (Wernicke et al, 2005). Duloxetine exhibits linear PKs (which removes additional complications from the modelling process), whereas the short plasma t1/2 enables steady-state plasma concentrations to be achieved in ∼3 days; therefore, reducing the length of the study compared with other candidate antidepressants (Sharma et al, 2000). Duloxetine has no known active metabolites acting at the central nervous system 5-HTT in contrast to other selective serotonin reuptake inhibitors (Lantz et al, 2003), reducing confounding factors in the application of the PK/TO biomathematical model. The 5-HTT occupancy data for SD and RD administration of duloxetine in humans are available (Takano et al, 2006), simplifying the design of this study. Finally, and most importantly, in a previous study, duloxetine showed evidence of a dissociation between brain and plasma kinetics in healthy volunteers (Takano et al, 2006). As the primary aim of this study is the demonstration of the ability to predict RD occupancy for compounds with a complicated PK/TO relationship, it was important to examine a compound in which evidence of such kinetics was available.
The primary objective of this study is to test the hypothesis that PK/TO modelling of multiple time-point SD occupancy data is capable of accurately predicting the occupancy of a drug after repeated dosing.
Materials and methods
Experimental Design
An open label, nonrandomised study was conducted in healthy adult males. The study design is summarised in Figure 1. The times for post-SD scans were varied for individual subjects, using an adaptive design to maximise the information for estimation of PK/TO model parameters (Zamuner et al, 2010). The adaptive approach involves analysing the data at interim stages and choosing new sampling times to try to minimise the error on the PK/TO model parameters estimated from the indirect model (see below). In practice, this is achieved by first fitting the PK/TO model and obtaining model parameter estimates. Second, these parameter values are fixed, and temporal sampling points are optimised using the determinant of the covariance matrix, derived from the inverse of the Fisher information matrix, as the objective function to minimise. The algorithm was implemented using the PopED software (http://poped.sf.net) (Foracchia et al, 2004). For the first two subjects, the time of scan 2 (PET 2-SD) was initially chosen as 6 hours postdose, based on the expected brain tmax of duloxetine (Sharma et al, 2000) and the time of scan 3 (PET 3-SD) at ∼22 hours postdose. For subsequent subjects, the timing of PET 2-SD and PET 3-SD was selected (within the interval 0 to 72 hours after SD) after interim analysis and the application of a sequential optimal adaptive design (Zamuner et al, 2010). Scan 4 (PET 4-RD) was performed ∼6 hours postdose on day 4 of RD.
Figure 1.

Experimental design that includes dosing of duloxetine as a single and repeated dose, plasma PK sampling, and 5-HTT occupancy imaging with [11C]DASB. [11C]DASB, [11C]N,N-dimethyl-2-(2-amino-4-cyanophenylthio) benzylamine; 5-HTT, 5-hydroxytryptamine transporter; HPLC/MS/MS, high-performance liquid chromatography/mass spectrometry; PK, pharmacokinetic.
Subjects
A total of 15 healthy human volunteers gave written informed consent before their inclusion in the study. Two subjects were withdrawn because of the appearance of anxiety during PET 2-SD, one subject was unable to complete the study after PET 1 because of personal reasons. Finally, two subjects were excluded from the final analysis because their SD duloxetine plasma concentrations fell below the lower level of quantification of the PK assay. In all, 10 subjects completed the study, and were included in the final analysis. Health status was confirmed by detailed medical and psychiatric history, blood and urine tests, and a physical examination. A summarised version of the Structural Clinical Interview for DSM (Diagnostic and Statistical Manual of Mental Disorders) disorders (MKv3) was administered at the time of screening and reviewed by a consultant psychiatrist (EAR). Exclusion criteria included current or past serious medical or neurologic illness, current or lifetime history of DSM-IV Axis I or II diagnosis and/or suicidal tendencies, alcohol or illicit substance abuse and/or dependence, previous exposure to ionising radiation above background levels, which when combined with this study would result in exposure of >10 mSv in the previous 3 years, and family history of cancer (one or more first-degree relative(s) diagnosed before the age of 55 years). The study was approved by the Charing Cross Research Ethics Committee and the ARSAC (Administration of Radioactive Substances Advisory Committee) of the United Kingdom.
Radiochemistry
The radiotracer [11C]DASB was synthesised by the reaction of [11C]methyliodide with the desmethyl precursor using a modified version of a method described previously (Wilson et al, 2000).
[11C]carbon dioxide was produced using an Eclipse RDS cyclotron (Siemens, Knoxville, TN, USA) by the 14N(p,α)11C reaction and 18-MeV proton irradiation (typical bombardment of 55 μA, 50 minutes) of nitrogen gas containing 1% oxygen. [11C]carbon dioxide was transformed into [11C]methyliodide using a GE Microlab (GE GEMS, Uppsala, Sweden) as described previously (Larsen et al, 1997). A semi-automated Modular Lab Multifunctional Synthetic Module (Eckert & Ziegler, Germany) was configured to trap [11C]methyliodide in a 3-mL vial containing 1 mg of precursor desmethyl DASB in 350 μL dimethylformamide cooled down to −5°C. The resulting reaction mixture was heated for 5 minutes at 130°C to form [11C]DASB. The solution was cooled down to 80°C, diluted in 3-mL mobile phase (47.5% 32 mmol/L sodium dihydrogenophosphate buffer, pH 6.0 and 52.5% ethanol 96%) and injected into the semi-preparative HPLC (high-performance liquid chromatography) column. The product was purified using Eclipse C8 XDB, 5 μm, 250 × 9.4 mm2 (Agilent, West Lothian, UK), at a flow rate of 6 mL/min and using the mobile phase described above. The radioactivity fraction eluting between 4.9 and 5.5 minutes was collected, diluted with 20 mL of water for injection, and loaded into a Waters Sep-Pak Classic C18 cartridge (Waters, Milford, MA, USA). The Sep-Pak was rinsed with 10 mL of water and then eluted with 1 mL ethanol into an intermediate 20 mL mixing vial. The Sep-Pak was further eluted with 10 mL of 0.9% saline solution to result in [11C]DASB formulated in 11 mL of 10% (v/v) ethanol in 0.9% saline solution for injection. The resulting solution was passed through a 0.2-μm sterile filter (Millex GV, Sterile, 33 mm, 0.22 μm, Millipore, Billerica, MA, USA) into its final sterile container.
The final product was tested for chemical and radiochemical purity by means of an analytical HPLC system (Agilent) using a Luna Phenyl-Hexyl column (Phenomenex, Macclesfield, UK, 4.6 × 100 mm2, 3 μm) and a mixture of methanol (68%) and sodium phosphate buffer (32%, 25 mmol/L at pH 6.73) as solvent (1.5 mL/min at 35°C). Both N-methyl-2-(2-amino-4-cyanophenylthio)-benzylamine (MASB) (precursor, tR=2.5 minutes) and DASB (tR=4.7 minutes) concentrations were determined by means of an ultraviolet detector (225 nm). Confirmation of the identity of the product was determined by coinjection of an authentic sample of DASB, and radiochemical purity was determined using a sodium iodide detector (Berthold, Harpenden, UK). The total analysis time per injection was 6.5 minutes.
Image Acquisition
Subjects were positioned in the tomograph, after insertion of a venous cannula in an antecubital vein, and a head-fixation device was used to minimise head movements during data acquisition. All dynamic [11C]DASB PET scans were acquired on a Siemens HiRez 6 PET/computed tomography scanner (Siemens Healthcare, Erlangen, Germany), apart from PET 4-RD for subject 3, which for logistic reasons was acquired on a separate PET/computed tomography scanner with similar characteristics (Siemens TruePoint 6). A low-dose computed tomography scan was performed immediately before each PET study for subsequent attenuation and scatter correction. Dynamic emission data were collected continuously for 100 minutes (1 × 30 seconds, 6 × 15 seconds, 3 × 60 seconds, 5 × 120 seconds, 5 × 300 seconds, and 6 × 600 seconds), after an intravenous injection of up to 300 MBq of [11C]DASB. Image data were reconstructed using filtered backprojection (direct inversion fourier transform; DIFT) with a 128 matrix, a zoom of 2.6, a transaxial Gaussian filter of 5 mm, scatter correction, and attenuation correction. All volunteers had a structural T1 magnetic resonance (MR) scan performed on a 3-T MR scanner (Magneton Avanto Syngo MR B13 Siemens 3T; Siemens AG, Medical Solutions, Erlangen, Germany). All structural scans were inspected by an independent clinical neuroradiologist for unexpected findings of clinical significance.
Duloxetine Plasma Concentrations
Blood samples for PK analysis of duloxetine were collected immediately before and after all PET scans and immediately before all duloxetine administrations. In all, 5 mL of whole blood was collected into EDTA tubes. All blood samples were centrifuged within 30 minutes of collection at ∼4°C at 3,000 r.p.m. for 10 minutes. The harvested plasma was stored at or below −20°C before the analysis. Plasma samples were analysed for duloxetine using a validated analytical method based on protein precipitation, followed by HPLC/MS/MS (HPLC/mass spectrometry) analysis. The lower limit of quantification for duloxetine was 0.1 ng/mL as assessed using a 50 μL aliquot of plasma.
Data Analysis
All imaging data were analysed in accordance with the GSK CIC (GlaxoSmithKline Clinical Imaging Centre, London, UK) Molecular imaging analysis pipeline as follows: Dynamic PET data were corrected for motion and registered to the structural T1 MR image using a mutual information cost function. The CIC neuroanatomical atlas (Tziortzi et al, 2010) was nonlinearly deformed into the individual's space to generate a personalised anatomic parcellation of regions of interest and subsequently, by application to the dynamic emission data, regional time-activity curves. The midbrain, thalamus, and the striatum were defined as the target regions of interest. The reference region time-activity curve derived from the cerebellum was used as an input to the simplified reference tissue model (Lammertsma and Hume, 1996) to quantify the binding potential (BPND) in all relevant target regions (Frankle et al, 2006). The basis function implementation was used for estimation (Gunn et al, 1997), with parameter bounds of θ3min=0.006 per min and θ3max=0.6 per min for decay-corrected data. Estimates of the fractional occupancy in scans 2, 3, and 4 were derived with regard to the baseline BPND as,
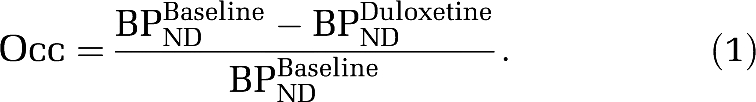 |
Pharmacokinetic/Target Occupancy Analysis
In this study, sparse PK sampling was used; therefore, it was not possible to fully characterise the PK model on the basis of these data. In the literature, duloxetine PKs have been described using a one-compartment open model with first-order absorption and elimination (Skinner et al, 2004; Lobo et al, 2009):
where Dose is the amount of drug (20 mg in our study), F the bioavailability, V/F (L) the apparent central volume, ka (per h) the absorption rate constant, CL/V (L/h) the elimination constant rate defined as the ratio between oral clearance CL/F (L/h) and the apparent central volume. Population and between-subjects variability parameter estimates obtained from the literature were used as priors for the PK analysis: CL/F=80.7 L/h, V/F=1,332 L, ka=0.168 per h (Lobo et al, 2009). An exponential distribution for intersubject variability was adopted using the following CVs: CL/F=59%, V/F=97%, and ka=32%. Individual PK parameters were obtained by fitting Equation (2) to the measured time-plasma concentrations using NONMEM software version VI (NONMEM Project Group, San Francisco, CA, USA) (Beal and Sheiner, 1998) adopting the first-order with conditional estimation method and the POSTHOC option. This model was used to provide a continuous representation of the individual plasma duloxetine levels after a SD and a prediction of the concentration time course during RD under the assumption of linear PKs;
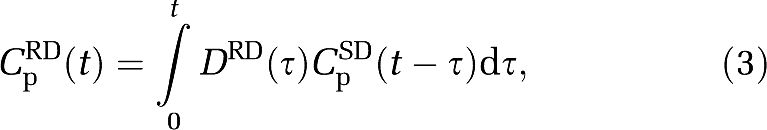 |
where CpRD(t) is the duloxetine concentration after 20 mg RD dosing, DRD(t) the temporal dosing profile for duloxetine with the occurrence of each 20 mg dose being represented by a dirac delta function, and CpSD(t) the duloxetine concentration after 20 mg SD dosing.
These data were then used in conjunction with both direct and indirect PK/TO models to predict the occupancy after RD.
Direct Pharmacokinetic/Target Occupancy Model
The classical Hill equation is often used to describe the relationship between drug plasma concentration and receptor occupancy, and is a direct model (Zhang et al, 2003). The model assumes that free drug concentration equilibrates rapidly between the plasma, free brain, and target-bound compartments. Mathematically, it is defined as
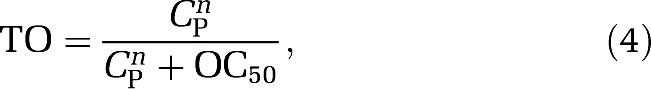 |
where CP is the plasma concentration of the drug and OC50 the drug plasma concentration that achieves 50% TO. There was no evidence that the Hill coefficient deviated from 1, and thus the parsimonious model (n=1) was used for all analyses.
Indirect Pharmacokinetic/Target Occupancy Model
The indirect PK/TO model considered in this study assumes a finite rate of exchange between tissue free drug concentration and receptor sites, but instantaneous equilibration between the plasma and the brain tissue, as well as between free and nonspecific pools in the plasma and tissue. Mathematically, it is defined as,
where kon and koff are the receptor association and dissociation rate constants, respectively, and OC50 (=koff/kon) which is equivalent to the drug plasma concentration that achieves 50% TO.
Both the direct and the indirect models were first fitted to the SD data to characterise the model parameters and subsequently applied to the predicted RD duloxetine plasma time course to predict the 5-HTT occupancy at RD (PET 4). The absolute prediction errors were calculated for both the direct and the indirect models by comparing the predicted and measured occupancies. A nonparametric Wilcoxon signed-rank test was applied to assess the superiority of one model over the other.
Results
A total of 10 evaluable subjects completed the study according to the protocol. The average age of the subjects was 40.2 years (±11.1, range 31 to 54), with an average weight of 79.5 kg (±7.6, range 74 to 90). The mean injected radioactivity was 212.4±60.3 MBq. The radiochemical purity of the injected [11C]DASB was high and exceeded 95% for all scans (mean of 98.9%±1.5%). The injected mass of cold DASB varied between 0.26 and 9.82 μg with a mean value of 3.29±1.24 μg. No serious adverse events were observed during the study.
Scan times for PET 2-SD and PET 3-SD were initially set at 6 and 26 hours for subjects 1 and 2. Scan times, for subjects 3 onwards, were selected on the basis of balancing results from the adaptive optimal design with practicalities (availability of clinical staff and resources). This led to times of 8 and 32 hours for subjects 3 and 4; 19 and 44 hours for subject 5; 21 and 72 hours for subject 6; 25 and 72 hours for subject 7; 3 and 8 hours for subject 8; and 3 and 28 hours for subjects 9 and 10. PET 4-RD was performed on average 6.4 hours after the fourth RD (range 5.7 to 7.0 hours).
Standardised uptake value images from the four PET scans for a representative subject are shown in Figure 2. The pattern of regional radioactivity was as expected for [11C]DASB scans, with the highest uptake in the midbrain, intermediate in the striatum and thalamus, and lowest in the cerebellum. All 4 [11C]DASB PET scans from each of the 10 subjects were successfully analysed after correction for motion, coregistration to the MRI, delineation of relevant anatomic regions, extraction of time-activity curves and kinetic modelling with the simplified reference tissue model to derive regional parameter estimates of receptor availability (BPND). The regional BPND values for the midbrain, striatum, and thalamus were consistent with previous literature estimates (Takano et al, 2006). In addition, occupancy estimates for these three regions were similar within each postdose scan, i.e., a range of s.d. between regions within subjects of 1% to 14% with an average of 5%. This validated the assumption that TO is homogeneous across regions and supported the averaging of these estimates for subsequent PK/TO modelling. [11C]DASB regional BPND values and the corresponding 5-HTT occupancy by duloxetine are given for all 10 subjects in Table 1.
Figure 2.

Representative SUV images (%ID/L) from one subject: (A) at baseline, (B) at 6 hours after 20 mg SD of duloxetine, (C) at 26 hours after 20 mg SD of duloxetine, and (D) after 20 mg RD of duloxetine for 4 days. RD, repeat dose; SD, single dose; SUV, standardised uptake value.
Table 1. [11C]DASB regional binding potential (BPND) estimates and occupancy of duloxetine at two time points after SD and once after RD.
| Subject |
BPND |
Occupancy |
||||||
|---|---|---|---|---|---|---|---|---|
| Region | Baseline | SD (t1) | SD (t2) | RD | SD (t1) | SD (t2) | RD | |
| 1 | Midbrain | 2.46 | 0.66 | 1.19 | 0.55 | 0.73 | 0.52 | 0.78 |
| Striatum | 1.30 | 0.40 | 0.66 | 0.41 | 0.69 | 0.49 | 0.69 | |
| Thalamus | 1.25 | 0.42 | 0.68 | 0.42 | 0.67 | 0.46 | 0.66 | |
| 0.70 | 0.49 | 0.71 | ||||||
| 2 | Midbrain | 2.54 | 0.62 | 1.30 | 0.47 | 0.76 | 0.49 | 0.82 |
| Striatum | 1.81 | 0.48 | 0.90 | 0.42 | 0.74 | 0.50 | 0.77 | |
| Thalamus | 1.87 | 0.54 | 0.97 | 0.47 | 0.71 | 0.48 | 0.75 | |
| 0.73 | 0.49 | 0.78 | ||||||
| 3 | Midbrain | 2.11 | 0.48 | 0.79 | 0.34 | 0.77 | 0.63 | 0.84 |
| Striatum | 1.44 | 0.55 | 0.70 | 0.45 | 0.62 | 0.52 | 0.69 | |
| Thalamus | 0.95 | 0.32 | 0.45 | 0.34 | 0.66 | 0.53 | 0.64 | |
| 0.68 | 0.56 | 0.72 | ||||||
| 4 | Midbrain | 2.23 | 0.37 | 0.54 | 0.28 | 0.83 | 0.76 | 0.87 |
| Striatum | 0.99 | 0.24 | 0.33 | 0.41 | 0.76 | 0.66 | 0.59 | |
| Thalamus | 0.91 | 0.20 | 0.23 | 0.29 | 0.78 | 0.75 | 0.68 | |
| 0.79 | 0.72 | 0.72 | ||||||
| 5 | Midbrain | 2.76 | 0.87 | 1.59 | 0.38 | 0.69 | 0.42 | 0.86 |
| Striatum | 1.51 | 0.54 | 0.86 | 0.39 | 0.64 | 0.43 | 0.74 | |
| Thalamus | 1.34 | 0.52 | 0.77 | 0.36 | 0.61 | 0.42 | 0.73 | |
| 0.65 | 0.43 | 0.78 | ||||||
| 6 | Midbrain | 3.10 | 1.11 | 1.98 | 0.37 | 0.64 | 0.36 | 0.88 |
| Striatum | 1.92 | 0.70 | 1.20 | 0.42 | 0.64 | 0.38 | 0.78 | |
| Thalamus | 1.83 | 0.62 | 1.21 | 0.45 | 0.66 | 0.34 | 0.75 | |
| 0.65 | 0.36 | 0.80 | ||||||
| 7 | Midbrain | 2.51 | 0.85 | 1.97 | 0.27 | 0.66 | 0.21 | 0.89 |
| Striatum | 1.50 | 0.59 | 1.15 | 0.27 | 0.61 | 0.23 | 0.82 | |
| Thalamus | 1.59 | 0.67 | 1.15 | 0.26 | 0.58 | 0.27 | 0.84 | |
| 0.62 | 0.24 | 0.85 | ||||||
| 8 | Midbrain | 1.87 | 0.47 | 0.38 | 0.26 | 0.75 | 0.80 | 0.86 |
| Striatum | 1.12 | 0.37 | 0.34 | 0.25 | 0.67 | 0.69 | 0.78 | |
| Thalamus | 1.10 | 0.38 | 0.28 | 0.29 | 0.66 | 0.75 | 0.74 | |
| 0.69 | 0.74 | 0.79 | ||||||
| 9 | Midbrain | 2.17 | 0.99 | 0.66 | 0.21 | 0.54 | 0.70 | 0.90 |
| Striatum | 1.23 | 0.64 | 0.50 | 0.24 | 0.48 | 0.59 | 0.80 | |
| Thalamus | 1.34 | 0.78 | 0.60 | 0.29 | 0.42 | 0.55 | 0.79 | |
| 0.48 | 0.61 | 0.83 | ||||||
| 10 | Midbrain | 3.98 | 0.65 | 0.99 | 0.69 | 0.84 | 0.75 | 0.83 |
| Striatum | 1.98 | 0.43 | 0.63 | 0.27 | 0.78 | 0.68 | 0.86 | |
| Thalamus | 2.12 | 0.60 | 0.83 | 0.37 | 0.72 | 0.61 | 0.82 | |
| 0.78 | 0.68 | 0.84 | ||||||
[11C]DASB, [11C]N,N-dimethyl-2-(2-amino-4-cyanophenylthio) benzylamine; RD, repeat dose; SD, single dose.
Summary occupancies are obtained as the mean across the midbrain, striatum, and thalamus.
Duloxetine plasma concentrations differed significantly between individuals and this was consistent with previous data (Sharma et al, 2000; Lobo et al, 2009). Mean duloxetine plasma concentrations immediately before PET 4 were 19.74±7.8 ng/mL (range 5.98 to 34.17 ng/mL). A one-compartment first-order absorption model was used for the PK model and fitted in a population framework (Figure 3A). Duloxetine plasma concentrations were generally well described by the model (root mean s.e.=65%±44%), which was subsequently used to provide predictions of individual duloxetine plasma concentrations after RD (Figure 3B). Model predictions of the duloxetine plasma concentrations at RD were in reasonable agreement with the actual measurements, but did lead to a small underestimation (percentage of measured value: 75.5%±35.5%, range 33.3% to 172.8%).
Figure 3.

Pharmacokinetic modelling of plasma duloxetine data. (A) Plasma PK model fit to measured SD duloxetine data and (B) model extrapolation to predict plasma concentration after RD. Measured duloxetine plasma data are shown as circles and model fits/predictions as solid lines (a separate colour is used for each of the 10 subjects). A one-compartment first-order absorption model was used for the PK model and fitted in a population framework. PK, pharmacokinetic; RD, repeat dose; SD, single dose.
Direct and indirect PK/TO model fits to the SD data are displayed in Figures 4A and 5A, respectively. The parameter estimation was stable for both models, with the individual parameter estimates tabulated in Table 2. The direct model estimated an OC50=2.29±1.11 ng/mL and the indirect model estimated an OC50=2.62±0.93 ng/mL. Predictions of the RD occupancy levels from the direct and indirect models are displayed in Figures 4B and 5B, respectively, along with the individual values in Table 2. The indirect model was a less biased and more precise predictor of RD occupancy than the direct model for most of the subjects and was significantly better when comparing both methods (Wilcoxon's signed two-tailed rank test applied to the error in both the direct and the indirect models, P=0.0488).
Figure 4.

Application of a direct model to describe the relationship between duloxetine plasma concentration and 5-HTT occupancy. (A) Direct model fit to SD data, (B) direct model prediction of 5-HTT occupancy after RD. Measured 5-HTT occupancies are shown as circles and model fits/predictions as solid lines (a separate colour is used for each of the 10 subjects). 5-HTT, 5-hydroxytryptamine transporter; RD, repeat dose; SD, single dose.
Figure 5.

Application of an indirect model to describe the relationship between duloxetine plasma concentration and 5-HTT occupancy. (A) Indirect model fit to SD data, (B) indirect model prediction of 5-HTT occupancy after RD. Measured 5-HTT occupancies are shown as circles and model fits/predictions as solid lines (a separate colour is used for each of the 10 subjects). 5-HTT, 5-hydroxytryptamine transporter; RD, repeat dose; SD, single dose.
Table 2. Direct and indirect PK/TO model fits to the SD data and model predictions for RD data.
|
SD model estimation |
RD occupancy |
|||||
|---|---|---|---|---|---|---|
| Subject | Direct |
Indirect |
Prediction |
Measured | ||
| OC50 | kon | OC50 | Direct | Indirect | ||
| 1 | 2.53 | 0.062 | 2.76 | 0.78 | 0.77 | 0.71 |
| 2 | 1.34 | 0.134 | 1.73 | 0.83 | 0.78 | 0.78 |
| 3 | 4.61 | 0.030 | 4.36 | 0.80 | 0.81 | 0.72 |
| 4 | 2.99 | 0.022 | 2.95 | 0.90 | 0.90 | 0.72 |
| 5 | 1.91 | 0.022 | 2.58 | 0.82 | 0.75 | 0.78 |
| 6 | 0.54 | 0.010 | 1.34 | 0.95 | 0.83 | 0.80 |
| 7 | 2.15 | 0.008 | 3.52 | 0.87 | 0.75 | 0.85 |
| 8 | 3.06 | 0.715 | 3.13 | 0.78 | 0.78 | 0.79 |
| 9 | 2.04 | 0.148 | 2.02 | 0.81 | 0.80 | 0.83 |
| 10 | 1.69 | 0.162 | 1.76 | 0.90 | 0.89 | 0.84 |
| Mean | 2.29 | 0.13 | 2.62 | 0.84 | 0.81 | 0.78 |
| s.d. | 1.11 | 0.21 | 0.93 | 0.06 | 0.05 | 0.05 |
PK, pharmacokinetic; RD, repeat dose; SD, single dose; TO, target occupancy.
Discussion
The goal of this study was to investigate the use of biomathematical modelling techniques to predict drug occupancy after RD. We investigated this using duloxetine, a serotonin-noradrenaline reuptake inhibitor, at the 5-HTT, from PET and PK measurements obtained after SD. Two principle issues were considered: first, the application of a sequential adaptive design to maximise the information derived from SD PET studies and second the use of both direct and indirect PK/TO models to predict occupancy after RD.
Sequential Adaptive Design
The current PET occupancy study is, to our knowledge, the first to use a sequential adaptive design to carefully select PET scan times after drug dosing and consequently maximise the information obtained from individual PET scans. The adaptive optimal approach is based on analysing data at key intervals within the study and subsequently choosing optimal scan times that maximise information on the basis of improved estimates of the drug's PK/TO model parameters. To achieve the improved efficiency in experimental design, promised by this model, rapid analysis of PET scans, assay of PK samples, and optimal design re-estimations are required. Thus, in this study, we were able to adapt three times while modifying some scan times from the theoretical optimum to fit in with scheduling. This optimal design strategy provides a strong framework for adaptive experimental design that allows one to maximise the information that can be obtained from subjects. This has implications for reducing the number of required subjects in studies and minimising the exposure of subjects to radiation.
Prediction of Repeat-Dose Occupancy
To predict RD occupancy using PK/TO modelling approaches, it is necessary to have an estimate of the PK concentration time course of the drug after RD. In this study, discrete SD duloxetine plasma concentrations were successfully fitted to a one-compartment first-order oral absorption model in a population framework. This model then allowed for the prediction of a continuous plasma concentration time course after the repeated dosing of four 20-mg daily doses of duloxetine.
Direct and indirect PK/TO models were fit to the SD data to derive estimates of OC50 (and additionally kon for the indirect model). Subsequent application of these models to the estimated duloxetine PK RD time course then gave a prediction of the occupancy at RD. Both direct and indirect models yielded good predictions of target RD occupancy; however, those from the indirect model were significantly better. The models were applied as they would be in the drug development environment, in which the goal would be to simulate RD PK and apply predictions based on SD data only. Therefore, it is important to understand that inaccuracies in the model predictions of RD occupancy will stem from two different sources; (1) errors in the predictions of the continuous RD duloxetine plasma concentrations and (2) errors in the PK/TO models. In the present example, differences between the predictions from the direct and indirect models were not large. However, for drugs with increased target residence times, the direct model would lead to substantial errors in the predicted RD occupancy.
Implications for Drug Development
Imaging is increasingly having a more valuable role in drug development with PET occupancy studies providing particularly valuable information. Such studies allow drug development teams to mitigate risk from larger clinical trials by ascertaining the dose of a novel drug that will achieve the required TO. These measurements can be achieved early in development with a small number of subjects (∼8 to 16). To date, PET occupancy studies have been initially performed after SD first time in human studies and then repeated later in development when RD is performed. Single-dose occupancy studies have almost entirely been analysed using a direct model (except by Lim et al, 2007) under the assumption of short drug-target residence time. The methodology presented in this study introduces biomathematical techniques that aim to predict the RD results during the SD first time in human study even for drugs with long target residence times. Providing this information earlier in development will allow for the choice of optimal doses in RD studies and the compression of drug development timelines.
Acknowledgments
The authors gratefully acknowledge the excellent work of all the dedicated staff at the CIC, in particular that of Yvonne Lewis with the development and execution of the clinical aspects of the study, William Hallett, and Nick Keat for Physics support, Michelle Cuneen, James Anscombe, and Ros Gordon for their role as radiographers, and the GSK Department of Drug Metabolism and Pharmacokinetics for the analysis of the plasma concentrations of duloxetine. The authors also thank the research volunteers for their kind participation.
The authors declare no conflict of interest.
References
- Ariens EJ. Molecular Pharmacology: The Mode of Action of Biologically Active Compounds. New York, NY: Academic Press; 1964. [Google Scholar]
- Beal SL, Sheiner LB. San Francisco, CA; 1998. NONMEM users guide. NONMEM Project Group, University of California, San Francisco. [Google Scholar]
- Csajka C, Verotta D. Pharmacokinetic-pharmacodynamic modelling: history and perspectives. J Pharmacokinet Pharmacodynam. 2006;33:227–279. doi: 10.1007/s10928-005-9002-0. [DOI] [PubMed] [Google Scholar]
- Cunningham VJ, Gunn RN, Matthews JC. Quantification in positron emission tomography for research in pharmacology and drug development. Nucl Med Commun. 2004;25:643–646. doi: 10.1097/01.mnm.0000134330.38536.bc. [DOI] [PubMed] [Google Scholar]
- Derendorf H, Meibohm B. Modeling of pharmacokinetic/pharmacodynamic (PK/PD) relationships: concepts and perspectives. Pharm Res. 1999;16:176–185. doi: 10.1023/a:1011907920641. [DOI] [PubMed] [Google Scholar]
- Foracchia M, Hooker A, Vicini P, Ruggeri A. POPED, a software for optimal experiment design in population kinetics. Comput Methods Programs Biomed. 2004;74:29–46. doi: 10.1016/S0169-2607(03)00073-7. [DOI] [PubMed] [Google Scholar]
- Frankle WG, Slifstein M, Gunn RN, Huang Y, Hwang DR, Darr EA, Narendran R, Abi-Dargham A, Laruelle M. Estimation of serotonin transporter parameters with 11C-DASB in healthy humans: reproducibility and comparison of methods. J Nucl Med. 2006;47:815–826. [PubMed] [Google Scholar]
- Gunn RN, Lammertsma AA, Hume SP, Cunningham VJ. Parametric imaging of ligand-receptor binding in PET using a simplified reference region model. Neuroimage. 1997;6:279–287. doi: 10.1006/nimg.1997.0303. [DOI] [PubMed] [Google Scholar]
- Lammertsma AA, Hume SP. Simplified reference tissue model for PET receptor studies. Neuroimage. 1996;4:153–158. doi: 10.1006/nimg.1996.0066. [DOI] [PubMed] [Google Scholar]
- Lantz RJ, Gillespie TA, Rash TJ, Kuo F, Skinner M, Kuan HY, Knadler MP. Metabolism, excretion, and pharmacokinetics of duloxetine in healthy human subjects. Drug Metab Dispos. 2003;31:1142–1150. doi: 10.1124/dmd.31.9.1142. [DOI] [PubMed] [Google Scholar]
- Larsen P, Ulin J, Dahlström K, Jensen M. Synthesis of [11C]Iodomethane by iodination of [11C]methane. Appl Radiat Isot. 1997;48:153–157. [Google Scholar]
- Lee CM, Farde L. Using positron emission tomography to facilitate CNS drug development. Trends Pharmacol Sci. 2006;27:310–316. doi: 10.1016/j.tips.2006.04.004. [DOI] [PubMed] [Google Scholar]
- Lim KS, Kwon JS, Jang IJ, Jeong JM, Lee JS, Kim HW, Kang WJ, Kim JR, Cho JY, Kim E, Yoo SY, Shin SG, Yu KS. Modeling of brain D2 receptor occupancy-plasma concentration relationships with a novel antipsychotic, YKP1358, using serial PET scans in healthy volunteers. Clin Pharmacol Ther. 2007;81:252–258. doi: 10.1038/sj.clpt.6100049. [DOI] [PubMed] [Google Scholar]
- Lobo ED, Quinlan T, O'Brien L, Knadler MP, Heathman M. Population pharmacokinetics of orally administered duloxetine in patients: implications for dosing recommendation. Clin Pharmacokinet. 2009;48:189–197. doi: 10.2165/00003088-200948030-00005. [DOI] [PubMed] [Google Scholar]
- Lu JQ, Ichise M, Liow JS, Ghose S, Vines D, Innis RB. Biodistribution and radiation dosimetry of the serotonin transporter ligand 11C-DASB determined from human whole-body PET. J Nucl Med. 2004;45:1555–1559. [PubMed] [Google Scholar]
- Meyer JH. Imaging the serotonin transporter during major depressive disorder and antidepressant treatment. J Psychiatry Neurosci. 2007;32:86–102. [PMC free article] [PubMed] [Google Scholar]
- Sharma A, Goldberg MJ, Cerimele BJ. Pharmacokinetics and safety of duloxetine, a dual-serotonin and norepinephrine reuptake inhibitor. J Clin Pharmacol. 2000;40:161–167. doi: 10.1177/00912700022008810. [DOI] [PubMed] [Google Scholar]
- Skinner MH, Kuan HY, Skerjanec A, Seger ME, Heathman M, O'Brien L, Reddy S, Knadler MP. Effect of age on the pharmacokinetics of duloxetine in women. Br J Clin Pharmacol. 2004;57:54–61. doi: 10.1046/j.1365-2125.2003.01963.x. [DOI] [PMC free article] [PubMed] [Google Scholar]
- Takano A, Suzuki K, Kosaka J, Ota M, Nozaki S, Ikoma Y, Tanada S, Suhara T. A dose-finding study of duloxetine based on serotonin transporter occupancy. Psychopharm (Berl) 2006;185:395–399. doi: 10.1007/s00213-005-0304-0. [DOI] [PubMed] [Google Scholar]
- Tziortzi AC, Searle GE, Tzimopoulou S, Salinas C, Beaver JD, Jenkinson M, Laruelle M, Rabiner EA, Gunn RN.2010Imaging dopamine receptors in humans with [11C]-(+)-PHNO: dissection of D3 signal and anatomy NeuroImagedoi: 10.1016/j.neuroimage.2010.06.044in press) [DOI] [PubMed]
- Wernicke JF, Gahimer J, Yalcin I, Wulster-Radcliffe M, Viktrup L. Safety and adverse event profile of duloxetine. Expert Opin Drug Saf. 2005;4:987–993. doi: 10.1517/14740338.4.6.987. [DOI] [PubMed] [Google Scholar]
- Wilson AA, Ginovart N, Hussey D, Meyer J, Houle S. In vitro and in vivo characterisation of [11C]-DASB: a probe for in vivo measurements of the serotonin transporter by positron emission tomography. Nucl Med Biol. 2002;29:509–515. doi: 10.1016/s0969-8051(02)00316-5. [DOI] [PubMed] [Google Scholar]
- Wilson AA, Ginovart N, Schmidt M, Meyer JH, Threlkeld PG, Houle S. Novel radiotracers for imaging the serotonin transporter by positron emission tomography: synthesis, radiosynthesis, and in vitro and ex vivo evaluation of (11)C-labeled 2-(phenylthio)araalkylamines. J Med Chem. 2000;43:3103–10. doi: 10.1021/jm000079i. [DOI] [PubMed] [Google Scholar]
- Zamuner S, Di Iorio VL, Nyberg J, Gunn RN, Cunningham VJ, Gomeni R, Hooker AC. Adaptive optimal design in PET occupancy studies. Clin Pharmacol Ther. 2010;87:563–571. doi: 10.1038/clpt.2010.9. [DOI] [PubMed] [Google Scholar]
- Zhang L, Beal SL, Sheiner LB. Simultaneous versus sequential analysis for population PK/PD data I: best-case performance. J Pharmacokinet Pharmacodyn. 2003;30:387–404. doi: 10.1023/b:jopa.0000012998.04442.1f. [DOI] [PubMed] [Google Scholar]