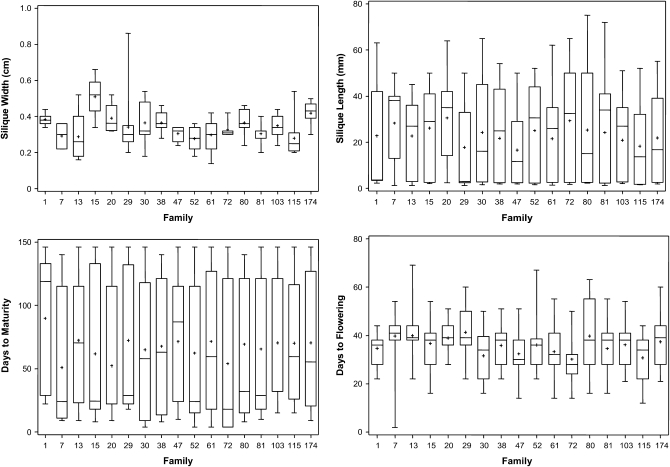
Figure 3.—
Boxplots showing the variation for different morphological traits in 17 BC3S1 introgressed families (IFs). Maximum, minimum, and median values are marked. Each box represents the interquartile range, which contains 50% of the values. The whiskers are lines that extend from the box to the highest and lowest values, excluding outliers. The solid line across the box indicates the median. The mean value is indicated by a “+” sign.

