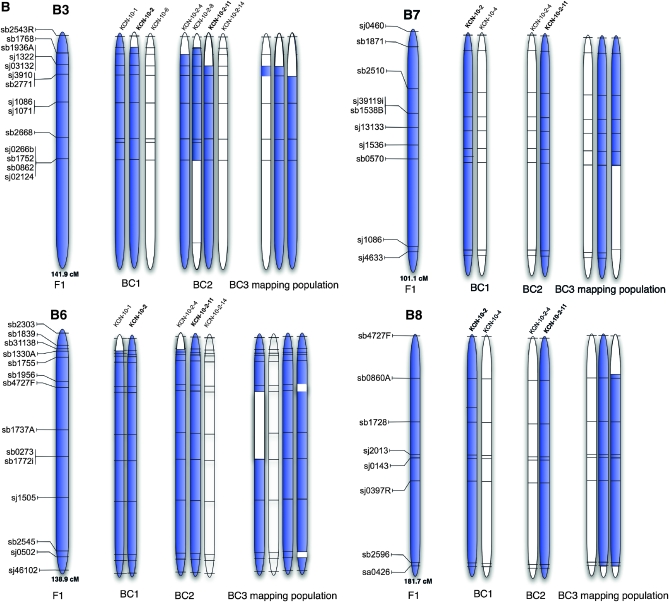
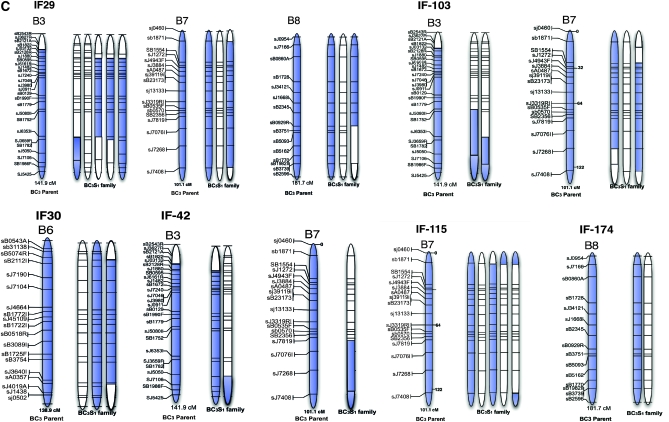
Figure 4.—
Physical representation of a selection of linkage groups in the genetic material used in this study. (A) Segregation pattern of N11 and N13 chromosomes of the C genome from F1 to BC3 generation; (B) segregation pattern of B3, B6, B7, and B8 chromosomes of the B genome from F1 to BC3 generation; (C) segregation pattern of B-genome chromosomes observed in the 11 individuals of BC3S1 families. The location of the markers selected on the linkage groups is based on the AAFC reference maps. Blue parts represent the presence of the segment and white segments represent its absence. The parent of the BC3 mapping population is indicated in boldface type.


