Abstract
Changing kinetics of large-conductance potassium (BK) channels in hair cells of nonmammalian vertebrates, including the chick, plays a critical role in electrical tuning, a mechanism used by these cells to discriminate between different frequencies of sound. BK currents are less abundant in low-frequency hair cells and show large openings in response to a rise in intracellular Ca2+ at a hair cell's operating voltage range (spanning −40 to −60 mV). Although the molecular underpinnings of its function in hair cells are poorly understood, it is established that BK channels consist of a pore-forming α-subunit (Slo) and a number of accessory subunits. Currents from the α (Slo)-subunit alone do not show dramatic increases in response to changes in Ca2+ concentrations at −50 mV. We have cloned the chick β4- and β1-subunits and show that these subunits are preferentially expressed in low-frequency hair cells, where they decrease Slo surface expression. The β4-subunit in particular is responsible for the BK channel's increased responsiveness to Ca2+ at a hair cell's operating voltage. In contrast, however, the increases in relaxation times induced by both β-subunits suggest additional mechanisms responsible for BK channel function in hair cells.
Keywords: large-conductance potassium channels, relaxation times, beta subunits, electrical tuning
large-conductance potassium (BK) channels are ubiquitously distributed, and this is reflected in their role in numerous disease states including deafness, hypertension, epilepsy, and movement disorders (1, 10, 11, 13, 38, 47). These channels are unusual in that they have a large potassium conductance and are regulated by both membrane voltage and intracellular Ca2+ (29, 30). In hair cells of the auditory system of nonmammalian vertebrates, these channels play a critical role in electrical tuning, a mechanism that enables hair cells to discriminate between different frequencies of sound (14, 21).
Hair cells from the turtle auditory epithelium have an intrinsic oscillation in membrane potential in response to a small injected depolarizing current that sharply correlates with the frequency of sound to which they best respond (characteristic frequency) (9, 16). This electrical tuning, although first described in the turtle auditory epithelium, has been confirmed in other species, including the chick auditory and frog vestibular epithelium (9, 16, 22, 28, 41). Hair cells in the auditory epithelium are arranged tonotopically and show a gradual change in oscillation frequency that corresponds to the cell's tonotopic location (9, 16). The oscillation in membrane potential is brought about by an inward Ca2+ current and an outward Ca2+-activated K+ current (BK) (3, 22, 28). It should be noted that the principal method of activating BK channels in these cells is by increases in intracellular Ca2+. Native BK channels show minimal sensitivity to voltage changes operational in hair cells (estimated to vary between −50 mV and −30 mV in the turtle) at an estimated resting Ca2+ concentration of 4 μM (4). Owing to the high concentration of Ca2+ buffer present in these cells that limits diffusion of Ca2+, both Ca2+ channels and BK channels were predicted to lie in close physical apposition, and this has been borne out empirically (23, 45, 48, 50–52). A detailed analysis of these channels' kinetics has shown that the primary determinant of changing oscillation frequency is the changing kinetic parameters of the BK channel (2–4). Specifically, data from the turtle have shown that a hair cell's characteristic frequency relates closely to the relaxation times of BK channels from that hair cell. These data have since been broadly replicated in the chick auditory epithelium (12).
The molecular underpinnings of the changing kinetics of BK channels along the tonotopic spectrum have yet to be established with certainty. BK channels contain a pore-forming α-subunit encoded by a single gene (Slo; KCNMA1) that shows extensive alternative splicing (5, 7). The α-subunit alone can form a channel (5, 7). Early work showed evidence of multiple splice variants at individual splice sites that changed systematically along the tonotopic axis, raising the possibility that these splice variants could cause changes in the kinetic properties of the channel (25, 36, 46). However, subsequent work in the chick has shown that these splice variants possess a limited range of relaxation time constants, the parameter that correlated best with characteristic frequency along the tonotopic axis (12, 43, 44). Moreover, these α-subunits also have other features in their kinetics that are at variance with BK channels native to hair cells. Discordance in Ca2+ sensitivity is one such example (43, 44). In the chick, different splice variants expressed in HEK cells have Kd (concentration required for half-activation) values at 0 mV that vary from 5 to 40 μM, in contrast to native cells that have a range of values from 1 to 20 μM (43, 44). Similarly, in the turtle the Kd at −50 mV for channels expressed in oocytes varied from 6 μM to >200 μM, in contrast to native hair cells that had a mean value of 12 μM (4, 24, 25, 27). More importantly, turtle native channels showed maximal opening in response to an increase in Ca2+ concentration approaching 35–50 μM at −50 mV (4). Similarly, chick native channels held at −50 mV were shown to increase open probability (Po) from 0.1 to 0.8 in response to an increase in Ca2+ concentration from 1 μM to 20 μM (12). These data contrast with different α-subunits expressed in heterologous systems that when held at −50 mV show smaller increases in Po in response to increases in physiological concentrations of Ca2+ (5–50 μM) (24, 25, 27, 43, 44).
In this study, we identify and characterize the β4-subunit of Slo in the chick and compare its effects on Slo kinetics with the those of the β1-subunit. While the β4-subunit has effects on deactivation times similar to those of the β1-subunit, we show that β4 is preferentially expressed at the apical end of the basilar papilla and alters the α-subunit's Ca2+ responsiveness at the hair cell's operating voltage closer to that observed in native hair cells. We also establish, using small interfering RNA (siRNA) knockdown, that the β1- and β4-subunits decrease surface expression of Slo in hair cells. Overall, our data suggest β4-subunit interactions with Slo as one of many mechanisms that help bring about the complex behaviors of this channel in hair cells.
MATERIALS AND METHODS
DNA and RNA synthesis (constructs information).
For RNA injection, chicken Slo (cSlo) (36), β1, and β4 cDNAs were inserted into pGH 19 vector. Plasmids were linearized with NotI and cRNA transcribed with the mMESSAGE mMACHINE kit (Ambion, Austin, TX).
For fluorescence-activated cell sorting (FACS) analysis, cSlo cDNA tagged with FLAG and yellow fluorescent protein (YFP) was subcloned into pcDNA 6 vector; β1 and β4 cDNAs were subcloned in-frame into the pECFP N1 vector.
Oocyte preparation and RNA injection.
Oocyte preparation was as previously described (32). All experimental procedures involving animals were reviewed and approved by the Institutional Animal Care and Use Committee (IACUC), Yale University School of Medicine. In brief, oocyte sacks were harvested from anesthetized Xenopus laevis and then incubated in 2 mg/ml collagenase type Ia (Sigma, St. Louis, MO) in nominally Ca2+-free ND96 (in mM: 96 NaCl, 2 KCl, 1 MgCl2, 5 HEPES, pH 7.4) for 20 min with continuous agitation. After several washes in nominally Ca2+-free ND96, oocytes were incubated again in 2 mg/ml collagenase type Ia in nominally Ca2+-free ND96 for 15 min. The oocytes were washed again in nominally Ca2+-free ND96 with agitation until they were well separated from each other. They were then repeatedly washed in ND96 with 1.8 mM CaCl2 to remove collagenase and complete defolliculation. Stage V and VI oocytes were then sorted and stored at 18°C in OR-3 medium [50% Leibovitz L-15 medium (GIBCO BRL, Grand Island, NY), 5 mM HEPES, 10 ml of 10,000 U/ml of penicillin, and 10,000 μg/ml of streptomycin (Sigma), pH 7.4, 200 mosmol/kgH2O].
RNA at a volume of ∼46 nl was injected into each oocyte on the following day. Concentrations of RNA varied depending upon the design of the experiment. For macroscopic current recording, cSlo RNA at a final concentration of 0.3 mg/ml was injected with or without β1/β4 RNA. For single-channel recording, to ensure one channel per patch, we injected cSlo RNA at a final concentration of 0.05 mg/ml with or without β-subunits. We generally injected cSlo and β-subunits at 1-to-3 ratios by weight. Recordings were performed 2–6 days after injection.
Macroscopic current recording.
Macroscopic currents were recorded in inside-out patches from injected oocytes by a whole cell voltage-clamp technique (17) at room temperature with an Axon 200B amplifier (Axon Instruments, Sunnyvale, CA). Command delivery and data collections were carried out with a Windows-based whole cell voltage-clamp program, jClamp (Scisoft, Ridgefield, CT), using a Digidata 1322A interface (Axon Instruments). Currents were digitized at 100 kHz and filtered at 5–10 kHz. Data analysis was accomplished with jClamp or Clampfit (Molecular Devices, Union City, CA). Capacitance and leak currents were subtracted with a P/-5 leak subtraction protocol. Conductance-voltage (G-V) curves were obtained by measuring the amplitude of tail currents 100–200 μs after repolarization to −100 mV from the various test voltages. Each G-V curve was fitted with a Boltzmann function:
| (1) |
where Gmax is the fitted value for maximal conductance, Vh is the voltage of half-maximal activation of conductance, z reflects the net charge moved across the membrane during the transition from the closed to the open state, and F, R, and T are the Faraday constant, the gas constant, and temperature, respectively.
To characterize relaxation kinetics, tail currents were collected at various relaxation voltages after a 100-ms (for cSlo only or cSlo with β1) or 200-ms (for cSlo with β4) depolarization to 180 mV, to maximize the channel opening at specific Ca2+ concentrations. The time constants were obtained by fitting the tail currents to a single exponential function.
Pipettes were pulled from thin-walled borosilicate glass (TW 150, World Precision Instruments, Sarasota, FL) with impedance of ∼1 MΩ. The standard pipette/extracellular solution contained (in mM) 140 K-methanesulfonate, 20 KOH, 10 HEPES, and 2 MgCl2, pH 7.2. The composition of the bath/intracellular solution was (in mM) 140 K-methanesulfonate, 20 KOH, 5 mM HEDTA, and 10 HEPES, pH 7.2, and Ca-methanesulfonate2 was added to reach the appropriate free Ca2+ concentration. No Ca2+ chelator was used in the solution containing 100 μM free Ca2+. The amount of total Ca-methanesulfonate2 needed to obtain the desired free Ca2+ concentration was calculated with Max Chelator (6), which was downloaded from http://www.stanford.edu/∼cpatton/webmaxc.htm. Final free Ca2+ concentration was measured with a Ca2+ electrode (Thermo Electron, Beverly, MA). The bath/intracellular solutions were delivered with the ALA QMM micromanifold perfusion system (ALA Scientific Instrument, Westbury, NY).
Single-channel recording.
Single-channel recordings were carried out with excised inside-out patches from injected oocytes at room temperature (17). Command delivery, data collection, and analysis were as described for macrocurrent recordings, except that we used AxoScope (Axon Instruments) for data collection. Patch pipettes with impedance of ∼15–25 MΩ were pulled from thick-walled borosilicate glass (TW 150, World Precision Instruments) and coated with Sylgard. The components of pipette/extracellular and bath/intracellular solutions were identical to those used in macrocurrent recordings. The recordings were low-pass filtered with an eight-pole Bessel filter at between ∼2 and 5 kHz and digitized at 20 kHz. Open- and closed-state transitions were defined with half-amplitude threshold analysis (8). Channel amplitudes were determined by fitting an amplitude histogram of data points. Duration histograms were constructed and fitted by the maximum likelihood method (33, 49).
To identify bursts of single-channel opening, critical gaps were defined in the interevent (closed) interval distribution (31). In brief, after detection of single-channel activities, the distributions of interevent interval durations were first fitted with appropriate exponential functions, generally, the sum of two exponential components. A critical gap length was then calculated from the distribution to give equal numbers of misclassified closed events. This analysis was performed on the recordings with Po generally <0.5, since it was hard to define gaps between bursts with higher Po.
Quantitative PCR.
Chick basilar papillae were microdissected and divided into four quadrants [low-frequency quadrant, middle-frequency (MF1 and MF2) quadrants, and high-frequency quadrant]. RNA was isolated from each segment with the RNAqueous kit (Ambion) according to the manufacturer's instructions. cDNA was synthesized with oligo(dT) primers and random hexamers as previously described (36). Quantitative (q)PCR amplification with cDNA from each quadrant of the papillae were performed with the IQ SYBR Green supermix (Bio-Rad, Hercules, CA). The reaction mixtures were set up in 96-well thin-wall plates (Bio-Rad) and amplified with a C1000 thermal cycler containing a CFX96 optical reaction module (Bio-Rad). Amplification data were analyzed with CFX Manager software (Bio-Rad) and normalized to 18S RNA.
The primer sequences were as follows: 18S forward (F): AGAAACGGCTCCACATCCAAG, 18S reverse (R): TCAAAGTCCCTCCAATGGTCC; cSlo F: TGGACTGTCTGCTGCCACTG, cSlo R: CCCATCTGCCCTGGTATCTC; β1 F: CCCCGGCAACTCCGAGAACG, β1 R: ACATGAGCGTGGGCCAAAGGA; β4 F: CCAACCCCAAGTGTTCCTACATC, β4 R: GCCTCAAGTGCTGGTTAAAATAGC.
FACS analysis.
Chick Slo fused to YFP (at its COOH terminus) and FLAG tag (at its NH2 terminus) with or without chick β1-cyan fluorescent protein (CFP) and, separately, chick β4-CFP were transfected into HEK cells. Forty-eight hours after transfection, live cells were harvested and incubated with anti-flag (M2) antibody (Sigma) in phosphate-buffered saline, 1% bovine serum albumin at 4°C. The primary antibody was detected by a secondary anti-mouse antibody conjugated to Alexa 647. The cells were fixed briefly in 1% paraformaldehyde before analysis. FACS analysis was carried out with FlowJo software (Tree Star, Ashland, OR) as previously described (35).
RNA interference experiments.
RNA interference (RNAi) experiments in chick cochlea were performed with a protocol previously described (15). Two sets of siRNA duplexes each were used for β1 and, separately, β4 knockdown. They had the following sequences: β1 ccaaagaagugaaagcaaauu/uuugcuuucacuucuuugguu (sense/antisense) and gcucagaagaugaagauauuu/auaucuucaucuucugagcuu; β4 cagaaauacuggaaagagauu/ucucuuuccaguauuucuguu and acacggaggcggaggacaauu/uuguccuccgccuccguguuu.
Cochlea were fixed 3 days after transfection and Slo detected with confocal microscopy as previously described (48). Cells were scanned in the z-plane from the base to the apex of each cell with a Zeiss 510 confocal microscope. Fluorescence intensity in a 50 × 50-μm area was ascertained after background subtraction with Zeiss LSM Image Analyser software. We had identified membrane clustering of Slo with this methodology and demonstrated Slo membrane clusters to have increased fluorescence. The average fluorescence intensity of Slo membrane clusters was 400 arbitrary units/pixel and was used as a threshold to demarcate surface clusters of Slo.
Data analysis.
All results are given as means ± SE. Where appropriate, ANOVA was used to test for significance in differences.
RESULTS
β4- and β1-subunits are expressed differentially along tonotopic axis.
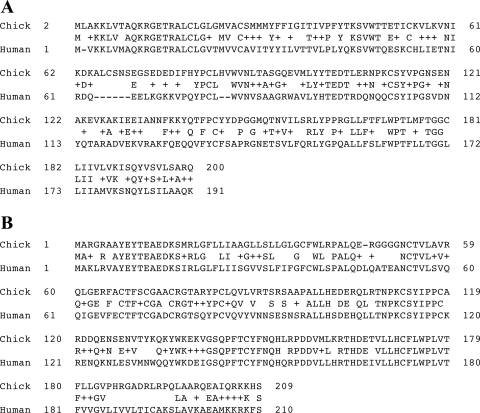
We identified and cloned the chick β4- and β1-subunits of the Slo channel by screening expressed sequence tag (EST) databases. Overall, β4- and β1-subunits have 64% and 45% identity, respectively, with the corresponding human subunits (Fig. 1). Notably, the chick β1-subunit has 94% identity with the previously identified quail subunit. Interestingly, while there was great sequence divergence in the overall sequence of both proteins, the NH2 terminus of these proteins showed much greater sequence conservation compared with the human sequence. Thus there was 86% identity in the first 30 amino acids of the chick and human β1-subunits. Similarly, there was a 92% identity in the first 30 amino acids of the chick and human β4-subunits. Previous work has shown the NH2 terminus of the β-subunits as key in influencing Slo channel kinetics (42).
Fig. 1.
Conservation of the β1 and β4 amino acid sequences is particularly notable at their NH2 termini. The chick β1 (A)- and β4 (B)-subunits aligned (with the BLAST algorithm) with their corresponding human orthologs are shown. Identical amino acids and conservative substitutions (+) are indicated. β1 shows 45% identity across the entire sequence, although the first 20 amino acids show much greater sequence identity (17/20 or 85%). In contrast, the β4-subunits show greater (61%) identity across the entire sequence and a degree of identity similar to the β1 orthologs at the NH2 terminus (17/21 or 81%).
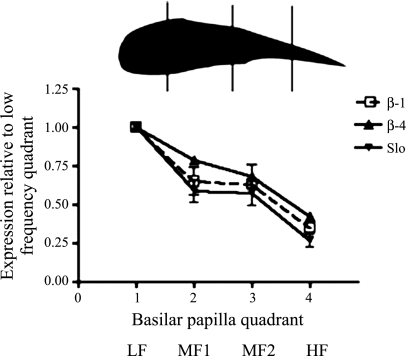
We determined the distribution of these two subunits along the tonotopic axis with qPCR. As shown in Fig. 2 the β4- and β1-subunits were expressed predominantly in the low-frequency quadrant of the basilar papilla. Similarly, and unexpectedly, Slo transcripts were also expressed in greater abundance at the low-frequency end of the papilla. There was a steep and gradual decrease in the expression of these transcripts. Compared with the lowest-frequency quadrant, β4 was expressed at levels of 78%, 68%, and 43% in the successive higher-frequency quadrants, respectively. Similarly, the β1-subunit was expressed at 63%, 65%, and 35% in the successive higher-frequency segments. We were unable to confirm whether these differences in transcript levels corresponded to levels in protein expression. Presently there are no commercial antibodies against the chick β-subunits. We were unable to detect chick β1 and β4 proteins with several commercial antibodies against the mammalian ortholog. The Slo transcripts were expressed at 58%, 57%, and 26% in successive higher-frequency quadrants compared with the lowest-frequency quadrant. These data stand in contrast to the demonstrated increase in Slo protein expressed in the membrane as determined by both electrophysiological and antibody labeling experiments (2–4, 48).
Fig. 2.
β1- and β4-subunits are expressed in a gradient along the tonotopic axis of the basilar papilla. Transcript levels of β1- and β4-subunits expressed in successive quadrants of the tonotopic axis normalized to expression in the low frequency (LF) quadrant are shown. There is a decreasing amount of both transcripts from the LF to high-frequency (HF) ends of the papilla. The expression of both transcripts is also minimally changed across both middle-frequency (MF) quadrants (MF1 and MF2). The differences in expression between LF and both MF quadrants, MF and HF quadrants, and LF and HF quadrants are statistically significant (P < 0.01, ANOVA). Error bars are SD (n = 3).
β4-Subunit has effects on macroscopic currents that are at variance with those of β1.
We tested the effects of the β4-subunit on the kinetics of the Slo channel. Oocytes were injected with cRNA from the β4-subunit and cSlo. We chose for these experiments a cSlo transcript that when translated lacks extraneous amino acids inserted into its COOH terminus as a result of alternative splicing. The Slo open reading frame has a large number of extraneous amino acids inserted into its sequence as a result of alternative splicing. RNA encoding the very COOH terminus of the protein is also alternatively spliced, and the sequence we chose for these experiments encoded the amino acids KQKYVQEDRL at its COOH terminus. This variant is the most abundantly expressed form in the chick cochlea (34, 36).
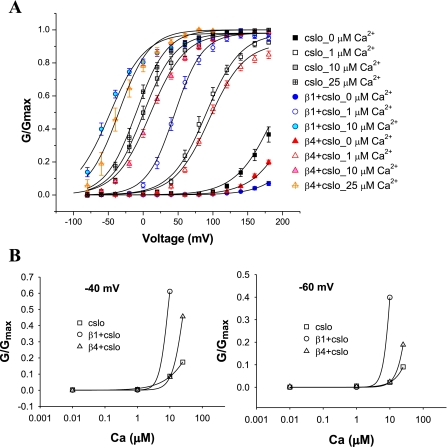
Using tail current measurement from macropatches in an inside-out configuration, we noted that cβ4 had opposing effects on the G-V curves that depended on the concentration of Ca2+. In 0, 1, and 10 μM Ca2+ G-V curves were shifted in a depolarizing (rightward) direction compared with cSlo alone. This effect was most pronounced in nominally Ca2+-free solutions (Fig. 3A). At higher concentrations of Ca2+ (>25 μM) G-V function was shifted in a hyperpolarizing (left) direction. This effect on G-V function was in contrast to the effect of the β1-subunit, which showed a shift in a depolarizing (right) direction in the nominally Ca2+-free solutions but a hyperpolarizing (left) shift in 1 μM Ca2+ and above.
Fig. 3.
β1 and β4 produce differential effects on conductance-voltage (G-V) relationships that are dependent on Ca2+ concentration. A: G-V relationships of inside-out macropatches from oocytes injected with Slo alone, Slo with β1, and, separately, Slo with β4, in different concentrations of “intracellular” Ca2+. Both β-subunits cause a shift in G-V function in a depolarizing direction in nominally Ca2+-free solutions. In contrast to β1, which causes a shift in a hyperpolarizing direction at all concentrations of Ca2+ (1 μM and greater), β4 causes a shift in a depolarizing direction in G-V relationships except when the concentration of intracellular Ca2+ exceeds 25 μM (and above). cSlo, n = 11; cSlo + β1, n = 12; cSlo + β4, n = 15. B: β4 increases Ca2+ sensitivity of BK channels at voltages that span a hair cell's operating voltage range (−50 mV ± 5 mV). The effects of increasing Ca2+ concentration on G/Gmax at both −60 mV and −40 mV reveal β4 to sensitize Slo to physiological concentrations of Ca2+ (5–50 μM). There is a dramatic rise in current in the presence of the β4-subunit. In contrast, the β1-subunit confers increased channel opening at <10 μM Ca2+, at these voltages (cSlo, n = 11; cSlo + β1, n = 12; cSlo + β4, n = 15).
Calcium sensitivity is an important parameter of hair cell BK channels. We determined effects on Ca2+ sensitivity of the BK channel imparted by the β4- and β1-subunits. We plotted the Ca2+ concentration needed to bring about half-maximal opening of the channel at a particular voltage in the presence and absence of the two β-subunits (Fig. 3B). The value for the half-saturating Ca2+ concentration at 0 mV interpolated from these data confirmed the increased Ca2+ sensitivity brought about by the β1-subunit; K0.5 (0 mV) was 20.9 μM for cSlo and 2.9 μM for cSlo and β1. The corresponding value for Slo and β4 was 14.8 μM Ca2+. However, β4 had a sharper rise in current at higher (more physiological) concentrations of Ca2+. This is depicted in Fig. 3B, where G/Gmax is plotted against Ca2+ concentration at −40 mV and −60 mV. This voltage range spans the presumed operating voltage range in hair cells (−50 mV ± 5 mV). As is evident, β4 has the ability to act as a binary molecular switch at these voltages since it dramatically raises current with increasing concentrations of Ca2+ in the physiological range (estimated to lie between 5 and 50 μM Ca2+ in hair cells) (4).
Using the Hill equation, we determined that at +60 mV Slo alone had a Kd of 2.3 (n = 1.32). In contrast, at +60 mV the β1- and β4-subunits gave Kd of 0.35 μM (n = 0.9) and 3.4 μM (n = 1.45), respectively. In turtle hair cells, where comparable values have been published, at +50 mV the Hill equation gave a Kd of 2.9 (n = 3.5), a value closest to Slo and β4.
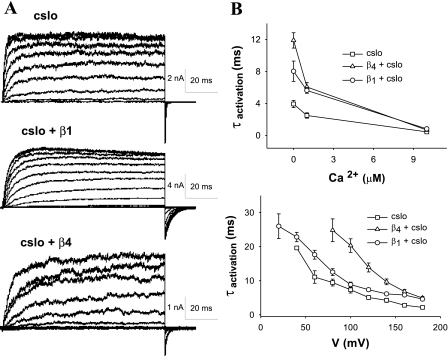
The effects of the β4- and β1-subunits on activation times are depicted in the macrocurrent traces in Fig. 4A. Activation times of Slo were affected by both voltage and Ca2+ concentration and are shown in Fig. 4B. We first subjected excised inside-out patches to a step protocol holding at −100 mV and stepping to a range of voltages from −80 to +180 mV. β4 shortened activation times of cSlo akin to the effects of the β1-subunit, albeit more pronounced (Fig. 4). This effect was seen at all voltages. Changing the concentration of Ca2+ perfusing the “intracellular” surface of the patch at a given voltage command also resulted in faster rates of activation.
Fig. 4.
Activation of Slo, dependent on voltage and Ca2+, is slowed by β4 and β1. A: current traces of inside-out macropatches from oocytes injected with cSlo, cSlo and β1, and cSlo and β4 cRNA subjected to a step voltage protocol. Patches were held at −100 mV and stepped to a range of voltages varying from −80 to +180 mV before stepping back to −100 mV (1 μM intracellular Ca2+). β4 slows activation more than β1 (cSlo, n = 15; cSlo + β1, n = 12; cSlo + β4, n = 20). B: activation time constants (τactivation) as a function of Ca2+ (with voltage stepped from −100 to +60 mV, top) and voltage (with intracellular Ca2+ held at 1 μM, bottom). As is evident, higher voltage and Ca2+ both result in shortened times of activation.
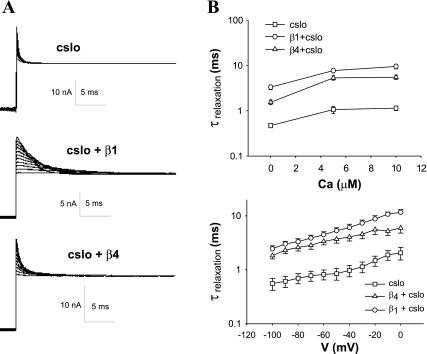
Similarly, both β-subunits increased relaxation times after a step depolarization. In these experiments we held the voltage at a value that resulted in maximal opening of channels in the patch and then changed its voltage to a range of values and determined relaxation of the channels. As with activation times, relaxation times were dependent on the concentration of Ca2+ and the voltage used for the step depolarization (Fig. 5). Lower concentrations of Ca2+ and more hyperpolarizing voltages to which the channel was stepped both resulted in shorter relaxation times. As with activation times, the addition of either the β1- or β4-subunit slowed relaxation. In contrast to activation times, relaxation times were most affected by the β1-subunit. Notably, addition of either β1- or β4-subunit does not affect the ability of voltage and Ca2+ to influence relaxation times, although they influence the set point.
Fig. 5.
Relaxation times, dependent on both Ca2+ and voltage, are shortened by β1- and β4-subunits. A: current traces from macropatches subjected to a depolarizing voltage (+180 mV) and stepped to a range of voltages (−100 to 0 mV) (intracellular Ca2+ concentration of 1 μM). The β1-subunit and, to a lesser extent, the β4-subunit shorten relaxation times. B: both decreasing Ca2+ (stepped from +100 mV to −100 mV, top) and hyperpolarizing voltage (intracellular Ca2+ held at 1 μM, bottom) shorten relaxation times. The relative differences in relaxation time induced by both β-subunits are maintained in different voltages and Ca2+ concentrations (cSlo, n = 11; cSlo + β1, n = 11; cSlo + β4, n = 11). τrelaxation, relaxation time constant.
In previous experiments in turtle and chick hair cells relaxation times were shown to correlate with characteristic frequency of individual hair cells. In these experiments relaxation times were determined with a fixed-voltage protocol and Ca2+ concentration. Two voltage commands and Ca2+ concentrations were used in the two species [a step from +50 mV to −50 mV with 4 μM Ca2+ in the turtle (4, 24, 25) and a step from +100 to −100 mV with 5 μM Ca2+ in the chick by the Fuchs group (12, 44)]. We subjected patches to a similar protocol (+100 to −100 mV in 5 μM Ca2+) to enable comparison with BK channels native to the hair cell. As shown in Table 1 the β-subunits both increased relaxation times compared with cSlo alone at these voltage and Ca2+ parameters. However, relaxation times were less prolonged by β4 than by β1.
Table 1.
Relaxation times obtained from macropatches hyperpolarized from +100 mV to −100 mV in 5 μM Ca2+
| cSlo (n = 10) | β1 + cSlo (n = 9) | β4 + cSlo (n = 11) | |
|---|---|---|---|
| τrelaxation, ms | 1.06 | 7.71 | 5.32 |
| SE | 0.19 | 0.60 | 0.58 |
Values are means and SE for n macropatches. cSlo, chicken Slo; τrelaxation, relaxation time constant.
β4-Subunit has effects on single-channel kinetics that are intermediate between those of β1 and Slo alone.
We recorded single-channel tracings from inside-out patches of oocytes expressing cSlo with and without the β4- and (separately) β1-subunits. We limited our analysis to patches containing one single channel. We determined Po of these channels but noted significant variability in Po-V relationships between individual patches. A corollary of this finding is that only a minority of patches had Po-V relationships that coincided with the G-V curves obtained from macrocurrent recordings.
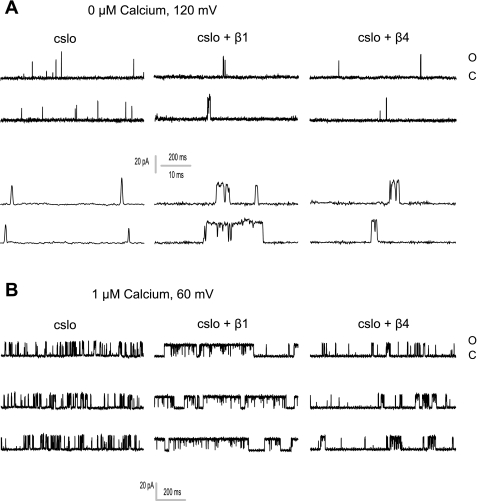
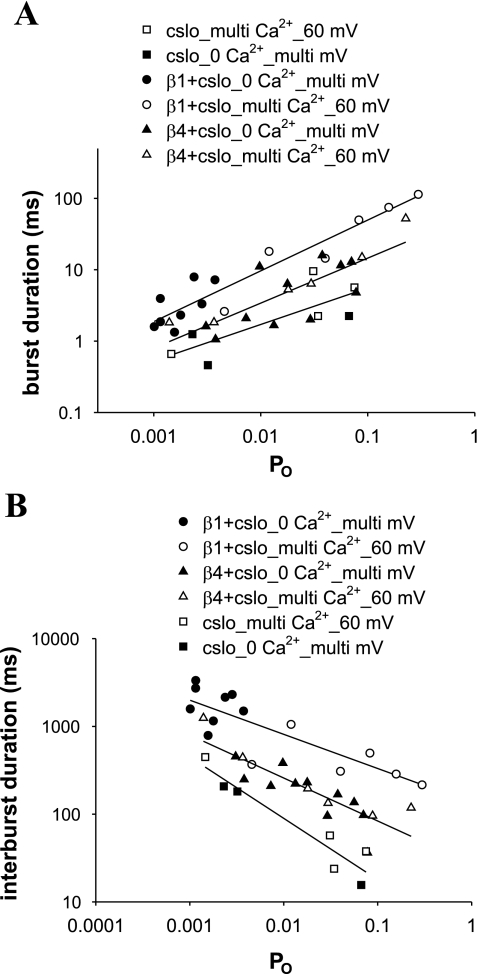
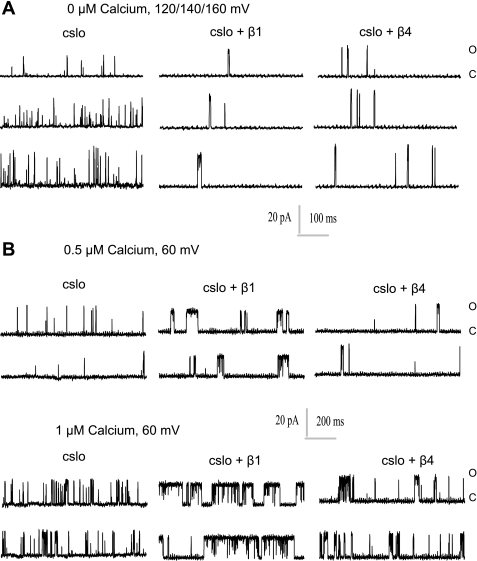
We determined that the β4- and β1-subunits retain the channel in a bursting state, increasing channel burst duration (Fig. 6). This effect was previously characterized in detail in the mammalian β1-subunit (39, 40). The effect of the β4-subunit was less than that of the β1-subunit. Notably, both of these subunits increased burst duration in nominally Ca2+-free solutions. In addition to their effects on burst duration, both β-subunits also increased interburst duration. These effects are depicted in Fig. 7, which shows β1 and β4 to increase burst duration and interburst duration at a given Po. The increase in burst duration and interburst duration was independent of the mechanism of channel activation, whether by an increase in concentration of Ca2+ or in voltage. Figure 8 shows representative traces depicting the effects of increasing Ca2+ and voltage on Po and burst duration of Slo in the absence and presence of β1 and, separately, β4. These data are in agreement with an exhaustive study by Nimigean and Magleby (39, 40), who noted similar results in the mammalian (mouse) β1-subunit.
Fig. 6.
Single-channel recordings confirm that both β-subunits prolong bursting, even in the absence of Ca2+. Single-channel tracings from excised inside-out patches expressing Slo, Slo and β4, and Slo and β1 in 0 μM (A) and 1 μM (B) Ca2+ are shown. As is evident, both β-subunits increase bursting of the channel even in nominally Ca2+-free solutions, with β1 having a more marked effect. Open (o) and closed (c) states are indicated.
Fig. 7.
Both β-subunits increase burst duration and interburst duration, with the β1-subunit having a greater effect on both and β4 having an intermediate effect. Plot of open probability (Po) vs. burst duration (A) and interburst duration (B) are shown. Filled symbols designate data in nominally Ca2+-free solutions with varying voltage. Open symbols designate data from traces at +60 mV with varying concentrations of Ca2+. Increasing Po, whether from increasing Ca2+ or voltage, changes the burst and interburst duration in a parallel fashion in all 3 experimental groups (cSlo alone, cSlo and β1, and cSlo and β4).
Fig. 8.
Effects of increasing Ca2+ and voltage on Po and burst duration. Representative traces depicting effects on burst duration and Po of increasing voltage (in nominally 0 μM Ca2+; A) and increasing Ca2+ (with constant voltage; B), which both increase burst duration and Po are shown. Traces from cSlo, cSlo and β1, and cSlo and β4 are shown. Burst duration induced by β1 is greater than that induced by β4.
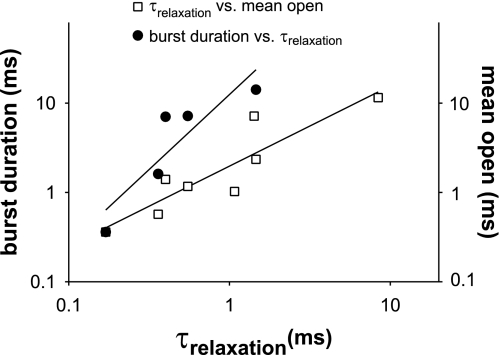
We additionally determined a correlation between burst duration and relaxation times after a voltage step (Fig. 9). For patches expressing Slo alone, Slo with β1, or Slo with β4, there was a linear correlation between the burst duration at a given concentration of Ca2+ and the relaxation times after a step depolarization (slope = 8.1, regression coefficient = 0.8). A better correlation was obtained between mean open times and relaxation times (slope = 1.2, regression coefficient = 0.9). In assessing these correlations we limited our analysis to single channels that had Po-V relationships that matched G-V relationships from macropatch recordings.
Fig. 9.
Relaxation times correlated with both mean open time and burst duration. Relaxation times from macropatches subjected to a step depolarization from +60 mV to −100 mV (1 and 10 μM Ca2+) or from +120 mV to −100 mV (nominally 0 μM Ca2+) were plotted against mean burst duration (left axis) or mean open times (right axis). To make valid comparisons, the values for both mean open times and mean burst times were obtained at the corresponding voltage and Ca2+ concentrations (+60 mV with 1 or 10 μM Ca2+ and +120 mV with nominally 0 μM Ca2+). Filled and open symbols indicate the correlation between burst duration and relaxation times and between mean open times and relaxation times, respectively. Fits in both correlations are shown. Relaxation time constants correlated better with mean open times (with a regression coefficient of 0.9 and slope 1.2) compared with burst duration and relaxation times (with a regression coefficient of 0.80 and slope 8.1).
Knockdown of both subunits by siRNA increases surface expression of Slo.
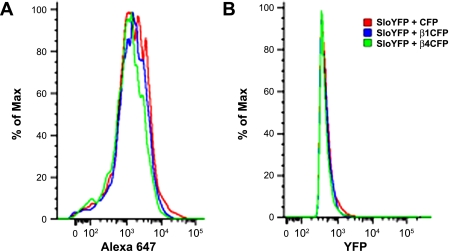
Analysis of macrocurrent data showed that addition of both β-subunits significantly decreased the total current within a macropatch (note that macropatches were of the same dimension, ∼0.5 μm2). Previous reports have shown contradictory effects on the surface expression of Slo by the β1-subunit. To test the effects on surface expression we used a Slo construct that included a FLAG tag at its extracellular NH2 terminus. Using FACS analysis, we observed a significant decrease in the surface expression of Slo in HEK cells that were cotransfected with either β1- or β4-subunits, consistent with our macropatch data. This decrease in surface expression was achieved without affecting total amounts of intracellular Slo (Fig. 10).
Fig. 10.
Both β-subunits decrease surface expression of Slo in HEK cells. A: histogram of fluorescence intensity detected by fluorescence-activated cell sorting (FACS) of HEK cells expressing FLAG-cSlo-yellow fluorescent protein (YFP) cotransfected with cyan fluorescent protein (CFP), β1-CFP, and, separately, β4-CFP shows that surface expression of Slo, detected 48 h later, is decreased. Surface expression of Slo was detected with anti-FLAG antibody labeling of live cells. Anti-mouse Alexa 647 was used as a secondary antibody. Slo-expressing cells were selected with identical YFP gating. Note that fluorescence intensity is denoted on a log scale. B: in contrast, total expression of Slo detected by YFP fluorescence (in the identical experiment shown in A) confirms that total Slo expression was minimally affected by coexpression of the β-subunits.
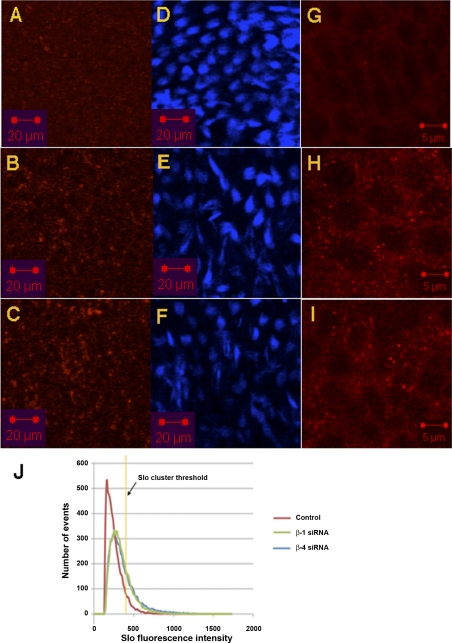
We tested whether this decrease in Slo surface expression induced by the β-subunits is physiologically important. Chick cochlea were kept in culture in the presence of siRNA to β1- and, separately, β4-subunits (Fig. 11). We had established separately that these siRNAs were able to knock down expression of these respective β-subunits in HEK cells transfected with β1- and β4-subunits fused to CFP (data not shown). Slo was identified with fluorescent antibody labeling. Slo expressed on the surface of hair cells is clustered and consequently has a markedly higher fluorescence intensity. As is evident, there was an increase in the expression of Slo on the surface of hair cells treated with siRNA to both subunits. The effect of β4 siRNA was similar to that of β1, with a 330% increase in surface expression of Slo in hair cells with β4 siRNA and a 290% increase in surface expression with β1 siRNA.
Fig. 11.
Slo surface expression in hair cells is increased by small interference RNA (siRNA)-mediated knockdown of the β1- and β4-subunits. Confocal images in the x-y plane of hair cells derived from chick cochlea kept in culture and transfected with a nontargeting siRNA (A, D, G) or siRNA to β1 (B, E, H) and β4 (C, F, I) are shown. Slo immunofluorescence (A–C) at the basal pole of hair cells detected under low magnification is contrasted with Alexa 647 phalloidin staining of stereocilliary actin bundles (D–F) 2 μm above in the z-axis. Also shown are the corresponding high-magnification confocal images in the x-y plane of Slo immunofluorescence (G–I). As is evident, there was an increase in Slo immunofluorescence in hair cells after knockdown of both β1- and β4-subunits. Moreover, there was also an increase in the clustering of Slo in hair cells treated with β1 and β4 siRNA. Scale bars are indicated. J: volumetric analysis of image intensity of Slo in a 2,500-μm2 area along the z-plane from the base to apex of hair cells along the neural edge shows an increase in Slo labeling after treatment with β1 and β4 siRNA. The mode in fluorescence intensity increased from 160 in control cochlea to 276 in cochlea treated with β1 siRNA and 256 in cochlea treated with β4 siRNA. Increased clustering of the channel in cochlea transfected with siRNA to the β1- and β4-subunits was evidenced. The threshold in fluorescence intensity for demarcating clusters is shown. There is a 290% and 330% increase in the number of clusters in cochlea treated with siRNA to the β1- and β4-subunits, respectively, compared with control cochlea.
DISCUSSION
In this article we describe the distribution of the β4-subunit of Slo in the basilar papilla and its physiological effects, comparing it to the β1-subunit. Our data confirm that the chick β-subunits have effects on Slo macroscopic and single-channel kinetics that are broadly similar to their mammalian counterparts.
Since there is sequence preservation between β-subunits from different phyla that is most notable at their NH2 terminus, these data confirm a role for the NH2 terminus of the protein in determining its effects on Slo kinetics. Prior work has confirmed the NH2 terminus of β-subunits as a region most critical for determining their effects on the kinetic properties of Slo (42).
We noted a significant variability in single-channel recordings, a finding that has been established previously with mammalian Slo channels (18–20). Macropatch recordings, in contrast, show considerably less variability. Our macropatches were estimated to have a 100-fold greater density of channels. It is possible that the lower variability in macropatches merely represents statistical averaging.
In a side-by-side comparison the β4-subunit has effects on Slo kinetics that parallel those of the β1-subunit, although not as pronounced. Thus the β1-subunit increased apparent Ca2+ sensitivity by shifting G-V curves in the presence of Ca2+ to more hyperpolarizing voltages. This effect was seen with the β4-subunit only at higher concentrations of Ca2+. In contrast, in nominally Ca2+-free solutions β1 shifts Slo G-V function to more depolarizing voltages than β4 alone. Similarly, both β-subunits slow relaxation times, with the β1-subunit having more pronounced effects. The singular exception to the rule that β1 had more pronounced effects was the effect on activation, where the β4-subunit prolonged activation times more than β1.
Single-channel recordings showed that both subunits prolong bursting, with the β1-subunit having a more pronounced effect. The effects on bursting were seen in nominally Ca2+-free solutions. These data are consistent with prior work by Nimigean and Magleby (39, 40). We observed that the duration of bursting correlated with relaxation times. Together with data showing slowed activation and relaxation times with the β-subunits, these data suggest that the β-subunits slow the transition from open to closed states and vice versa.
While we have evidence for transcription of the β1 and β4 genes in the basilar papilla, the exact physiological role of these proteins in hair cells has to be established. The data presented here are indirectly supportive of the role of the β-subunits in Slo kinetics in hair cells. Moreover, we have direct evidence that they play a part in Slo localization on the surface of hair cells.
BK channels in chick hair cells have a critical role in electrical tuning, a mechanism that allows frequency selectivity. Both empirical and modeling data have shown hair cell resting membrane potential to fluctuate 2–5 mV from approximately −50 mV, with Ca2+ concentration estimated to fluctuate from 5 to 50 μM (2, 4, 9). These data argue for β4 to play an important and integral role in electrical tuning. The β4-subunit changes Slo kinetics, with steeper opening of the channel in the 5–35 μM range in Ca2+ concentrations at voltages (−40 mV to −60 mV) that span a hair cell's operating voltage (−50 mV). In contrast, the Slo α-subunit alone has a more shallow opening in response to changes in Ca2+ concentrations at these voltages. Similarly, the β1-subunit results in Slo channels that are close to maximally open even at lower physiological concentrations of Ca2+ (5 μM) at −40 mV and −60 mV. Taken together, these data give theoretical credence that β4 plays a critical role in electrical tuning. The prolonged bursting behavior induced by both β-subunits is seen in low-frequency hair cells in the turtle, in keeping with the increased expression of both β-subunits in low-frequency hair cells. The relaxation time constants induced by either subunit, however, are in excess of that observed in native hair cells, suggesting that additional mechanisms are responsible for BK channel kinetics. It is plausible that other modifiers including tonotopically determined phosphorylation or association with other subunits selectively affect specific aspects of Slo kinetics (bursting/relaxation times), keeping other kinetic properties (Ca2+ sensitivity) constant.
Our data showing increasing amounts of Slo clusters in the surface membrane of hair cells treated with siRNA to the β4- and β1-subunits suggest that the β4- and β1-subunits are expressed in hair cells and that they play a meaningful physiological role. Our data in explanted chick basilar papillae replicate data in HEK cells, where these subunits reduce surface expression of Slo. While they suggest a common mechanism between HEK cells and hair cells, it remains to be determined how these subunits normally reduce surface expression of Slo. These data also help reconcile the discordance between the increased amounts of Slo transcript in low-frequency hair cells compared with high-frequency hair cells, which contrasts with the lower channel density in the membrane of these cells. Since β1 and β4 are expressed at higher levels in low-frequency hair cells, our data suggest that these proteins preferentially prevent Slo expression on the surface of low-frequency hair cells.
GRANTS
This study is supported by National Institute on Deafness and Other Communication Disorders Grant R01-DC-007894.
DISCLOSURES
No conflicts of interest, financial or otherwise, are declared by the author(s).
ACKNOWLEDGMENTS
We thank Dr. Fred Sigworth for valuable comments on single-channel recording analysis and Dr. Joseph Santos-Sacchi for critical reading of this manuscript.
REFERENCES
- 1. Amberg GC, Bonev AD, Rossow CF, Nelson MT, Santana LF. Modulation of the molecular composition of large conductance, Ca2+ activated K+ channels in vascular smooth muscle during hypertension. J Clin Invest 112: 717–724, 2003 [DOI] [PMC free article] [PubMed] [Google Scholar]
- 2. Art JJ, Crawford AC, Fettiplace R. Electrical resonance and membrane currents in turtle cochlear hair cells. Hear Res 22: 31–36, 1986 [DOI] [PubMed] [Google Scholar]
- 3. Art JJ, Fettiplace R. Variation of membrane properties in hair cells isolated from the turtle cochlea. J Physiol 385: 207–242, 1987 [DOI] [PMC free article] [PubMed] [Google Scholar]
- 4. Art JJ, Wu YC, Fettiplace R. The calcium-activated potassium channels of turtle hair cells. J Gen Physiol 105: 49–72, 1995 [DOI] [PMC free article] [PubMed] [Google Scholar]
- 5. Atkinson NS, Robertson GA, Ganetzky B. A component of calcium-activated potassium channels encoded by the Drosophila slo locus. Science 253: 551–555, 1991 [DOI] [PubMed] [Google Scholar]
- 6. Bers DM, Patton CW, Nuccitelli R. A practical guide to the preparation of Ca2+ buffers. Methods Cell Biol 40: 3–29, 1994 [DOI] [PubMed] [Google Scholar]
- 7. Butler A, Tsunoda S, McCobb DP, Wei A, Salkoff L. mSlo, a complex mouse gene encoding “maxi” calcium-activated potassium channels. Science 261: 221–224, 1993 [DOI] [PubMed] [Google Scholar]
- 8. Colquhoun D, Sigworth FJ. Fitting and statistical analysis of single-channel records. In Single-Channel Recording, edited by Sakmann B, Neher E. New York: Plenum, 1995, p. 483–588 [Google Scholar]
- 9. Crawford AC, Fettiplace R. An electrical tuning mechanism in turtle cochlear hair cells. J Physiol 312: 377–412, 1981 [DOI] [PMC free article] [PubMed] [Google Scholar]
- 10. Diez-Sampedro A, Silverman WR, Bautista JF, Richerson GB. Mechanism of increased open probability by a mutation of the BK channel. J Neurophysiol 96: 1507–1516, 2006 [DOI] [PubMed] [Google Scholar]
- 11. Du W, Bautista JF, Yang H, Diez-Sampedro A, You SA, Wang L, Kotagal P, Luders HO, Shi J, Cui J, Richerson GB, Wang QK. Calcium-sensitive potassium channelopathy in human epilepsy and paroxysmal movement disorder. Nat Genet 37: 733–738, 2005 [DOI] [PubMed] [Google Scholar]
- 12. Duncan RK, Fuchs PA. Variation in large-conductance, calcium-activated potassium channels from hair cells along the chicken basilar papilla. J Physiol 547: 357–371, 2003 [DOI] [PMC free article] [PubMed] [Google Scholar]
- 13. Fernandez-Fernandez JM, Tomas M, Vazquez E, Orio P, Latorre R, Senti M, Marrugat J, Valverde MA. Gain-of-function mutation in the KCNMB1 potassium channel subunit is associated with low prevalence of diastolic hypertension. J Clin Invest 113: 1032–1039, 2004 [DOI] [PMC free article] [PubMed] [Google Scholar]
- 14. Fettiplace R, Fuchs PA. Mechanisms of hair cell tuning. Annu Rev Physiol 61: 809–834, 1999 [DOI] [PubMed] [Google Scholar]
- 15. Frucht CS, Uduman M, Duke JL, Kleinstein SH, Santos-Sacchi J, Navaratnam DS. Gene expression analysis of forskolin treated basilar papillae identifies microRNA181a as a mediator of proliferation. PLoS One 5: e11502, 2010 [DOI] [PMC free article] [PubMed] [Google Scholar]
- 16. Fuchs PA, Nagai T, Evans MG. Electrical tuning in hair cells isolated from the chick cochlea. J Neurosci 8: 2460–2467, 1988 [DOI] [PMC free article] [PubMed] [Google Scholar]
- 17. Hamill OP, Marty A, Neher E, Sakmann B, Sigworth FJ. Improved patch-clamp techniques for high-resolution current recording from cells and cell-free membrane patches. Pflügers Arch 391: 85–100, 1981 [DOI] [PubMed] [Google Scholar]
- 18. Horrigan FT, Aldrich RW. Allosteric voltage gating of potassium channels. II. Mslo channel gating charge movement in the absence of Ca2+. J Gen Physiol 114: 305–336, 1999 [DOI] [PMC free article] [PubMed] [Google Scholar]
- 19. Horrigan FT, Aldrich RW. Coupling between voltage sensor activation, Ca2+ binding and channel opening in large conductance (BK) potassium channels. J Gen Physiol 120: 267–305, 2002 [DOI] [PMC free article] [PubMed] [Google Scholar]
- 20. Horrigan FT, Cui J, Aldrich RW. Allosteric voltage gating of potassium channels. I. Mslo ionic currents in the absence of Ca2+. J Gen Physiol 114: 277–304, 1999 [DOI] [PMC free article] [PubMed] [Google Scholar]
- 21. Housley GD, Marcotti W, Navaratnam D, Yamoah EN. Hair cells—beyond the transducer. J Membr Biol 209: 89–118, 2006 [DOI] [PubMed] [Google Scholar]
- 22. Hudspeth AJ, Lewis RS. A model for electrical resonance and frequency tuning in saccular hair cells of the bull-frog, Rana catesbeiana. J Physiol 400: 275–297, 1988 [DOI] [PMC free article] [PubMed] [Google Scholar]
- 23. Issa NP, Hudspeth AJ. Clustering of Ca2+ channels and Ca2+-activated K+ channels at fluorescently labeled presynaptic active zones of hair cells. Proc Natl Acad Sci USA 91: 7578–7582, 1994 [DOI] [PMC free article] [PubMed] [Google Scholar]
- 24. Jones EM, Gray-Keller M, Art JJ, Fettiplace R. The functional role of alternative splicing of Ca2+-activated K+ channels in auditory hair cells. Ann NY Acad Sci 868: 379–385, 1999 [DOI] [PubMed] [Google Scholar]
- 25. Jones EM, Gray-Keller M, Fettiplace R. The role of Ca2+-activated K+ channel spliced variants in the tonotopic organization of the turtle cochlea. J Physiol 518: 653–665, 1999 [DOI] [PMC free article] [PubMed] [Google Scholar]
- 27. Jones EM, Laus C, Fettiplace R. Identification of Ca2+-activated K+ channel splice variants and their distribution in the turtle cochlea. Proc Biol Sci 265: 685–692, 1998 [DOI] [PMC free article] [PubMed] [Google Scholar]
- 28. Lewis RS, Hudspeth AJ. Voltage- and ion-dependent conductances in solitary vertebrate hair cells. Nature 304: 538–541, 1983 [DOI] [PubMed] [Google Scholar]
- 29. MacKinnon R. Potassium channels. FEBS Lett 555: 62–65, 2003 [DOI] [PubMed] [Google Scholar]
- 30. Magleby KL. Gating mechanism of BK (Slo1) channels: so near, yet so far. J Gen Physiol 121: 81–96, 2003 [DOI] [PMC free article] [PubMed] [Google Scholar]
- 31. Magleby KL, Pallotta BS. Calcium dependence of open and shut interval distributions from calcium-activated potassium channels in cultured rat muscle. J Physiol 344: 585–604, 1983 [DOI] [PMC free article] [PubMed] [Google Scholar]
- 32. Mathur R, Zheng J, Yan Y, Sigworth FJ. Role of the S3-S4 linker in Shaker potassium channel activation. J Gen Physiol 109: 191–199, 1997 [DOI] [PMC free article] [PubMed] [Google Scholar]
- 33. McManus OB, Magleby KL. Kinetic states and modes of single large-conductance calcium-activated potassium channels in cultured rat skeletal muscle. J Physiol 402: 79–120, 1988 [DOI] [PMC free article] [PubMed] [Google Scholar]
- 34. Miranda-Rottmann S, Kozlov AS, Hudspeth AJ. Highly specific alternative splicing of transcripts encoding BK channels in the chicken's cochlea is a minor determinant of the tonotopic gradient. Mol Cell Biol 30: 3646–3660, 2010 [DOI] [PMC free article] [PubMed] [Google Scholar]
- 35. Navaratnam D, Bai JP, Samaranayake H, Santos-Sacchi J. N-terminal-mediated homomultimerization of prestin, the outer hair cell motor protein. Biophys J 89: 3345–3352, 2005 [DOI] [PMC free article] [PubMed] [Google Scholar]
- 36. Navaratnam DS, Bell TJ, Tu TD, Cohen EL, Oberholtzer JC. Differential distribution of Ca2+-activated K+ channel splice variants among hair cells along the tonotopic axis of the chick cochlea. Neuron 19: 1077–1085, 1997 [DOI] [PubMed] [Google Scholar]
- 38. Nelson MT, Bonev AD. The beta1 subunit of the Ca2+-sensitive K+ channel protects against hypertension. J Clin Invest 113: 955–957, 2004 [DOI] [PMC free article] [PubMed] [Google Scholar]
- 39. Nimigean CM, Magleby KL. Functional coupling of the beta1 subunit to the large conductance Ca2+-activated K+ channel in the absence of Ca2+. Increased Ca2+ sensitivity from a Ca2+-independent mechanism. J Gen Physiol 115: 719–736, 2000 [DOI] [PMC free article] [PubMed] [Google Scholar]
- 40. Nimigean CM, Magleby KL. The beta subunit increases the Ca2+ sensitivity of large conductance Ca2+-activated potassium channels by retaining the gating in the bursting states. J Gen Physiol 113: 425–440, 1999 [DOI] [PMC free article] [PubMed] [Google Scholar]
- 41. Ohmori H. Studies of ionic currents in the isolated vestibular hair cell of the chick. J Physiol 350: 561–581, 1984 [DOI] [PMC free article] [PubMed] [Google Scholar]
- 42. Orio P, Torres Y, Rojas P, Carvacho I, Garcia ML, Toro L, Valverde MA, Latorre R. Structural determinants for functional coupling between the beta and alpha subunits in the Ca2+-activated K+ (BK) channel. J Gen Physiol 127: 191–204, 2006 [DOI] [PMC free article] [PubMed] [Google Scholar]
- 43. Ramanathan K, Michael TH, Fuchs PA. Beta subunits modulate alternatively spliced, large conductance, calcium-activated potassium channels of avian hair cells. J Neurosci 20: 1675–1684, 2000 [DOI] [PMC free article] [PubMed] [Google Scholar]
- 44. Ramanathan K, Michael TH, Jiang GJ, Hiel H, Fuchs PA. A molecular mechanism for electrical tuning of cochlear hair cells. Science 283: 215–217, 1999 [DOI] [PubMed] [Google Scholar]
- 45. Roberts WM, Jacobs RA, Hudspeth AJ. Colocalization of ion channels involved in frequency selectivity and synaptic transmission at presynaptic active zones of hair cells. J Neurosci 10: 3664–3684, 1990 [DOI] [PMC free article] [PubMed] [Google Scholar]
- 46. Rosenblatt KP, Sun ZP, Heller S, Hudspeth AJ. Distribution of Ca2+-activated K+ channel isoforms along the tonotopic gradient of the chicken's cochlea. Neuron 19: 1061–1075, 1997 [DOI] [PubMed] [Google Scholar]
- 47. Ruttiger L, Sausbier M, Zimmermann U, Winter H, Braig C, Engel J, Knirsch M, Arntz C, Langer P, Hirt B, Muller M, Kopschall I, Pfister M, Munkner S, Rohbock K, Pfaff I, Rusch A, Ruth P, Knipper M. Deletion of the Ca2+-activated potassium (BK) alpha-subunit but not the BK beta1-subunit leads to progressive hearing loss. Proc Natl Acad Sci USA 101: 12922–12927, 2004 [DOI] [PMC free article] [PubMed] [Google Scholar]
- 48. Samaranayake H, Saunders JC, Greene MI, Navaratnam DS. Ca2+ and K+ (BK) channels in chick hair cells are clustered and colocalized with apical-basal and tonotopic gradients. J Physiol 560: 13–20, 2004 [DOI] [PMC free article] [PubMed] [Google Scholar]
- 49. Sigworth FJ, Sine SM. Data transformations for improved display and fitting of single-channel dwell time histograms. Biophys J 52: 1047–1054, 1987 [DOI] [PMC free article] [PubMed] [Google Scholar]
- 50. Tucker T, Fettiplace R. Confocal imaging of calcium microdomains and calcium extrusion in turtle hair cells. Neuron 15: 1323–1335, 1995 [DOI] [PubMed] [Google Scholar]
- 51. Wu YC, Art JJ, Goodman MB, Fettiplace R. A kinetic description of the calcium-activated potassium channel and its application to electrical tuning of hair cells. Prog Biophys Mol Biol 63: 131–158, 1995 [DOI] [PubMed] [Google Scholar]
- 52. Wu YC, Tucker T, Fettiplace R. A theoretical study of calcium microdomains in turtle hair cells. Biophys J 71: 2256–2275, 1996 [DOI] [PMC free article] [PubMed] [Google Scholar]


