

Abstract
The development and maintenance of mitochondrial heteroplasmy has important consequences for both health and heredity. Previous studies using pathogenic mutations have shown considerable variability between maternally related individuals and studies of several D-loop polymorphisms have suggested a relationship between heteroplasmy and somatic aging. To broadly explore the variation of human heteroplasmy and to clarify the dynamics of somatic heteroplasmy over the course of lifespan, we analyzed mitochondrial sequence variation across a range of ages. We utilized array-generated single-nucleotide polymorphism data that were well correlated with independent measures of heteroplasmy. Significant levels of heteroplasmy were identified at 0.24% of sites evaluated. By examining mother–child pairs, we found that heteroplasmy was inherited (30%) but could occur de novo in offspring or, conversely, be present in mothers but eliminated in their children (70%). Cumulatively, mitochondrial heteroplasmy across the genome increased significantly with advanced age (r = 0.224, P =8 × 10⁻³⁰). Surprisingly, changes in heteroplasmy were not uniform with some sites demonstrating a loss of variation (increased homoplasmy) with aging. These data suggest that both mutation and selective pressure affect blood mitochondrial DNA sequence over the course of the human lifespan and reveal the unexpectedly dynamic nature of human heteroplasmy.
INTRODUCTION
Variations within mitochondrial DNA (mtDNA) sequence give rise to heteroplasmy, defined as the presence of multiple distinct mitochondrial sequences within an individual. Heteroplasmy is a clinically significant state, since the severity of many mitochondrial disorders is dependent upon the ratio between wild-type and mutant sequences, with progressively more severe symptoms emerging as the ratio of mutated to normal genomes rises (1). Indeed, human mitochondrial heteroplasmy was first identified in studies of mitochondrial disease genetics where variable levels of deletions (2) or mutations (3) were noted in affected patients. However, heteroplasmy is not necessarily a pathogenic state. Heteroplasmic variations without apparent functional consequence are observed in samples from populations without overt mitochondrial disease (4). The frequency of heteroplasmy has been estimated in two studies of the hypervariable regions of mtDNA that found that >10% of individuals were heteroplasmic within these regions (5,6). A recent study using deep sequencing of the complete mitochondrial genome found that ∼25% of individuals had a heteroplasmic site across the entire genome (7).
Changes in heteroplasmy between generations have also been well described (8). For example, mutations not clinically detectable in one generation may cause disease in offspring because of changes in the mutation level between generations (9,10). Studies of the mitochondrial bottleneck, a constriction of mtDNA copy number between mother and offspring, have given a plausible explanation for rapid shifts in heteroplasmy (11).
In addition to shifts in heteroplasmy observed between generations, mitochondrial allelic frequencies vary within the individual. In studies of multiple tissues from the same individual, differing degrees of heteroplasmic variation have been detected, suggesting that heteroplasmy is non-uniform at a tissue or cellular level (8,12). Furthermore, the level of heteroplasmy has been shown to change over time. In patients with the mitochondrial encephalopathy, lactic acidosis and stroke-like episodes (MELAS) syndrome, the level of the pathogenic A3243G mutation detected within the blood declines with age, possibly due to counter-selection of cell lines bearing the mutation (13,14).
Several investigations have noted an association between increases in human mitochondrial heteroplasmy and aging. This includes pathogenic heteroplasmies, such as a large common deletion in mtDNA (15,16), but also seemingly benign deletions or polymorphic variants (6,17–22). Most of these latter heteroplasmies are within the control region of mtDNA, the non-coding segment containing sequences required for replication and transcription. One study has suggested that some heteroplasmies may be beneficial and are inherited by long-lived individuals and their offspring (23) and other studies have failed to identify a link between mutational load and age (5,24,25).
Interest in the role of mitochondrial dysfunction and mitochondrial mutation in aging has been longstanding (26). The identification of aging phenotypes in transgenic mice with an error prone mtDNA polymerase suggests that mitochondrial mutations may cause age-related pathology (27,28). However, the cause and effect relationship of these mutations continues to be controversial.
To understand the variation of mitochondrial heteroplasmy at high resolution and to assess the variability of mitochondrial mutations over the human lifespan, we have evaluated trends in heteroplasmy at a large number of neutral mitochondrial sites across a broad range of ages.
RESULTS
Validation of array-based quantification of heteroplasmy
Single-nucleotide polymorphism (SNP) data generated by genotyping arrays (Illumina) were obtained from blood samples of over 2400 individuals including 625 mother–child pairs. None of the individuals in the data set had confirmed or suspected mitochondrial disease. For analysis, we define a major and minor allele for the entire study population, where the majority of individuals within the data set have a predominance of the major allele. The array covers 138 sites within the mitochondrial genome, with an average density of one site per every 120 nucleotides. None of the polymorphic sites evaluated by the array has been conclusively linked to any mitochondrial disease, and with a single exception (2485C) each of the alleles was predominant in at least one individual within the data set.
To validate the array methodology for the detection of heteroplasmy, we compared array-generated data with that obtained using other techniques for heteroplasmy detection. Restriction-fragment length polymorphism (RFLP) analysis using radiolabeled PCR (last-hot-cycle PCR) correlated well with array-based sequence at highly heteroplasmic sites (Fig. 1A). However, very low levels of heteroplasmy that were identified by the SNP array were frequently not seen in last-hot-cycle PCR. To determine whether this was due to a limitation of last-hot-cycle PCR or a false detection from the array, we also compared array-generated results to allele-specific quantitative PCR (qPCR). qPCR was capable of detecting much lower levels of heteroplasmy than last-hot-cycle PCR and these closely correlated with those obtained from the SNP array (Fig. 1B). Four additional sites were investigated by qPCR and four by last-hot cycle PCR and similar correlations with array genotype were found (data not shown).
Figure 1.

Validation of array-based genotyping using RFLP analysis or quantitative real-time PCR. (A) DNA from individuals with varying G16129A heteroplasmy detected by the SNP array was amplified and digested with KpnI, which cuts the G16129 allele (upper panel). The array-determined fraction of G16129 heteroplasmy is displayed above and the calculated last-hot-start heteroplasmy value is displayed below. Mixtures of plasmid DNA with the indicated fraction of G16129 were analyzed to create a standard curve shown below. Ladder (L) and no template (NT) lanes are also provided. (B) qPCR for heteroplasmy at 1440 was performed on previously array-analyzed samples and the results were correlated (R2= 0.99). The inset shows a magnification of the values close to 1.0.
In order to evaluate the stability and reproducibility of array-based mitochondrial genotypes, we examined data from several samples (n = 28) where replicate microarrays were performed. Repeated array values had an average inter-assay genotype correlation of 0.9996 (data not shown) confirming the precision of array-based genotyping for mitochondrial SNPs.
Error limitation and description of overall heteroplasmy
We subsequently used array data to calculate the frequency of heteroplasmic sites in the study population. A principal concern in using any technique for the detection of heteroplasmy is to avoid systematic errors that cause an unacceptably high rate of false positive detection. To determine a baseline for variability of array genotyping, we analyzed homozygous genotype calls at 100 randomly selected nuclear SNPs in our study population. Homozygosity at nuclear SNPs should provide array-generated genotype frequencies close to zero or one, similar to the expected value for homoplasmic mitochondrial SNPs. Thus, the divergence from zero or one for homozygous nuclear positions approximates technical error. The mean genotype value for sites with a predicted value of zero was 0.00474. Thus, to exclude false discovery when evaluating heteroplasmy, we set a cutoff of this mean plus five standard deviations and accepted a value as heteroplasmic if both genotypes were present at >5.4% frequency.
Despite this strict criterion, a high level of total heteroplasmy was identified (2.5% of all sites) and several mitochondrial sites were clearly overrepresented (Supplementary Material, Table S1). The use of other fixed thresholds gave similarly skewed results because of site-specific differences. To correct this, we required the genotype frequency to be more than five standard deviations from the mean of all individuals at that site in addition to being greater than the 5.4% threshold defined by the nuclear SNPs (Supplementary Material, Table S2). Using this combined threshold, 0.24% of individual sites were heteroplasmic, and 16.8% of the individuals within the data set had at least one heteroplasmic site.
Inheritance of heteroplasmy in mother–child pairs
We evaluated positions that exceeded the heteroplasmy threshold for either individual within mother–child dyads to determine how frequently heteroplasmy was inherited and how often it was de novo or not transmitted between generations. Within our 625 dyads, we identified 224 heteroplasmies, 115 in mothers and 109 in children (Fig. 2). There were 30 instances in which both mother and child were exceeded the threshold for heteroplasmy at the same position. Therefore, maternal heteroplasmy is powerfully influential on the genotype of offspring (P <× 10−6 by random permutation, correlation between mother and child 0.96). However, heteroplasmy can also emerge or regress. We found the mean value of the inherited maternal heteroplasmies was significantly higher than the mean value for maternal heteroplasmies that were not inherited (Supplementary Material, Table S3). This effect was predictable since lower level heteroplasmies would be less likely to fix and would more frequently drift back towards a homoplasmic state in the next generation.
Figure 2.

Higher levels of maternal heteroplasmy are more frequently inherited. Maternal and child genotype values are plotted for any SNP pair in which either mother or child exceeds the heteroplasmy threshold (n = 194). Mothers who transmitted their heteroplasmy or had offspring with homoplasmy for the other allele (black squares) were significantly more heteroplasmic than mothers who did not transmit heteroplasmy (grey squares) (17.9 versus 11.1%, P< 1× 10⁻⁴ by t-test).
Correlation of heteroplasmy and age
The relationship between heteroplasmy and age at each of the sites was analyzed across the study population. We calculated an average level of heteroplasmy in each individual studied using data from all 138 sites. This measure of average heteroplasmy was positively correlated with age (ρ = 0.224, P= 8.6 × 10⁻³⁰, Fig. 3A). The relationship derived from this correlation infers that individuals experience a rise in heteroplasmy at the studied positions by a factor of 1.7 from infancy over the course of a typical 70-year lifespan. Similar relationships are not observed in the evaluation of randomly selected nuclear SNPs suggesting that this is not a feature of nuclear DNA (data not shown).
Figure 3.

Changes in heteroplasmy across the mitochondrial genome with age. (A) The aggregate heteroplasmy at all 138 SNPs was calculated and plotted against decadal age using a box plot. Error bars indicate one standard deviation from the mean. There are increased levels of mutation with increasing age (r = 0.224, P =8 ×10⁻³⁰). (B) Heteroplasmy at 13650 in individuals with the major C-allele (n = 2458) was plotted against age in decades (r = 0.27, P< 0.0002). (C) Heteroplasmy at 10915 in individuals with the major T-allele (n = 2459) was plotted against age in decades (r = −0.38, P <0.0002).
When mitochondrial positions detected on the array were analyzed individually, there was a positive correlation between age and heteroplasmy at 75% of the sites (Table 1 and Supplementary Material, Table S2). This is demonstrated by the data at position 13 650 in individuals with the major allele (C13650, Fig. 3B). As individuals age, there is an increase in the level of heteroplasmy. This correlation is perceptible despite the presence of large numbers of essentially homoplasmic individuals across the entire age spectrum. All transition mutations were equally well correlated with aging, suggesting that there was no preference for particular transition heteroplasmies to develop. There was a reduction in age-associated rise in heteroplasmy at sites encoding rRNA compared with all other sites (Spearman ρ = 0.05 versus 0.19 for all other sites; P =0.0042). There were no significant differences in age-related heteroplasmy trends between synonymous and non-synonymous changes in coding sequence.
Table 1.
Correlation of heteroplasmy with age for mitochondrial polymorphisms
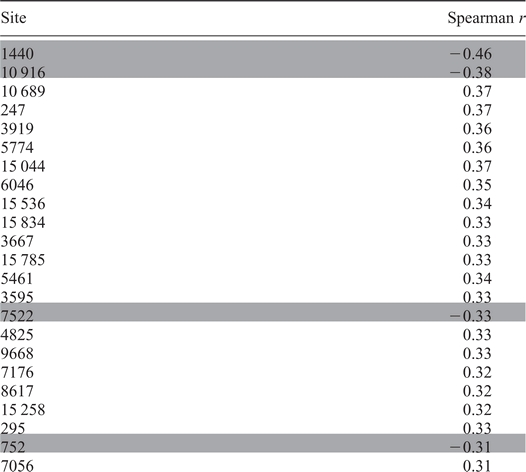 |
Spearman correlations for selected mitochondrial sites at the major allele are presented. Positive Spearman values indicate increasing heteroplasmy with age and negative Spearman values indicate increasing homoplasmy with age. All listed correlations are significant as determined by random permutation of age and genotype data (see Materials and Methods for statistical details). Shaded sites become more homoplasmic with advancing age. The complete data for all 138 sites are available in Supplementary Material, Table S2.
Surprisingly, at 10% of sites studied, the correlation of age with heteroplasmy was reversed (Supplementary Material, Table S2). An example of this negative correlation is seen in individuals with the C10915 allele, where the population became less heteroplasmic at more advanced age (Fig. 3C). The disappearance of heteroplasmy at some sites and not others suggests that not all of the polymorphisms are treated in an equivalent fashion, even though most of them represent synonymous changes or alterations in rRNA or tRNA sequences with no known pathogenic association.
Polymorphisms with divergence at major and minor alleles
At most of the sites where sufficient numbers of individuals were available to assess heteroplasmy at the minor allele, we observed an increase in heteroplasmy regardless of which allele was evaluated, suggesting that the two alleles are not treated in a distinct fashion (Supplementary Material, Table S2). However, at positions 1440 and 11467, one of the two alleles became more common regardless of the initial genotype. This occurred because the populations in which the major and minor allele predominated had opposing changes in heteroplasmy in relation to age. For individuals where the major G1440 predominated, we found decreasing heteroplasmy in older individuals (Fig. 4A). In the smaller subset where A1440 predominated, there was increased heteroplasmy in older individuals (Fig. 4B). The population as a whole converges towards the G1440 allele regardless of the initial genotype. A similar, although less robust, trend was seen at 11467 where there was convergence towards the minor allele (Fig. 4C and D). The data from these sites suggest that it is possible to perceptibly shift allele frequencies within a population, even over the time frame of the human lifespan.
Figure 4.

Evidence for selective pressure on polymorphisms during lifespan. Heteroplasmy is plotted for individuals who predominantly have the major G-allele (A; n = 2428) or the minor A-allele (B; n = 58) at 1440. The two populations show a convergence towards G1440. A similar convergence towards the G-allele is seen for the major (C) and minor (D) populations of 11 467.
DISCUSSION
In these studies, we have evaluated the frequency and degree of heteroplasmy in an unselected population and analyzed the correlation between heteroplasmy and age. Several previous studies of heteroplasmy have focused on clinically significant mutations associated with mitochondrial disease. However, pathogenic alleles such as G3243 are subject to strong selective pressures that may not be relevant to most mitochondrial polymorphisms. In order to study the phenomenon of heteroplasmy more generally, we used presumably neutral variants.
We have noted several advantages that array-based genotyping has over last-hot-cycle PCR for the detection of mitochondrial heteroplasmy. These include: lack of dependence upon suitable RFLPs, avoidance of radioactivity and, most importantly, improved linear range. These shortcomings of the last-hot-cycle technique have been noted previously (29). Array-based sequencing allows the efficient and simultaneous evaluation of a larger number of sites than either last-hot-cycle PCR or qPCR-based techniques. The use of genotyping arrays has expanded and a mitochondria-specific commercial genotyping array is currently used to identify strongly heteroplasmic sites in clinical samples (30). We have shown that the sensitivity of the SNP-based microarrays is comparable with qPCR and have correlated array-based data to results obtained using either qPCR or last-hot-cycle restriction digests. The widespread availability of SNP genotyping data including mitochondrial data that have not yet been analyzed may prove to be a facile way to examine the relationships between mitochondrial heteroplasmy and a variety of phenotypes.
The detected incidence of heteroplasmy, in 16% of individuals, is likely to be an underestimate. First, the mitochondrial sites evaluated on the array used represent only a fraction of polymorphic sites present within the mitochondrial genome. Furthermore, the use of a stringent cutoff to avoid false detection may necessarily exclude those with true, but lower levels of heteroplasmy. However, the variability of individual sites in this study may overestimate the mutation rate for the genome as a whole, since variation at many sites within the mitochondrial genome could be influenced by counterselection. Our results are in reasonable agreement with a recent study that used a deep sequencing approach of the entire genome, where 24% of the individuals were heteroplasmic (7).
Where relatedness information was available, children with highly heteroplasmic sites had often inherited heteroplasmy from their mothers. However, it was not uncommon to detect new heteroplasmies in children, and the frequent presence of lower level heteroplasmy in infants at positions that became homoplasmic when viewed on a population basis implies that minor heteroplasmies may be created readily during embryogenesis. The presence of unexpected levels of infantile heteroplasmic mutations was also noted in a study of cord blood samples (31). We captured four instances of transition from one predominant allele to another between two generations in a mother–child pair, all involving mothers who were highly heteroplasmic (Fig. 2). Our current understanding of the development of heteroplasmy may need to accommodate a more robust view of the potential for generating mitochondrial mutations during fetal life.
We note a general trend towards increasing heteroplasmy with the aging process. This finding correlated with previous investigations that have identified increased heteroplasmy of mitochondrial deletions and control region polymorphisms in older individuals. However, in this study, we find that all regions of the mitochondrial genome are affected, including synonymous and non-synonymous changes within coding sequences. This work is also the first to use individuals across the age spectrum, rather than discrete elderly populations, to observe that changes in heteroplasmy occur throughout the life and do not specifically emerge with senescence.
Of significance, not all variants, even those that are putatively neutral, are treated equivalently. The data for nucleotide 1440 imply that the A1440 allele is counterselected, at least in hematopoetic lineages. A decline in the A1440 allele is seen in the subpopulation where this allele predominates as well as in the larger group where A1440 is more rare. This allele has not been linked to mitochondrial dysfunction or disease. The nucleotide is within the 12S rDNA, and the allele could cause either a subtle effect upon translation or interfere with the activity of mtDNA-binding proteins.
The other site that demonstrated a shift towards a specific allele was 11 467. This polymorphism encodes a synonymous change within the sequence of ND4, but also distinguishes haplogroup populations at the branch point between haplogroups U and R. Because the change is synonymous, any selective effect must relate to a non-coding process such as DNA maintenance, codon preference, mRNA processing or stability. Precedent for such an effect is seen at the haplogroup-defining polymorphism C295T, which is in the non-coding region, but affects mitochondrial transcription factor A binding and mtDNA levels (32). We do not exclude the possibility that other sites within the mitochondrial genome, even those assayed in this study, could have convergent shifts towards one allele that may have been hidden by the low number of individuals in whom the minor allele predominated.
A subset of the sites evaluated became more homoplasmic with aging. A review of the function of these sites did not suggest an obvious pattern (see Supplementary Material, Table S2). Of the sites within protein-coding regions, all encoded synonymous changes; other polymorphisms are in tRNA and rRNA and have not been associated with disease. Further study will be required to elucidate why these polymorphisms trend towards homoplasmy.
An understanding of the dynamics of mitochondrial heteroplasmy is pivotal to our comprehension of how mtDNA mutations emerge and regress. The degradation of mtDNA over time could relate to the posited role of the mitochondrion as a biological clock. Understanding the biological basis of these phenomena will be crucial to the development of therapies based upon heteroplasmy and its manipulation.
MATERIALS AND METHODS
Data
We received a waiver from review by the Institutional Review Board at The Children's Hospital of Philadelphia. Samples (n = 2491) with valid age data were obtained (mean age 27.7 years, range 0–60). The samples were assayed using the HumanHap550 and HumanHap610 SNP chips (Illumina). These contain a common set of 138 mitochondrial SNPs. Mitochondrial sequence positions on the Illumina platform do not account for the historical sequence error in the reference genome at nucleotide 3107. To simplify comparisons, we have converted the SNP numbers to align to the rCRS consensus sequence (NC_012920).
Statistical analysis
Individual SNP data points with low call quality were excluded if the log R-value, a measure of signal intensity, was more than two standard deviations below the mean of the log R-value at that particular SNP. At each SNP, individuals were divided into two sets, one where the predominant call was the major allele for the site and one where it was the minor allele. The alleles were evaluated independently. The data were not normally distributed and the correlation between age and B-allele frequency was determined using ranks. P-values were calculated by randomly permuting the data (and hence the ranks) at each position (relative to the ranks of the ages) 10 000 times and determining the rank correlations These 10 000 correlations were compared with the observed correlation to determine the P-value. These P-values were corrected for multiplicity by using Bonferonni. To analyze the variation across the entire mitochondrial genome, the average absolute value of the variation of the B-allele values at each SNP from 1.0 and 0 was calculated and plotted against age using a Pearson correlation since these data were normally distributed. The significance (using a two-sided test) of the Pearson correlation, r, was calculated using a T-distribution with n−2 degrees of freedom on the transformed correlation 1/2 log((1 + r)/(1 − r)).
RFLP analysis
SNPs were evaluated using SNP Cutter (33). Primers (Integrated DNA Technologies) were used to amplify 50 ng of sample DNA using the last-hot-cycle method (34). The resulting fragments were digested with the appropriate restriction enzyme and resolved by acrylamide gel electrophoresis. Bands were quantified after exposure to a phosphorimager (GE Healthcare). Reference DNA sequences for quantification were TA-cloned from subject DNA into pCR2.1 (Invitrogen).
qPCR analysis
The qPCR strategy for the selected SNPs was designed using PrimerExpress (Applied Biosystems). Pre-mixed primer and dual-label probe combinations were used to amplify 20 ng sample DNA on a 7900Fast system run in absolute quantitation mode (Applied Biosystems). Cloned DNA (described above) was used to create the standard curve.
SUPPLEMENTARY MATERIAL
Supplementary Material is available at HMG online.
FUNDING
The work was supported by the National Institutes of Health (grant number K08HD058022 to N.S.); and by the Children's Hospital Pediatric Development Fund (to N.S.).
ACKNOWLEDGEMENTS
The authors would like to thank Laura Conlin, Nancy Spinner and Marc Yudkoff for helpful discussions. Joseph Glessner, Cecelia Kim and Jennifer Gerfin helped with sample identification.
Conflict of Interest statement. None declared.
REFERENCES
- 1.Chinnery P.F., Howell N., Lightowlers R.N., Turnbull D.M. Molecular pathology of MELAS and MERRF. The relationship between mutation load and clinical phenotypes. Brain. 1997;120:1713–1721. doi: 10.1093/brain/120.10.1713. [DOI] [PubMed] [Google Scholar]
- 2.Holt I.J., Harding A.E., Morgan-Hughes J.A. Deletions of muscle mitochondrial DNA in patients with mitochondrial myopathies. Nature. 1988;331:717–719. doi: 10.1038/331717a0. [DOI] [PubMed] [Google Scholar]
- 3.Wallace D.C., Zheng X.X., Lott M.T., Shoffner J.M., Hodge J.A., Kelley R.I., Epstein C.M., Hopkins L.C. Familial mitochondrial encephalomyopathy (MERRF): genetic, pathophysiological, and biochemical characterization of a mitochondrial DNA disease. Cell. 1988;55:601–610. doi: 10.1016/0092-8674(88)90218-8. [DOI] [PubMed] [Google Scholar]
- 4.Kirches E., Michael M., Warich-Kirches M., Schneider T., Weis S., Krause G., Mawrin C., Dietzmann K. Heterogeneous tissue distribution of a mitochondrial DNA polymorphism in heteroplasmic subjects without mitochondrial disorders. J. Med. Genet. 2001;38:312–317. doi: 10.1136/jmg.38.5.312. [DOI] [PMC free article] [PubMed] [Google Scholar]
- 5.de Camargo M.A., Paneto G.G., de Mello A.C., Martins J.A., Barcellos W., Cicarelli R.M. No relationship found between point heteroplasmy in mitochondrial DNA control region and age range, sex and haplogroup in human hairs. Mol. Biol. Rep. 2010;38:1219–1223. doi: 10.1007/s11033-010-0220-1. [DOI] [PubMed] [Google Scholar]
- 6.Calloway C.D., Reynolds R.L., Herrin G.L., Jr, Anderson W.W. The frequency of heteroplasmy in the HVII region of mtDNA differs across tissue types and increases with age. Am. J. Hum. Genet. 2000;66:1384–1397. doi: 10.1086/302844. [DOI] [PMC free article] [PubMed] [Google Scholar]
- 7.Li M., Schonberg A., Schaefer M., Schroeder R., Nasidze I., Stoneking M. Detecting heteroplasmy from high-throughput sequencing of complete human mitochondrial DNA genomes. Am. J. Hum. Genet. 2010;87:237–249. doi: 10.1016/j.ajhg.2010.07.014. [DOI] [PMC free article] [PubMed] [Google Scholar]
- 8.Bendall K.E., Macaulay V.A., Baker J.R., Sykes B.C. Heteroplasmic point mutations in the human mtDNA control region. Am. J. Hum. Genet. 1996;59:1276–1287. [PMC free article] [PubMed] [Google Scholar]
- 9.Maassen J.A., Biberoglu S., 't Hart L.M., Bakker E., de Knijff P. A case of a de novo A3243G mutation in mitochondrial DNA in a patient with diabetes and deafness. Arch. Physiol. Biochem. 2002;110:186–188. doi: 10.1076/apab.110.3.186.8294. [DOI] [PubMed] [Google Scholar]
- 10.Brown D.T., Samuels D.C., Michael E.M., Turnbull D.M., Chinnery P.F. Random genetic drift determines the level of mutant mtDNA in human primary oocytes. Am. J. Hum. Genet. 2001;68:533–536. doi: 10.1086/318190. [DOI] [PMC free article] [PubMed] [Google Scholar]
- 11.Taylor R.W., Turnbull D.M. Mitochondrial DNA mutations in human disease. Nat. Rev. Genet. 2005;6:389–402. doi: 10.1038/nrg1606. [DOI] [PMC free article] [PubMed] [Google Scholar]
- 12.He Y., Wu J., Dressman D.C., Iacobuzio-Donahue C., Markowitz S.D., Velculescu V.E., Diaz L.A., Jr, Kinzler K.W., Vogelstein B., Papadopoulos N. Heteroplasmic mitochondrial DNA mutations in normal and tumour cells. Nature. 2010;464:610–614. doi: 10.1038/nature08802. [DOI] [PMC free article] [PubMed] [Google Scholar]
- 13.Rahman S., Poulton J., Marchington D., Suomalainen A. Decrease of 3243 A–>G mtDNA mutation from blood in MELAS syndrome: A longitudinal study. Am. J. Hum. Genet. 2001;68:238–240. doi: 10.1086/316930. [DOI] [PMC free article] [PubMed] [Google Scholar]
- 14.Rajasimha H.K., Chinnery P.F., Samuels D.C. Selection against pathogenic mtDNA mutations in a stem cell population leads to the loss of the 3243A–>G mutation in blood. Am. J. Hum. Genet. 2008;82:333–343. doi: 10.1016/j.ajhg.2007.10.007. [DOI] [PMC free article] [PubMed] [Google Scholar]
- 15.Cortopassi G.A., Shibata D., Soong N.W., Arnheim N. A pattern of accumulation of a somatic deletion of mitochondrial DNA in aging human tissues. Proc. Natl Acad. Sci. USA. 1992;89:7370–7374. doi: 10.1073/pnas.89.16.7370. [DOI] [PMC free article] [PubMed] [Google Scholar]
- 16.Corral-Debrinski M., Horton T., Lott M.T., Shoffner J.M., Beal M.F., Wallace D.C. Mitochondrial DNA deletions in human brain: regional variability and increase with advanced age. Nat. Genet. 1992;2:324–329. doi: 10.1038/ng1292-324. [DOI] [PubMed] [Google Scholar]
- 17.Michikawa Y., Mazzucchelli F., Bresolin N., Scarlato G., Attardi G. Aging-dependent large accumulation of point mutations in the human mtDNA control region for replication. Science. 1999;286:774–779. doi: 10.1126/science.286.5440.774. [DOI] [PubMed] [Google Scholar]
- 18.Wang Y., Michikawa Y., Mallidis C., Bai Y., Woodhouse L., Yarasheski K.E., Miller C.A., Askanas V., Engel W.K., Bhasin S., et al. Muscle-specific mutations accumulate with aging in critical human mtDNA control sites for replication. Proc. Natl Acad. Sci. USA. 2001;98:4022–4027. doi: 10.1073/pnas.061013598. [DOI] [PMC free article] [PubMed] [Google Scholar]
- 19.da Costa C.K., Kiyomoto B.H., Schmidt B., Oliveira A.S., Gabbai A.A., Tengan C.H. Age-related mitochondrial DNA point mutations in patients with mitochondrial myopathy. J. Neurol. Sci. 2007;263:139–144. doi: 10.1016/j.jns.2007.07.006. [DOI] [PubMed] [Google Scholar]
- 20.Del Bo R., Bordoni A., Martinelli Boneschi F., Crimi M., Sciacco M., Bresolin N., Scarlato G., Comi G.P. Evidence and age-related distribution of mtDNA D-loop point mutations in skeletal muscle from healthy subjects and mitochondrial patients. J. Neurol. Sci. 2002;202:85–91. doi: 10.1016/s0022-510x(02)00247-2. [DOI] [PubMed] [Google Scholar]
- 21.Cormio A., Milella F., Vecchiet J., Felzani G., Gadaleta M.N., Cantatore P. Mitochondrial DNA mutations in RRF of healthy subjects of different age. Neurobiol. Aging. 2005;26:655–664. doi: 10.1016/j.neurobiolaging.2004.06.014. [DOI] [PubMed] [Google Scholar]
- 22.Iwata N., Zhang J., Atzmon G., Leanza S., Cho J., Chomyn A., Burk R.D., Barzilai N., Attardi G. Aging-related occurrence in Ashkenazi Jews of leukocyte heteroplasmic mtDNA mutation adjacent to replication origin frequently remodeled in Italian centenarians. Mitochondrion. 2007;7:267–272. doi: 10.1016/j.mito.2007.03.001. [DOI] [PubMed] [Google Scholar]
- 23.Rose G., Passarino G., Scornaienchi V., Romeo G., Dato S., Bellizzi D., Mari V., Feraco E., Maletta R., Bruni A., et al. The mitochondrial DNA control region shows genetically correlated levels of heteroplasmy in leukocytes of centenarians and their offspring. BMC Genomics. 2007;8:293. doi: 10.1186/1471-2164-8-293. [DOI] [PMC free article] [PubMed] [Google Scholar]
- 24.Pallotti F., Chen X., Bonilla E., Schon E.A. Evidence that specific mtDNA point mutations may not accumulate in skeletal muscle during normal human aging. Am. J. Hum. Genet. 1996;59:591–602. [PMC free article] [PubMed] [Google Scholar]
- 25.Greaves L.C., Beadle N.E., Taylor G.A., Commane D., Mathers J.C., Khrapko K., Turnbull D.M. Quantification of mitochondrial DNA mutation load. Aging Cell. 2009;8:566–572. doi: 10.1111/j.1474-9726.2009.00505.x. [DOI] [PMC free article] [PubMed] [Google Scholar]
- 26.Harman D. The biologic clock: the mitochondria? J. Am. Geriatr. Soc. 1972;20:145–147. doi: 10.1111/j.1532-5415.1972.tb00787.x. [DOI] [PubMed] [Google Scholar]
- 27.Trifunovic A., Wredenberg A., Falkenberg M., Spelbrink J.N., Rovio A.T., Bruder C.E., Bohlooly Y M., Gidlof S., Oldfors A., Wibom R., et al. Premature ageing in mice expressing defective mitochondrial DNA polymerase. Nature. 2004;429:417–423. doi: 10.1038/nature02517. [DOI] [PubMed] [Google Scholar]
- 28.Kujoth G.C., Hiona A., Pugh T.D., Someya S., Panzer K., Wohlgemuth S.E., Hofer T., Seo A.Y., Sullivan R., Jobling W.A., et al. Mitochondrial DNA mutations, oxidative stress, and apoptosis in mammalian aging. Science. 2005;309:481–484. doi: 10.1126/science.1112125. [DOI] [PubMed] [Google Scholar]
- 29.Singh R., Ellard S., Hattersley A., Harries L.W. Rapid and sensitive real-time polymerase chain reaction method for detection and quantification of 3243A>G mitochondrial point mutation. J. Mol. Diagn. 2006;8:225–230. doi: 10.2353/jmoldx.2006.050067. [DOI] [PMC free article] [PubMed] [Google Scholar]
- 30.Chinault A.C., Shaw C.A., Brundage E.K., Tang L.Y., Wong L.J. Application of dual-genome oligonucleotide array-based comparative genomic hybridization to the molecular diagnosis of mitochondrial DNA deletion and depletion syndromes. Genet. Med. 2009;11:518–526. doi: 10.1097/GIM.0b013e3181abd83c. [DOI] [PubMed] [Google Scholar]
- 31.Elliott H.R., Samuels D.C., Eden J.A., Relton C.L., Chinnery P.F. Pathogenic mitochondrial DNA mutations are common in the general population. Am. J. Hum. Genet. 2008;83:254–260. doi: 10.1016/j.ajhg.2008.07.004. [DOI] [PMC free article] [PubMed] [Google Scholar]
- 32.Suissa S., Wang Z., Poole J., Wittkopp S., Feder J., Shutt T.E., Wallace D.C., Shadel G.S., Mishmar D. Ancient mtDNA genetic variants modulate mtDNA transcription and replication. PLoS Genet. 2009;5:e1000474. doi: 10.1371/journal.pgen.1000474. [DOI] [PMC free article] [PubMed] [Google Scholar]
- 33.Zhang R., Zhu Z., Zhu H., Nguyen T., Yao F., Xia K., Liang D., Liu C. SNP cutter: a comprehensive tool for SNP PCR-RFLP assay design. Nucleic Acids Res. 2005;33:W489–W492. doi: 10.1093/nar/gki358. [DOI] [PMC free article] [PubMed] [Google Scholar]
- 34.Moraes C.T., Ricci E., Bonilla E., DiMauro S., Schon E.A. The mitochondrial tRNA(leu(UUR)) mutation in mitochondrial encephalomyopathy, lactic acidosis, and strokelike episodes (MELAS): genetic, biochemical, and morphological correlations in skeletal muscle. Am. J. Hum. Genet. 1992;50:934–949. [PMC free article] [PubMed] [Google Scholar]
Associated Data
This section collects any data citations, data availability statements, or supplementary materials included in this article.