

Abstract
Renal excretion of citrate, an inhibitor of calcium stone formation, is controlled mainly by reabsorption via the apical Na+-dicarboxylate cotransporter NaDC1 (SLC13A2) in the proximal tubule. Recently, it has been shown that the protein phosphatase calcineurin inhibitors cyclosporin A (CsA) and FK-506 induce hypocitraturia, a risk factor for nephrolithiasis in kidney transplant patients, but apparently through urine acidification. This suggests that these agents up-regulate NaDC1 activity. Using the Xenopus lævis oocyte and HEK293 cell expression systems, we examined first the effect of both anti-calcineurins on NaDC1 activity and expression. While FK-506 had no effect, CsA reduced NaDC1-mediated citrate transport by lowering heterologous carrier expression (as well as endogenous carrier expression in HEK293 cells), indicating that calcineurin is not involved. Given that CsA also binds specifically to cyclophilins, we determined next whether such proteins could account for the observed changes by examining the effect of selected cyclophilin wild types and mutants on NaDC1 activity and cyclophilin-specific siRNA. Interestingly, our data show that the cyclophilin isoform B is likely responsible for down-regulation of carrier expression by CsA and that it does so via its chaperone activity on NaDC1 (by direct interaction) rather than its rotamase activity. We have thus identified for the first time a regulatory partner for NaDC1, and have gained novel mechanistic insight into the effect of CsA on renal citrate transport and kidney stone disease, as well as into the regulation of membrane transporters in general.
Keywords: Anion Transport, Chaperone Chaperonin, Kidney, Membrane Proteins, Prolyl Isomerase, Protein-Protein Interactions, Sodium Transport, Trafficking
Introduction
The Na+-dicarboxylate cotransporter isoform 1 (NaDC1 or SLC13A2)2 plays a crucial role in renal citrate handling (1). In the kidney, NaDC1 is distributed on the apical side of proximal tubular cells, where it reabsorbs divalent citrate (citrate2−) that exists at ∼10% of the free plasma citrate at physiological pH. However, the availability of citrate2− increases as pH lowers, due to protonation of citrate3−, thereby increasing the activity of NaDC1.
Renal citrate excretion depends on the tubular reabsorption rate of citrate almost exclusively accomplished via NaDC1 (1). Urinary citrate plays a crucial physiological role in the prevention of nephrolithiasis by complexing Ca2+ ions, implying that NaDC1 also plays a crucial pathophysiological role (2–4). Consistent with this, NaDC1 gene-depleted mice develop hypercitraturia (5). However, the molecular mechanisms underlying NaDC1 regulation are poorly understood. Nevertheless, some insights have been gained from studies about the regulation of NaDC1 in metabolic acidosis and alkalosis. In metabolic acidosis, the function and expression of NaDC1 is up-regulated, leading to hypocitraturia, whereas in metabolic alkalosis, NaDC1 function is suppressed (6–7). Moreover, immunosuppressive therapy using the drugs cyclosporin A (CsA) and FK-506 has been associated with hypocitraturia as a nephrolithiasis risk factor (8). Metabolic acidosis (caused by renal tubular acidosis) is one of the major nephrotoxic complications of these medications (9–10). In summary, tight regulation of NaDC1 transcription, synthesis, maturation, trafficking, and activity in the kidney is crucial for citraturia regulation. Identification of proteins that regulate NaDC1 will shed further light on the physiology of urinary citrate excretion.
Recent observations with CsA and FK-506, which exert their normal effects by indirectly inhibiting the protein phosphatase calcineurin, suggested to us that the CsA-sensitive cyclophilins might be implicated in NaDC1 regulation. First, FK-506, which binds and specifically inhibits the function of FK-506-binding proteins, has been found to inhibit the stimulation of NaDC1 activity by metabolic acidosis in vivo in mice without affecting the basal activity (11). Secondly, during functional screening of potential regulatory proteins using various inhibitors, we found that CsA caused marked inhibition of the basal activity of NaDC1 expressed in X. laevis oocytes, whereas FK-506 had no effect.3 CsA is known to specifically bind and inhibit the function of cyclophilins. Finally, the specific effect of CsA on other transporters such as the taurine and creatine transporters has been reported to be due to down-regulation of cell surface protein expression via the blockade of cyclophilin activity (12–17).
Typically, cyclophilins catalyze the rate-limiting peptidyl-prolyl cis/trans isomerization (also called rotamase activity) necessary for proper protein folding (18). In addition, they play a role as chaperones, escorting associated substrates during macromolecular assembly, intracellular trafficking and/or nuclear translocation (19–20). There are more than ten cyclophilin paralogs in mammals, distributed in different subcellular compartments where they play a role in diverse biological processes such as immune responses and neuronal function (18). The cytosolic cyclophilin A (CypA), the archetypal cyclophilin, is the most abundant paralog in human tissues and the major target for CsA. The ER-resident cyclophilin B (CypB), the second member of the family, is also abundantly expressed and differs from CypA by the presence of an endoplasmic reticulum (ER) retention motif (AIAKE) in its C terminus that allows its targeting to the secretory pathway (21–22). With respect to the latter, the prototype cyclophilin chaperone is the CypB ortholog Drosophila ninaA. It has been shown to be essential in the secretory pathway of the major rhodopsin, Rh1, of Drosophila photoreceptor cells (19, 23).
In this study, we assessed whether the CsA-sensitive cyclophilins regulate the expression and/or function of NaDC1. We carried out immunohistochemical, biochemical and functional analyses in X. laevis oocyte and HEK293 cell expression systems. We found that CsA reduced NaDC1 function through alteration of its total expression, caused by the inhibition of its synthesis, maturation and trafficking to the plasma membrane. Finally, we found that the effect of CsA on NaDC1 was due to the blockade of cyclophilin B chaperone activity.
EXPERIMENTAL PROCEDURES
cDNA Constructs
Nine different cDNA constructs were used in this study. The vectors Pol1 and pNWP were used for protein expression in X. laevis oocytes, whereas the vector pcDNA3.1 (+) (Invitrogen) was used for protein expression in HEK293 cells.
The wt human (hu) NaDC1 cDNA was cloned by PCR reaction from a human kidney cDNA library and inserted into the Pol1 vector.4 The huNaDC1 FLAG N-ter/Pol1 construct was generated by the N-terminal insertion of a prehybridized complementary oligonucleotide fragment possessing cohesive compatible ends and encoding the FLAG tag (supplemental Table S1), into a digested wt huNaDC1/Pol1 fragment.
The wt and mutant huCyP cDNAs4 were subcloned into the Pol1 vector, in which the HA tag was added in the multiple cloning site to generate C-terminally HA-tagged proteins. The mutant huCypBΔC-ter(204–208) was generated by the insertion of a prehybridized complementary oligonucleotide fragment, which possesses cohesive compatible ends and in which the 15 nucleotides encoding the C-terminal ER retention sequence AIAKE (corresponding to the amino acids 204 to 208) have been deleted (supplemental Table S1), into a digested wt huCypB fragment. The mutant huCypBΔN-ter(26–38) lacks the N-terminal sequence DEKKKGPKVTVKV (corresponding to the amino acids 26 to 38), which contains the nuclear translocation signal (20), while the mutant huCypBR87A,F92A contains the mutations R87A and F92A that generates a rotamase-inactive cyclophilin B (20).
Protein Expression in X. laevis Oocytes and HEK293 Cells
Defolliculated stage V-VI oocytes were micro-injected with ∼10 ng of each cDNA-derived cRNA, and maintained for 72 h at 18 °C in modified Barth's medium (MBM; see supplemental Table S2) + antibiotics. In co-injection studies, a total amount of ∼20 ng of cRNA was micro-injected.
HEK293 cells were grown on poly-d-lysine coated six-well plates or coverslips, and maintained in DMEM medium (Invitrogen) supplemented with 10% fetal bovine serum and 100 units/ml penicillin/streptomycin mixtures (Invitrogen). Cells were propagated at 37 °C in a humidified atmosphere of 95% air and 5% CO2. At the time of transfection, the cells were transiently transfected with 3 μg of wt huNaDC1 cDNA using Lipofectamine 2,000 and OPTI-MEM (Invitrogen) and incubated for 48 h. In siRNA experiments, 250 pmol of either huCypB siRNA (pool of 3 target-specific 20–25 nt siRNAs) or control scrambled siRNA (5′-aatcatctaagctggctttgc-3′) were transiently co-transfected simultaneously with huNaDC1.
Various Treatments in Oocytes and HEK293 Cells
In this study, “24 h” and “72 h” are used to mean that the oocytes were treated with CsA and FK-506 (Sigma), and salubrinal (Tocris Bioscience) for the last 24 h of the 72 h incubation or for the entire time, respectively. HEK293 cells were treated with CsA during the last 24 h of the 48 h total transfection. DMSO (Sigma) was used as control treatment.
Cell Viability Experiments
Oocytes were incubated and treated with CsA for 72 h in 96-well plates (one oocyte per well). The viability has been determined with the XTT cell proliferation kit II (Roche), which is based on chemical reactions that lead to the formation of an orange dye by metabolically active cells, according to the supplier protocol.
Influx Studies
Uptakes were carried out at room temperature during 45 min (oocytes) or 10 min (HEK293 cells) in regular flux medium (R medium; see supplemental Table S2) + 2 mm cold citric acid + ∼2 μm [1,5-14C]citric acid (GE Healthcare). Uptakes were ended with three rinses in ice-cold R medium. Oocytes and HEK293 cells were lysed in 10% SDS and NaOH (0.5 n), respectively. After addition of scintillation fluid and brief stabilization time, [1,5-14C]citric acid was detected with the TRI-CARB 2100TR Liquid Scintillation Analyzer (Packard).
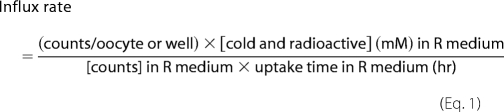
For each experiment, counts from 5 to 12 oocytes, assuming equal membrane surface area of stage V-VI oocytes, or counts from one well of HEK293 cells, for which the protein concentration was determined, were averaged, transposed into influx rate, normalized to a control, and expressed as % ± S.E. in Equation 1.
 |
Cell Surface Biotinylation Studies
Twenty intact oocytes or one well of HEK293 cells were incubated (1 h, 4 °C) with 1.5 mg/ml of sulfo-LC-NHS-(+)-Biotin (Pierce) and lysed in 1 ml of RIPA solution (see supplemental Table S2) + Complete® protease inhibitor mixture (Roche). After incubation (2 h; 4 °C) and centrifugation at 18,000g (15 min; 4 °C), supernatants were transferred into new tubes. Cell surface biotinylated-proteins were purified by addition of 50 μl (oocytes) or 75 μl (HEK293 cells) of streptavidin agarose beads (Pierce), incubation on a rotator (overnight; 4 °C), washing and recovery of the beads by centrifugation at 9,000 × g (1 min; 4 °C). Finally, proteins were released from the beads by boiling in 2× sample buffer, and subjected to SDS-PAGE and Western analyses (described below).
Co-immunoprecipitation Studies
Twenty intact oocytes were lysed in 1 ml TBS + 1% Triton X-100 + 2 mm CaCl2 + Complete®. After incubation (2 h; 4 °C) and centrifugation at 18,000 × g (15 min; 4 °C), supernatants were transferred into new tubes. CypB, NaDC1 and TRPV6 proteins were immunoprecipitated using 2 μl/tube of rabbit polyclonal anti-HA (Sigma), anti-FLAG (Sigma) and anti-huTRPV6 (Alomone Laboratories) antibodies, respectively. After incubation on a rotator (2 h; 4 °C), 30 μl of protein A Sepharose CL-4B (GE Healthcare) was added to the samples, which were further incubated on a rotator (overnight; 4 °C). After washing and recovery of the beads by centrifugation at 9,000 × g (1 min; 4 °C), proteins were released from the beads by boiling in 2× sample buffer, and subjected to SDS-PAGE and Western analyses (described below).
Western Blot Analyses
Proteins were migrated on 9% Tris-Tricine SDS-polyacrylamide gels, and transferred onto Immobilon-P membrane blots (Millipore). After sequential incubations of the blots with primary and secondary antibodies, proteins were revealed by chemiluminescence using ECL solution (GE Healthcare). The primary antibodies mouse polyclonal anti-SLC13A2 (Abnova), rabbit polyclonal anti-cyclophilin B (Pierce), mouse monoclonal anti-HA (Sigma) and rabbit polyclonal anti-actin (I-19; Santa Cruz Biotechnology) were used at a dilution of 1/1,000. The secondary antibodies were used at a dilution of 1/4,000 for the horseradish peroxidase (HRP)-conjugated goat anti-mouse anti-IgG (Bio-Rad), and 1/20,000 for the HRP-conjugated goat anti-rabbit anti-IgG (Promega).
Immunofluorescence Studies
Oocytes were fixed with 4% paraformaldehyde (20 min, room temperature), permeabilized with 0.3% Triton X-100 (5 min; room temperature), and sequentially incubated with mouse polyclonal anti-SLC13A2 antibodies (dil. 1/1,000; 1 h; room temperature) and Alexa Fluor® 594-conjugated goat anti-mouse anti-IgG antibodies (Invitrogen) (dil. 1/4,000; 1 h; room temperature).
For the co-staining of NaDC1 with the cell surface marker biotin in NaDC1-expressing HEK293 cells, the cells were first sequentially incubated (15 min; 4 °C) with 0.1 mg/ml of sulfo-LC-NHS-(+)-Biotin and streptavidin Alexa Fluor® 488 conjugate (Invitrogen) (dil. 1/2,000; 10 min; 4 °C). Then, the cells were fixed with 4% paraformaldehyde (30 min; 37 °C), permeabilized with 0.05% Triton X-100 (5 min; 37 °C), and sequentially incubated with mouse polyclonal anti-SLC13A2 antibodies (dil. 1/1,000; 1 h; 37 °C) and Alexa Fluor® 594-conjugated goat anti-mouse anti-IgG antibodies (dil. 1/4,000; 1 h; 37 °C).
For the co-staining of NaDC1 with the ER marker calreticulin in huNaDC1-expressing HEK293 cells, the cells were first fixed and permeabilized as described above, and sequentially incubated with a mixture of mouse polyclonal anti-SLC13A2 antibodies (dil. 1/1,000) and chicken polyclonal anti-calreticulin antibodies (Abcam) (dil. 1/1,000; 1 h; 37 °C) and a mixture of Alexa Fluor® 594-conjugated goat anti-mouse anti-IgG and Alexa Fluor® 488-conjugated goat anti-chicken anti-IgG antibodies (Invitrogen) (dil. 1/4,000; 1 h; 37 °C). Images were taken with a Nikon C1 confocal laser microscope system.
Metabolic Labeling Studies
In all metabolic labeling steps, DMSO or 50 μm CsA were present in the MBM medium. After micro-injection and incubation in MBM medium (2 h; 18 °C), ten oocytes/experiment were metabolically labeled (1 h; 18 °C) in MBM medium + 0.5 mCi/ml EasyTagTM EXPRE35S35S protein labeling Mix (Perkin Elmer). After washing, oocytes were incubated (72 h; 18 °C) in MBM medium containing nonradioactive Met (5 mm) and Cys (2 mm). Time 0 h was used as control.
Oocytes were lysed in 200 μl of RIPA + Complete® and incubated on a rotator (2 h; 4 °C). Then, NaDC1 proteins were immunoprecipitated using 1 μl/tube of mouse polyclonal anti-SLC13A2 antibodies, purified, released from the beads, and subjected to SDS-PAGE as previously described. Gels were dried, and subjected to Coomassie Blue staining and autoradiography.
Subcellular Fractionation
Non-transfected cells (grown in 100-mm dish) were non- or treated with 200 ng/ml brefeldin A (Sigma) for 24 h, resuspended into PBS and centrifuged at 400 × g (10 min; 4 °C). Cells were then lysed in 1 ml of homogenization buffer (5 mm Hepes pH 7.4 and 0.5 mm EGTA) + Complete® and centrifuged at 3,000 × g (10 min; 4 °C). 1 mg of protein-containing supernatant was loaded onto the top of a linear sucrose gradient (0.45–2 m in homogenization buffer). After ultra-centrifugation at 200,000 × g (18 h; 4 °C), 750 μl fractions were collected from the top to the bottom of the gradient and concentrated by TCA/acetone precipitation. Equal amounts of each fraction were separated by SDS-PAGE and subjected to Western analyses.
Software and Statistical Analyses
The programs PLOT (B. Forbush) and DNAStar (Lasergene) were used. Where appropriate, differences between groups of variables were analyzed by Student's two-tail t-tests, rejecting the null hypothesis for p > 0.05.
RESULTS
The Effect of CsA on NaDC1 Is Not Due to Apoptosis Mechanisms
As mentioned earlier, our preliminary data revealed that NaDC1 activity in oocytes is markedly affected by CsA. However, because CsA is toxic at high doses, we examined the viability of NaDC1-expressing oocytes following 72 h CsA treatment. We used the XTT colorimetric viability assay, which is widely used to test toxicity in mammalian cell lines (24). However, the assay has not previously been reported for the analysis of X. laevis oocyte viability, so we first evaluated its validity, based on the necrotic morphology of non-injected oocytes (supplemental Fig. S1). The results revealed a nice correlation between morphology and viability. Fig. 1A shows that the viability of oocytes expressing NaDC1 was not affected by CsA, demonstrating that they were not under apoptosis after CsA treatment.
FIGURE 1.

CsA and apoptosis mechanisms. A, treatment with 50 μm CsA did not affect the viability of NaDC1-expressing oocytes. B, treatment with 100 μm salubrinal had no effect on NaDC1 function and could not prevent inhibition of NaDC1 activity by 50 μm CsA (salubrinal+CsA). Data were normalized to values obtained with control treatment, expressed as %, and shown as averages (± S.E.) of 3–5 experiments. *, significant difference from control (p < 0.05).
Excessive ER stress can also lead to apoptosis due to accumulation of unfolded protein in the ER. Previous reports showed that CsA-triggered ER stress in human endothelial and renal tubular cells could be prevented by salubrinal, a compound that protects cells from ER stress by selectively inhibiting the translation initiation factor eIF2α dephosphorylation (25–28). Fig. 1B shows that salubrinal treatment for 72 h had no effect on NaDC1 activity, and that salubrinal could not prevent the inhibitory effect of CsA (salubrinal+CsA). Thus, the effect of CsA on NaDC1 function does not occur via ER stress mechanisms.
CsA Reduces NaDC1 Activity
From the above studies, we concluded that the effect of CsA on NaDC1 must either be due to the direct blockade of calcineurin or cyclophilins activity. Thus, we further characterized CsA-sensitive NaDC1 activity in NaDC1-expressing oocytes, alongside FK-506 treatment.
Fig. 2A shows that NaDC1-injected oocytes exhibit a 5-fold higher citrate transport activity than non-injected oocytes (∼20% activity) after 72 h treatment with the control DMSO. Results also show that the citrate influx in non-injected oocytes was unchanged following 72 h treatment with CsA or FK-506. For this reason, the endogenous influx is not presented in the following figures, since we assume that it accounts for less than ∼20% of NaDC1-injected oocyte citrate uptakes.
FIGURE 2.

Effect of CsA and FK-506 on NaDC1 function. A, NaDC1-injected oocytes exhibited 5-fold higher activity than non-injected oocytes. CsA and FK-506 had no effect on non-injected oocytes. B, CsA had a dose-dependent effect on NaDC1 function, with more than 1 μm CsA required to inhibit NaDC1 activity. FK-506 had no effect. C, treatment for 72 h with CsA reduced NaDC1 function independently of the presence or absence of CsA during 45-min uptakes. Presence of CsA only during 45-min uptakes had no effect. +, with CsA; −, without CsA. D, CsA also had a time-dependent effect on NaDC1 function. More than 6 h treatment was required to inhibit NaDC1 activity. E, CsA had a dose-dependent effect on NaDC1-transfected HEK293 cells citrate influx, with more than 0.1 μm CsA required to inhibit NaDC1 activity. CsA had no effect on non-transfected cell citrate influx. Data were normalized to values obtained with non-treated NaDC1-expressing oocytes or NaDC1-transfected cells, expressed as %, and shown as averages (± S.E.) of 3–11 experiments. In B, 24 h and 72 h treatments with 10, 25, and 50 μm CsA are statistically different from the respective control (p < 0.05). **, significant difference between 24 h and 72 h treatments with 50 μm CsA (p < 0.001). In C, *, significant difference from control (p < 0.05). In D, all averages are statistically different from control except that at 6 h (p < 0.05). In E, **, significant difference from NaDC1-transfected cell citrate influx control (p < 0.001).
In Fig. 2B, the activity of NaDC1-expressing oocytes was determined after 24 h and 72 h treatment with CsA or FK-506, and in their presence during 45-min uptakes. Results show that the treatments with CsA had a concentration-dependent inhibitory effect on NaDC1 activity and that the inhibition with the highest dose of CsA (50 μm) was statistically different between the 24 h and 72 h treatments. However, 1 μm CsA had no effect on NaDC1 function, suggesting that calcineurin, which is inhibited by nanomolar amounts of CsA, is not involved. In contrast to CsA, the treatments with FK-506 had no effect on NaDC1 activity, indicating that the inhibition of NaDC1 function is specific to CsA. We used a concentration of only 5 μm for FK-506 compared with 50 μm for CsA because (a) FK-506 exhibits similar effects in vitro at concentrations even 100 times lower than those of CsA (29), and (b) high doses of FK-506 are toxic to oocytes (16).
To confirm that the observed effects with CsA were not due to the inhibition of calcineurin or to conformational changes in NaDC1 caused by the direct binding of CsA, we performed 45-min influx assays in the absence of CsA in the uptake medium. We observed that the function of NaDC1 was altered only when NaDC1-expressing oocytes were treated for 72 h with CsA, independently of the presence of CsA in the uptake medium during the 45 min (Fig. 2C). This suggests that the specific effect of CsA on NaDC1 function likely occurs during NaDC1 synthesis, maturation and/or trafficking, and is not due to the inhibition of calcineurin or conformational changes in NaDC1.
Fig. 2D shows that the effect of the CsA treatment on NaDC1 function is time-dependent. Interestingly, between 6 and 8 h of treatment, we observed a drastic decrease (∼25%) in NaDC1 activity, suggesting that the expression of NaDC1 is regulated tightly and quickly during this time window.
We also examined the effect of CsA on citrate transport activity in control (non-transfected) and NaDC1-transfected HEK293 cells (Fig. 2E). As in oocytes, treatments with CsA had a concentration-dependent inhibitory effect on the activity of heterologously expressed NaDC1, while low CsA concentration (0.1 μm) had no effect, suggesting that the molecular mechanism responsible of the CsA effect is identical in oocytes and HEK293 cells. In contrast to NaDC1-transfected cells, treatment with 10 μm CsA of non-transfected cells failed to produce an inhibitory effect. Note that in these experiments, it was not possible to discriminate the active fraction of endogenous NaDC1 from that of other endogenous proteins promoting citrate uptake, because of the lack of specific inhibitors.
CsA Reduces Total Expression of NaDC1
The specificity of the mouse polyclonal anti-SLC13A2 antibodies was verified by Western blot (Fig. 3A; lanes 1 and 2) and immunofluorescence (supplemental Fig. S2; images 1, 2) analysis of non- and NaDC1-injected oocytes. The controls also demonstrated that the immunoreactive bands with an apparent molecular mass ranging from ∼60 to ∼75 kDa correspond to the heterogeneously mature NaDC1 forms expressed at the cell surface, whereas the 50-kDa band in total lysates represents the immature form synthesized in the ER. Similar results were previously reported (30). Given that NaDC1 is functional in oocytes (Fig. 2, A–D) and its expression at the cell surface (mature form) and in total lysate (immature form) is regulatable (see below), the expression levels of the mature and immature NaDC1 forms were analyzed separately through Western analyses of purified cell surface biotinylated proteins and total lysates, respectively.
FIGURE 3.

Effect of CsA on NaDC1 expression. A and B, Western blot analysis: heterogeneously glycosylated NaDC1 forms have an apparent molecular mass ranging from ∼60 to ∼75 kDa, the immature NaDC1 form 50 kDa. Treatment with 50 μm CsA for 24 h and 72 h reduced cell surface expression of NaDC1, total expression (immature form) was only reduced by 72 h treatment. Treatment with 5 μm FK-506 had no effect. Data were normalized to control values and expressed as %. C, two metabolic labeling experiments with [35S]Met/Cys: 50 μm CsA treatment for 72 h reduced total newly synthesized NaDC1 proteins by ∼80%. Data were normalized to values obtained with the same treatment at 0 h and expressed as %. Dashed line: controls at 100%. D and E, Western blot analysis: 10 μm CsA treatment for 24 h almost completely abrogated cell surface and total NaDC1 expression in non- and NaDC1-transfected HEK293 cells. As with oocytes, only the 50 kDa band density was measured to determine total expression. Data were normalized to values obtained with non-treated NaDC1-transfected cells and expressed as %. In B and E, data are shown as averages (± S.E.) of 3–5 experiments. To average the total expression, data were first normalized to the actin values. In B, all treatments with CsA are statistically different from control (p < 0.05), except the 24 h treatment (total). * and **, significant difference between 24 h and 72 h treatments with CsA (p < 0.05 and 0.001, respectively). In E, all treatments with CsA are statistically different from control (p < 0.05).
We first analyzed the total NaDC1 expression of NaDC1-expressing oocytes following 24 h or 72 h treatment with CsA and FK-506 (Fig. 3, A and B). Western blot analysis of cell surface and total lysate showed no effect of FK-506. Furthermore, these experiments revealed that CsA treatment for 24 h reduced the amount of NaDC1 expressed at the plasma membrane, but not the amount of the immature protein in the total lysate. CsA treatment for 72 h significantly reduced the expression of both mature and immature forms compared with the treatment for 24 h. These results suggest that CsA affects NaDC1 total expression through two distinct molecular mechanisms: (a) cytosolic trafficking and (b) regulation of the synthesis in the ER. Thus, the 24 h treatment only affects trafficking, whereas the 72 h treatment affects both trafficking and synthesis in the ER. Results of immunofluorescence examination of NaDC1 at the plasma membrane were consistent with the cell surface biotinylation analysis (supplemental Fig. S2).
To gain more information on the inhibitory effect of CsA on NaDC1 total expression, we evaluated the amount of newly synthesized, [35S]Met/Cys-labeled NaDC1 total proteins in oocytes after 72 h treatment with CsA. Fig. 3C shows, through two representative experiments, that CsA greatly reduced (∼80%) the amount of labeled NaDC1 total proteins and thus does affect NaDC1 synthesis.
To corroborate the results from NaDC1 total expression in oocytes, we examined the effect of 24 h CsA treatment on control (non-transfected) and NaDC1-transfected HEK293 cells. Indeed, we observed an almost complete abrogation of NaDC1 total expression with CsA in both control and NaDC1-transfected cells (Fig. 3, D and E), suggesting that the effect of CsA on synthesis, maturation and trafficking of NaDC1 in oocytes and HEK293 cells (including endogenous NaDC1) occurred through the same pathway, involving the cyclophilins.
CsA Affects NaDC1 Plasma Membrane Distribution
The distribution of NaDC1 expressed in HEK293 cells was studied using immunofluorescence. In non-treated cells, immunostaining (red) showed that NaDC1 localizes at or near the plasma membrane (Fig. 4A, images 1, 4). This was confirmed by co-localization studies, which showed that NaDC1 staining co-localized with biotin-labeled plasma membrane staining (green) (Fig. 4A, images 2, 3), but not with the ER-marker calreticulin staining (green) (Fig. 4A, images 5, 6). Note that in images 2 and 3, some of the NaDC1 staining did not co-localize because biotin did not penetrate between the cell monolayers when using our staining procedures. The white arrows in images 4 to 6 point to NaDC1 staining and distribution in cell ramifications, providing further evidence of plasma membrane distribution.
FIGURE 4.

Immunofluorescence studies in HEK293 cells. NaDC1-expressing HEK293 cells were not treated (A, −CsA) or treated with 10 μm CsA (B, +CsA) for 24 h. NaDC1 (red) was co-stained with the cell surface marker biotin (green; images 1–3 and 7–9) or the ER marker calreticulin (green; images 4–6 and 10–12). NaDC1 co-localized with biotin at the cell surface in non-treated cells (images 2, 3) but not after CsA treatment (images 8, 9). NaDC1 did not co-localize with calreticulin in non-treated cells (images 5, 6) or after CsA treatment (images 11, 12). Shown are representative 80× (no treatment) or 60× (CsA treatment) images. Scale bars: 20 μm.
In contrast to non-treated cells, NaDC1 was not detected in ∼98% of cells treated with CsA, indicating that CsA completely abolished NaDC1 expression. The ∼2% of CsA-treated cells (Fig. 4B) where NaDC1 was detected were probably more CsA-resistant. Intracellular NaDC1 staining could be seen (Fig. 4B, images 7, 10), but it did not co-localize at all with biotin staining (Fig. 4B, images 8, 9). While there was minimal co-localization with the ER-marker calreticulin in some cells (Fig. 4B, images 11, 12), the majority of NaDC1 staining failed to co-localize, suggesting that intracellular NaDC1 was not in the ER. These studies point toward the same conclusion as the cell surface biotinylation studies: CsA specifically inhibits the function of NaDC1 via a reduction in its cell surface expression. This is further evidence that cyclophilins may play an important role in NaDC1 synthesis, maturation, and trafficking.
Note that, for an unknown reason, cells did round up after CsA treatment in these experiments, while they appeared normal in other experiments (see supplemental Fig. S3). However, no correlation was seen between NaDC1 expression and cell morphology. It has been additionally reported that the morphology of the renal proximal tubule HK-2 cells is not affected by 10 μm CsA treatment for 24 h (31).
Cyclophilin B Increases NaDC1 Total Expression via Its Chaperone Activity in the Secretory Pathway
As the total expression of NaDC1 was affected by CsA, we tested the hypothesis that the inhibition of the ER-resident cyclophilin B is responsible for the CsA effect. To test that, and pin down the exact molecular mechanism involved, we studied NaDC1 expression and function in oocytes co-expressing NaDC1 and wt or mutant cyclophilin B alongside oocytes co-expressing NaDC1 and wt cyclophilin A (used as control oocytes). The mutant CypBR87A,F92A, which has lost rotamase binding sites (20) was used to test the cyclophilin B role as rotamase enzyme, while the mutant CypBΔC-ter(204–208), which has lost the ER retention motif, was used to verify the cyclophilin B role as chaperone in the secretory pathway. It should be noted that cyclophilin B is also known to possess a non-conventional role as a nuclear translocation escort to promote gene transcription that is due to the presence in its N terminus of a nuclear translocation signal (20). Therefore, we also tested this cyclophilin B role in NaDC1 regulation by co-expressing the mutant CypBΔN-ter(26–38) that has lost the nuclear translocation signal (20). However, this cyclophilin B function could not explain the inhibitory effect of CsA on NaDC1 total expression in oocytes because the effect was specific to heterologously expressed human NaDC1, therefore not an effect via Xenopus NaDC1 gene transcription (Fig. 3 and supplemental Fig. S2). For this reason, the mutant CypBΔN-ter(26–38) was used as a control.
Results of total expression analyses showed that the amount of immature NaDC1 remained unchanged in all co-injections (Fig. 5A). Interestingly, when we looked at the cell surface expression of NaDC1, we observed a different pattern (Fig. 5B). Expression was significantly increased in oocytes co-expressing NaDC1 and wt CypB, as well as in oocytes co-expressing NaDC1 and the mutant CypBR87A,F92A or CypBΔN-ter(26–38), when compared with control oocytes co-expressing NaDC1 and wt CypA. Surprisingly, we observed that cell surface NaDC1 expression in oocytes co-expressing NaDC1 and the mutant CypBΔC-ter(204–208), was similar to that observed in control oocytes co-expressing NaDC1 and wt CypA, and therefore lower compared with that observed in oocytes co-expressing NaDC1 and the other wt and mutant CypB. These findings suggest that cyclophilin B (via its ER retention motif) exerts a role as chaperone in the secretory pathway of NaDC1 and not as a rotamase enzyme or a nuclear translocation escort, thereby confirming that cyclophilin A has no effect. Moreover, a role of cyclophilin B as chaperone in the secretory pathway of NaDC1 rather than in nuclear translocation is supported by the slight increase in NaDC1 cell surface expression observed in oocytes co-expressing NaDC1 and the mutant CypBΔN-ter(26–38) compared with oocytes co-expressing NaDC1 and the other wt and mutant cyclophilins B. Here, the mutant does not move into the nucleus, since it does not have its nuclear translocation signals. Thus, it might be more available in the ER.
FIGURE 5.

Co-injection studies in oocytes. NaDC1 was injected with wt CypA (white bars), wt CypB (gray bars), or mutant CypB (black bars). CypB mutants: CypBR87A,F92A, enzymatically inactive; CypBΔN-ter(26–38), nuclear translocation signal depleted; CypBΔC-ter(204–208), ER retention sequence depleted. Western blot analysis: A, immature NaDC1 form expression remained unchanged in all co-injections. B, NaDC1 cell surface expression increased with CypB, CypBR87A,F92A, and CypBΔN-ter(26–38), compared with CypA and CypBΔC-ter(204–208). C, functional analysis showing perfect correlation between NaDC1 function and its cell surface expression. Data were normalized to values obtained with oocytes co-expressing NaDC1 and wt CypA, expressed as %, and shown as averages (± S.E.) of 4–11 experiments. To average the total expression, data were first normalized to the actin values. *, significant difference to NaDC1+CypA control (p < 0.05); NS, not statistically different between NaDC1+CypB and NaDC1+ CypBΔN-ter(26–38); §, significant difference between NaDC1+CypB and NaDC1+ CypBΔN-ter(26–38) (p < 0.05).
Finally, the NaDC1 total expression seems rate-limiting and tightly controlled, because we observed in all co-injection studies maintenance of the basal synthesis level of the immature NaDC1 forms, even in co-injection studies where the cell surface NaDC1 expression was stimulated (Fig. 5, A and B), suggesting that the synthesis of NaDC1 in the ER was also stimulated in these co-injections. Functional studies supported the results of the cell surface biotinylation studies. Fig. 5C shows a perfect correlation between NaDC1 function and cell surface expression.
Cyclophilin B Knockdown Reduces Total Expression and Function of NaDC1
Knockdown of CypB in NaDC1-expressing HEK293 cells using siRNA greatly reduced (∼85%) total NaDC1 expression (Fig. 6A). Although endogenous NaDC1 expression was not studied separately, we assume by comparison to the endogenous expression in Fig. 3D (non-transfected cells, control), that it was also abrogated by the CypB knockdown.
FIGURE 6.

Effect of cyclophilin B knockdown on NaDC1 expression and function. A, knockdown reduced total NaDC1 expression in NaDC1-transfected HEK293 cells by ∼85%. B, knockdown reduced citrate influx of NaDC1-transfected cells only. Inset, recombinant NaDC1 activity (black bars) and its CypB knockdown-sensitive fraction (dashed part; 40%). C, Western blot analysis showing the efficacy of CypB knockdown in HEK293 cells. Knockdown reduced CypB expression by ∼65%. Gray bars: CypB knockdown. Data were normalized to values obtained with NaDC1- and scrambled siRNA-transfected cells, expressed as %, and shown as averages (± S.E.) of 3–11 experiments. *, and **, significant difference to NaDC1- and scrambled siRNA-transfected cells (p < 0.05 and 0.001, respectively).
Functional studies on non- and NaDC1-transfected and CypB-knocked down cells showed that knockdown of CypB significantly inhibited the citrate influx of transfected but not non-transfected cells (Fig. 6B). The inset shows that the activity specific to recombinant NaDC1 accounts for ∼75% of the citrate influx of NaDC1-transfected cells (black bar), and that this activity is reduced by ∼40% by CypB knockdown (dashed bar). The efficacy of the siRNA approach was also tested by Western blot analysis. We found that the knockdown of CypB in NaDC1-expressing HEK293 cells reduced the expression of CypB protein by ∼65% (Fig. 6C).
CsA Induces Cyclophilin B Secretion into the Cell Culture Medium
In baby hamster kidney cells, CsA has been shown to promote the secretion of cyclophilin B into the cell culture medium (22). We verified whether CsA also induces cyclophilin B secretion in our heterologous expression systems. Surprisingly, treatment of oocytes for 24 h with 50 μm CsA induced a weak secretion of cyclophilin B into the oocyte MBM medium and this was associated with an intracellular up-regulation of cyclophilin B expression (Fig. 7A). In contrast, treatment of oocytes for 72 h with 50 μm CsA (Fig. 7B) or treatment of HEK293 cells for 24 h with 10 μm CsA (Fig. 7C), induced an even larger secretion of cyclophilin B into the cell culture medium and a decrease of intracellular cyclophilin B expression. This effect was corroborated by immunofluorescence studies in NaDC1-expressing HEK293 cells (supplemental Fig. S3). Moreover, we and others (32) observed that an anti-human CypB antibody also recognizes the Xenopus CypB (Fig. 7, A and B), consistent with the high similarity between CypB orthologs. Altogether, these findings suggest that inhibition of cyclophilin B via its secretion pathway in both oocytes and HEK293 cells may serve as the molecular mechanism that is responsible for the CsA effect on NaDC1.
FIGURE 7.

Effect of CsA on cyclophilin B expression and secretion. Treatment of oocytes with 50 μm CsA for 24 h induced a weak up-regulation of CypB expression to compensate the weak secretion of CypB into the oocyte culture medium. Treatment of oocytes with 50 μm CsA for 72 h and HEK293 cells with 10 μm CsA for 24 h induced the secretion of CypB into the cell culture medium, thereby decreasing intracellular CypB availability. Data were normalized to values obtained with intracellular CypB in non-treated oocytes or HEK293 cells, expressed as %, and shown as averages (± S.E.) of 6–10 experiments. * and **, significant difference to intracellular or extracellular controls (p < 0.05 and 0.001, respectively).
Cyclophilin B Co-localizes with NaDC1
To verify whether CypB co-localizes with NaDC1 upstream in the biosynthetic secretory pathway, we performed Western blot analyses of subcellular fractions using markers of the ER (protein-disulfide isomerase; PDI) and the cis-Golgi network (cis-Golgi matrix protein 130; GM130). Fig. 8A shows that, in particular in fractions 6 and 7, CypB co-localized with the immature NaDC1 form (50 kDa) in the ER (PDI), and to a lesser extent in the cis-Golgi network (GM130), where the protein maturation begins. Interestingly, in cells treated with brefeldin A, which inhibits the protein transport from the ER to the cis-Golgi network and therefore the protein maturation, the amount of immature NaDC1 increased in parallel with the amount of CypB, suggesting that the maturation of NaDC1 was blocked and also dependent on CypB. Thus, the results presented here suggest that CypB is necessary at least upstream in the biosynthetic-secretory pathway of NaDC1, i.e. from the ER. Note that no significant difference was observed for the subcellular localization of PDI and GM130 in brefeldin A-treated cells and that an increased amount of immature NaDC1 in total lysates of brefeldin A-treated, NaDC1-expressing oocytes has been observed (data not shown).
FIGURE 8.

Co-localization and co-immunoprecipitation of cyclophilin B with NaDC1. A, subcellular localization of CypB and NaDC1 in non-transfected HEK293 cells treated ± 200 ng/ml brefeldin A, Western analyses of the last seven fractions out of 10 (numbered 1–7), in which GM130 (cis-Golgi Matrix protein 130; cis-Golgi marker) and PDI (ER marker) were immunodetected. In non-treated cells, CypB co-localized with immature NaDC1 in the ER (fractions 6 and 7). In brefeldin A-treated cells, the expression of the immature NaDC1 form and CypB was increased in the ER (fractions 6 and 7). B, co-immunoprecipitation of CypB with NaDC1: HA-tagged CypB was co-injected with either FLAG-tagged NaDC1 or wt TRPV6 (positive control). Non-injected oocytes were used as negative control. NaDC1 and TRPV6 were immunoprecipitated (IP) with rabbit polyclonal anti-FLAG and chicken polyclonal anti-huTRPV6 antibodies, respectively. Western membranes were immunoblotted (IB) with the mouse monoclononal anti-HA. A CypB immunoreactive band (∼20 kDa) was detected in all co-immunoprecipitation studies.
Cyclophilin B Co-immunoprecipitates with NaDC1
Co-immunoprecipitation studies provided additional mechanistic insight that is in support of findings from the co-localization studies. Previous studies revealed a direct interaction between the epithelial Ca2+ channel TRPV6 and CypB (32). Here, we showed that CypB also co-immunoprecipitates with NaDC1, in analogy to TRPV6, since CypB was also detected when NaDC1 (or TRPV6) was immunoprecipitated with the corresponding antibodies (Fig. 8B). Thus, CypB directly interacts with NaDC1 and functions as a chaperone.
DISCUSSION
In the kidney, NaDC1 plays a central physiological role in the regulation of citrate excretion. Its activity is therefore closely related to the development of renal calculi. For example, in some patients receiving immunosuppressive therapy with CsA and FK-506 after kidney transplantation, hypocitraturia and renal calculi have been observed (8). However, the molecular mechanisms regulating NaDC1 are poorly understood. In this study, we focused on the effects of the immunosuppressive drugs CsA and FK-506 on NaDC1 total expression and/or function, and on CsA-sensitive proteins that could potentially regulate NaDC1.
To achieve this goal, we expressed NaDC1 in two heterologous expression systems to show that immunosuppressive drug-induced effects are mediated by identical molecular mechanisms that hold true for both non-mammalian and mammalian species and not due to cell-specific effects. Thus, we used the human HEK293 cells and the X. laevis oocytes, the latter being well-known to express functional mammalian transporters in the plasma membrane and to possess the Ca2+-calcineurin pathway intermediates and cofactors that are also found in mammalian cells (33–36).
When studying the expression of NaDC1, we found that the total expression pattern of NaDC1 in both expression systems was different. The primary band was the immature band in the oocytes whereas the mature band was more prominent in the HEK293 cells (Fig. 3, A and D), implying that post-translational modifications of NaDC1 differs between oocytes and HEK293 cells. In this work, we studied oocytes in which the maximal expression levels of mature NaDC1 were reached, i.e. 72 h after micro-injection of oocytes with 10 ng of NaDC1 cRNA (data not shown), but also the maximal amount of immature form. It appeared that the quantity of injected RNA or incubation times used post-injection was a problem (data not shown). However and importantly, NaDC1 was functional in oocytes and its total expression (mature and immature forms) was regulatable, suggesting that differences in post-translational modifications do not affect processing to a substantial degree and therefore that oocytes can be used in parallel to HEK293 cells to study the effect of the immunosuppressive drug CsA and FK-506.
CsA and FK-506 have a common therapeutic role in suppressing the immune system. By forming complexes with the immunophilins (CsA-cyclophilins and FK-506 drug-FK-506-binding proteins), they block the calcineurin activity and subsequent immune responses. Further functional studies showed that the inhibitory effect of CsA was not due to the blockade of calcineurin activity, pointing instead to the blockade of cyclophilin activity. This hypothesis was supported by the following observations: (a) treatment with 1 and 0.1 μm CsA (in oocytes and HEK293 cells respectively) did not affect NaDC1 function, although calcineurin activity is prevented by nanomolar amounts of CsA (16, 18), (b) treatment with 5 μm of the anti-calcineurin FK-506 did not affect the NaDC1-expressing oocytes activity, and (c) 45-min uptakes with influx medium supplemented with CsA did not affect NaDC1 activity, instead a minimum of 6 h CsA pre-treatment was necessary to observe an effect. This suggests that the down-regulation of NaDC1 is not due to dephosphorylation events because these are quick, post-translational modifications. Likewise, it can be assumed that the down-regulation is not due to conformational changes in NaDC1, or allosteric effects induced by the direct binding of CsA to NaDC1.
These functional studies also demonstrated that the CsA effect on heterologously expressed NaDC1 activity was concentration- and time-dependent (Fig. 2), suggesting that CsA exerted its effects on both expression systems through identical molecular mechanism, i.e. via the cyclophilins. Higher concentrations of CsA were necessary to inhibit the NaDC1 activity in oocytes compared with cultured cells which is likely due to the large size of oocytes and the vitelline membrane surrounding them. Indeed, treatment of oocytes with 50 μm CsA for 72 h produced a lower effect on intracellular cyclophilin B expression than treatment in HEK293 cells with 10 μm CsA for 24 h (see Fig. 5, B and C).
Expression, immunofluorescence, and metabolic labeling studies (Figs. 3 and 4, and supplemental Fig. S2) showed that CsA decreases the function of NaDC1 by affecting its synthesis, maturation and trafficking, thereby reducing its total expression (including importantly endogenous NaDC1 in HEK293 cells). As CsA reduced the amount of the immature NaDC1 form in oocytes (72 h treatment) and HEK293 cells, and CypA has been reported to regulate the cell surface expression of some integral proteins such as the homo-oligomeric receptors, the CD147 immunoglobulin and the insulin receptor (37–39), but without affecting their synthesis and total expression, we hypothesized that inhibition of cyclophilin B is responsible for the CsA effect on NaDC1 total expression. In support of this hypothesis are the following observations: (1) cyclophilin B is the second most abundant cyclophilin in human tissues after cyclophilin A, (2) it is the second major target for CsA after cyclophilin A, (3) it is highly expressed in the ER and (4) because it is targeted to the secretory pathway to act as chaperone, it is localized in both the cytosol and the plasma membrane (21–22). The latter has been demonstrated in Drosophila photoreceptor cells by the formation of a stable complex between the Drosophila cyclophilin B (called ninaA) and the major rhodopsin Rh1 (19, 23).
Given that CsA treatments for 24 h and 72 h induced different NaDC1 total expression levels in oocytes (Fig. 3, A and B), we examined whether differences in cyclophilin B expression levels in response to the 24 h and 72 h CsA treatments could account for the observed differences in NaDC1 total expression. Surprisingly, Western blot analyses after 24 h treatment of oocytes revealed that intracellular cyclophilin B expression was not down-regulated by CsA, meaning that CsA might compete with secreted NaDC1 to bind to CypB in the secretory pathway (22). This would explain why only the cell surface NaDC1 expression and not the premature ER-synthesized NaDC1 form was reduced by CsA treatment for 24 h. Interestingly, CsA induced cyclophilin B secretion and decreased intracellular cyclophilin B expression in oocytes (72 h treatment) as well as in HEK293 cells, and this correlated well with the CsA-induced reduction in total NaDC1 expression (i.e. CsA effect was more pronounced in HEK293 cells).
Co-injection and siRNA studies allowed us to pin down the molecular mechanism involved in NaDC1 regulation that is: cyclophilin B via its chaperone activity solely is required in the secretory pathway of NaDC1, in analogy to the role played by Drosophila ninaA in the regulation of rhodopsin Rh1 (19, 23). Furthermore, we gained more mechanistic insight by demonstrating that cyclophilin B interacts directly with NaDC1 and co-localizes specifically with the immature NaDC1 form upstream in the biosynthetic-secretory pathway, i.e. in the ER. Interestingly, Price et al. (22) argued in favor of a role for cyclophilin B as a chaperone for secreted plasma membrane proteins in the secretory pathway, rather than solely as a rotamase enzyme. However, assuming that CsA has several biological effects, we therefore cannot entirely rule out the indirect implication of other CsA-sensitive, cyclophilin-dependent accessory proteins in the trafficking of NaDC1, i.e. possibly through multi-protein, CypB-containing complexes.
Clinically, it has been reported that, in the blood of organ transplant patients, therapeutic concentrations of CsA can occasionally reach 1 μm or even higher (40–41). In the present work, we demonstrate that the citrate transport activity of human HEK293 cells expressing NaDC1 was significantly inhibited by 1 μm CsA. From a therapeutic point of view, we can assume that a CsA treatment per se in kidney transplant patients specifically impairs the renal citrate reabsorption via NaDC1, thereby promoting hypercitraturia (see below).
CsA and FK-506 medications induce renal tubular acidosis and lead subsequently to metabolic acidosis, which in turn results in the stimulation of NaDC1 function (via increased availability of citrate2−) and/or expression. In contrast to these indirect effects of CsA and FK-506 on citrate reabsorption (e.g. protonation of citrate3−), our studies revealed that CsA per se reduces the function and total expression of NaDC1, suggesting that, instead, the direct effect of CsA on NaDC1 promotes hypercitraturia (and not hypocitraturia), acting in a positive manner. In contrast, FK-506 had no direct effect on NaDC1 activity and expression. The question remains how this can be reconciled with the fact that CsA and FK-506 induce hypocitraturia in some kidney transplant patients (8).
Under our experimental conditions, CsA did not change the extracellular pH, so we measured the direct effect of CsA on NaDC1 expression and function. Because CypB is ubiquitously expressed, it can be assumed that CsA also regulates NaDC1 expression via CypB in renal proximal tubular cells. Under pathophysiological conditions like metabolic acidosis, it is reasonable to assume that the acidification overrides the effect of CsA via CypB. It has been shown that one of the mechanisms by which CsA induces nephrotoxity, and especially renal tubular acidosis, is through the blockade of the rotamase activity of CypA (42–43), thus increasing the proportion of the preferred substrate citrate2−. However, the inhibition of NaDC1 expression in the plasma membrane via CypB is likely a positive mechanism to prevent severe acidosis-induced hypocitraturia, thereby increasing the urinary citrate back toward normal levels. Thus, our study shows that CsA per se promotes hypercitraturia and not hypocitraturia, as observed clinically, therefore providing new insight into the mechanisms of CsA-induced hypocitraturia, by excluding the involvement of CypB. This could explain why certain kidney graft patients receiving CsA do not produce kidney stones. Also, our findings may pave the way for the development of non-immunosuppressive CsA-like drugs to promote citraturia.
In conclusion, we have shown for the first time that NaDC1 expression and function depends on the interaction and activity of a regulatory protein, the chaperone CypB, during its synthesis, maturation and trafficking from the ER to the plasma membrane. This study provides new insights into the molecular mechanisms regulating basal NaDC1 expression and function, and consequently the regulation of the reabsorptive capacity of the kidney, highlighting important pharmacological and pathological aspects.
Supplementary Material
Acknowledgments
We thank Dr. Daniel Fuster and Leah Witton for reading the manuscript, as well as Yvonne Amrein for maintenance of the X. laevis frogs.
This work was supported by a grant from The Swiss National Foundation (SNF) entitled “Calcium and Citrate Transporters in Renal Stone Disease.”

The on-line version of this article (available at http://www.jbc.org) contains supplemental Figs. S1–S3 and Tables S1 and S2.
M. J. Bergeron, unpublished data.
The vector Pol1, the cDNA of wt huCypA, and wt and mutant huCypB, and the wt huTRPV6/pNWP construct were a gift from Dr. Paul Isenring (Laval University, QC, Canada), Dr. Charles V. Clevenger (Northwestern University), and Dr. Yoshiro Suzuki (University of Bern, Switzerland), respectively.
- NaDC
- Na+-dicarboxylate cotransporter
- CsA
- cyclosporin A
- CypA
- cyclophilin A
- CypB
- cyclophilin B
- ER
- endoplasmic reticulum
- PDI
- protein-disulfide isomerase.
REFERENCES
- 1. Hamm L. L. (1990) Kidney Int. 38, 728–735 [DOI] [PubMed] [Google Scholar]
- 2. Hamm L. L., Hering-Smith K. S. (2002) Endocrinol. Metab. Clin. North Am. 31, 885–893 [DOI] [PubMed] [Google Scholar]
- 3. He Y., Chen X., Yu Z., Wu D., Lv Y., Shi S., Zhu H. (2004) J. Nephrol. 17, 34–42 [PubMed] [Google Scholar]
- 4. Okamoto N., Aruga S., Matsuzaki S., Takahashi S., Matsushita K., Kitamura T. (2007) Int. J. Urol. 14, 344–349 [DOI] [PubMed] [Google Scholar]
- 5. Ho H. T., Ko B. C., Cheung A. K., Lam A. K., Tam S., Chung S. K., Chung S. S. S. (2007) Kidney Int. 72, 63–71 [DOI] [PubMed] [Google Scholar]
- 6. Aruga S., Wehrli S., Kaissling B., Moe O. W., Preisig P. A., Pajor A. M., Alpern R. J. (2000) Kidney Int. 58, 206–215 [DOI] [PubMed] [Google Scholar]
- 7. Jenkins A. D., Dousa T. P., Smith L. H. (1985) Am. J. Physiol. Renal Physiol. 249, F590–595 [DOI] [PubMed] [Google Scholar]
- 8. Stapenhorst L., Sassen R., Beck B., Laube N., Hesse A., Hoppe B. (2005) Pediatric Nephrology 20, 652–656 [DOI] [PubMed] [Google Scholar]
- 9. Heering P., Degenhardt S., Grabensee B. (1996) Nephron 74, 501–511 [DOI] [PubMed] [Google Scholar]
- 10. Keven K., Ozturk R., Sengul S., Kutlay S., Ergun I., Erturk S., Erbay B. (2007) Nephrol. Dial. Transplant. 22, 906–910 [DOI] [PubMed] [Google Scholar]
- 11. Wan L., Tian X., Diggs L., Alpern R. J., Preisig P. A. (2009) ASN 42nd Annual Meeting and Scientific Exposition, Abstr. F-PO1152 [Google Scholar]
- 12. Chen H., Kubo Y., Hoshi T., Heinemann S. H. (1998) FEBS Letts. 422, 307–310 [DOI] [PubMed] [Google Scholar]
- 13. Elbaz B., Alperovitch A., Gottesman M. M., Kimchi-Sarfaty C., Rahamimoff H. (2008) Mol. Pharmacol. 73, 1254–1263 [DOI] [PubMed] [Google Scholar]
- 14. Kimchi-Sarfaty C., Kasir J., Ambudkar S. V., Rahamimoff H. (2002) J. Biol. Chem. 277, 2505–2510 [DOI] [PubMed] [Google Scholar]
- 15. Rosado J. A., Pariente J. A., Salido G. M., Redondo P. C. (2010) Arterioscler. Thromb. Vasc. Biol. 30, 419–425 [DOI] [PubMed] [Google Scholar]
- 16. Tran T. T., Dai W., Sarkar H. K. (2000) J. Biol. Chem. 275, 35708–35714 [DOI] [PubMed] [Google Scholar]
- 17. Tran T. T., Qian X., Edwards C., Sarkar H. K. (2009) Adv. Exp. Med. Biol. 643, 503–511 [DOI] [PubMed] [Google Scholar]
- 18. Galat A. (2003) Curr. Top. Med. Chem. 3, 1315–1347 [DOI] [PubMed] [Google Scholar]
- 19. Baker E. K., Colley N. J., Zuker C. S. (1994) EMBO J. 13, 4886–4895 [DOI] [PMC free article] [PubMed] [Google Scholar]
- 20. Rycyzyn M. A., Clevenger C. V. (2002) Proc. Natl. Acad. Sci. U.S.A. 99, 6790–6795 [DOI] [PMC free article] [PubMed] [Google Scholar]
- 21. Price E. R., Zydowsky L. D., Jin M. J., Baker C. H., McKeon F. D., Walsh C. T. (1991) Proc. Natl. Acad. Sci. U.S.A. 88, 1903–1907 [DOI] [PMC free article] [PubMed] [Google Scholar]
- 22. Price E. R., Jin M., Lim D., Pati S., Walsh C. T., McKeon F. D. (1994) Proc. Natl. Acad. Sci. U.S.A. 91, 3931–3935 [DOI] [PMC free article] [PubMed] [Google Scholar]
- 23. Colley N. J., Baker E. K., Stamnes M. A., Zuker C. S. (1991) Cell 67, 255–263 [DOI] [PubMed] [Google Scholar]
- 24. Fujiwara T., Ikeda Y., Arita K., Kanno T., Takehara Y., Yabuki M., Utsumi K. (2003) Transplant Int. 16, 108–114 [DOI] [PubMed] [Google Scholar]
- 25. Bouvier N., Flinois J. P., Gilleron J., Sauvage F. L., Legendre C., Beaune P., Thervet E., Anglicheau D., Pallet N. (2009) Am. J. Physiol. Renal Physiol. 296, F160–F169 [DOI] [PubMed] [Google Scholar]
- 26. Long K., Boyce M., Lin H., Yuan J., Ma D. (2005) Bioorganic Med. Chem. Lett. 15, 3849–3852 [DOI] [PubMed] [Google Scholar]
- 27. Pallet N., Bouvier N., Bendjallabah A., Rabant M., Flinois J. P., Hertig A., Legendre C., Beaune P., Thervet E., Anglicheau D. (2008) Am. J. Transplant. 8, 2283–2296 [DOI] [PubMed] [Google Scholar]
- 28. Wek R. C., Cavener D. R. (2007) Antioxidants Redox Signal. 9, 2357–2372 [DOI] [PubMed] [Google Scholar]
- 29. Kino T., Hatanaka H., Miyata S., Inamura N., Nishiyama M., Yajima T., Goto T., Okuhara M., Kohsaka M., M., Aoki H. (1987) J. Antibiot. 40, 1256–1265 [DOI] [PubMed] [Google Scholar]
- 30. Pajor A. M. (1996) Am. J. Physiol. 270, F642–F648 [DOI] [PubMed] [Google Scholar]
- 31. Suñé G., Sarró E., Puigmulé M., López-Hellín J., Zufferey M., Pertel T., Luban J., Meseguer A. (2010) PLoS ONE 5, e13930. [DOI] [PMC free article] [PubMed] [Google Scholar]
- 32. Stumpf T., Zhang Q., Hirnet D., Lewandrowski U., Sickmann A., Wissenbach U., Dörr J., Lohr C., Deitmer J. W., Fecher-Trost C. (2008) J. Biol. Chem. 283, 18086–18098 [DOI] [PubMed] [Google Scholar]
- 33. Bollo M., Paredes R. M., Holstein D., Zheleznova N., Camacho P., Lechleiter J. D. (2010) PLoS ONE 5, e11925. [DOI] [PMC free article] [PubMed] [Google Scholar]
- 34. Mochida S., Hunt T. (2007) Nature 449, 336–340 [DOI] [PubMed] [Google Scholar]
- 35. Romero M. F., Kanai Y., Gunshin H., Hediger M. A. (1998) Methods Enzymol. 296, 17–52 [DOI] [PubMed] [Google Scholar]
- 36. Wagner C. A., Friedrich B., Setiawan I., Lang F., Bröer S. (2000) Cell Physiol. Biochem. 10, 1–12 [DOI] [PubMed] [Google Scholar]
- 37. Helekar S. A., Patrick J. (1997) Proc. Natl. Acad. Sci. U.S.A. 94, 5432–5437 [DOI] [PMC free article] [PubMed] [Google Scholar]
- 38. Shiraishi S., Yokoo H., Kobayashi H., Yanagita T., Uezono Y., Minami S., Takasaki M., Wada A. (2000) Neurosci. Lett. 293, 211–215 [DOI] [PubMed] [Google Scholar]
- 39. Yurchenko V., Pushkarsky T., Li J. H., Dai W. W., Sherry B., Bukrinsky M. (2005) J. Biol. Chem. 280, 17013–17019 [DOI] [PubMed] [Google Scholar]
- 40. Shaw L. M., Yatscoff R. W., Bowers L. D., Freeman D. J., Jeffery J. R., Keown P. A., McGilveray I. J., Rosano T. G., Wong P. Y. (1990) Clin. Chem. 36, 1841–1846 [PubMed] [Google Scholar]
- 41. Tegzess A. M., Doorenbos B. M., Minderhoud J. M., Donker A. J. (1988) Transplant. Proc. 20, Suppl. 3, 530–533 [PubMed] [Google Scholar]
- 42. Hong F., Lee J., Piao Y. J., Jae Y. K., Kim Y. J., Oh C., Seo J. S., Yun Y. S., Yang C. W., Ha J., Kim S. S. (2004) Biochem. Biophys. Res. Commun. 316, 1073–1080 [DOI] [PubMed] [Google Scholar]
- 43. Watanabe S., Tsuruoka S., Vijayakumar S., Fischer G., Zhang Y., Fujimura A., Al-Awqati Q., Schwartz G. J. (2005) Am. J. Physiol. Renal Physiol. 288, F40–F47 [DOI] [PubMed] [Google Scholar]
Associated Data
This section collects any data citations, data availability statements, or supplementary materials included in this article.