

Abstract
The SMK (SAM-III) box is an S-adenosylmethionine (SAM)-responsive riboswitch found in the 5′ untranslated region of metK genes, encoding SAM synthetase, in many members of the Lactobacillales. SAM binding causes a structural rearrangement in the RNA that sequesters the Shine-Dalgarno (SD) sequence by pairing with a complementary anti-SD (ASD) sequence; sequestration of the SD sequence inhibits binding of the 30S ribosomal subunit and prevents translation initiation. We observed a slight increase in the half-life of the metK transcript in vivo when Enterococcus faecalis cells were depleted for SAM, but no significant change in overall transcript abundance, consistent with the model that this riboswitch regulates at the level of translation initiation. The half-life of the SAM-SMK box RNA complex in vitro is shorter than that of the metK transcript in vivo, raising the possibility of reversible binding of SAM. We used a fluorescence assay to directly visualize reversible switching between the SAM-free and SAM-bound conformations. We propose that the SMK box riboswitch can make multiple SAM-dependent regulatory decisions during the lifetime of the transcript in vivo, acting as a reversible switch that allows the cell to respond rapidly to fluctuations in SAM pools by modulating expression of the SAM synthetase gene.
Keywords: riboswitch, RNA, translational regulation, bacteria, gene expression
Introduction
Riboswitches are cis-acting RNA sequences that directly sense regulatory signals without the assistance of proteins (reviewed in Coppins et al., 2007; Edwards et al., 2007 Henkin, 2008). RNA elements of this type are commonly used in bacteria to regulate metabolism and transport of vitamins, nucleotides, amino acids, cofactors, and metal ions. Each class of riboswitch exhibits conserved sequence and structural elements that confer specificity for the cognate signal. Recognition of the signal typically results in a structural rearrangement in the RNA that affects downstream gene expression. The most common types of rearrangements either cause or prevent formation of an intrinsic transcriptional terminator, or control availability of the ribosome binding site (RBS) to regulate the gene at the level of translation initiation (Henkin, 2008). The continuing discovery of new riboswitch classes in bacteria coupled with the identification of riboswitch elements in eukaryotic organisms (Sudarsan et al., 2003; Thore et al., 2006) suggests that there may be many more of these RNAs to be discovered.
The SMK box (or SAM-III) riboswitch is a SAM-binding element that is found in the 5′ untranslated region of the metK gene, which encodes S-adenosylmethionine (SAM) synthetase, in Lactobacillales sp. (Fuchs et al., 2006). The metK leader RNA from Enterococcus faecalis binds SAM with a Kd of 0.85 μM and shows a >100-fold preference for SAM over the closely related analog S-adenosylhomocysteine (SAH; (Fuchs et al., 2006, 2007; Lu et al., 2008). We previously showed through RNA structural probing, mutational analysis, and X-ray crystallography that SAM binding results in sequestration of part of the Shine-Dalgarno (SD) sequence through pairing with a complementary upstream anti-SD (ASD) element (Fig. 1A; Fuchs et al., 2006, 2007). The SAM-dependent sequestration of the SD sequence is sufficient to inhibit ribosome binding in vitro, consistent with the model that SAM represses translation initiation (Fuchs et al., 2007). This model is supported by the observation that translational fusions of the SMK box to a lacZ reporter in Bacillus subtilis exhibit ~5-fold decreased expression when cells are grown under conditions where SAM pools are elevated (Fuchs et al., 2006).
Figure 1. The E. faecalis SMK box riboswitch.

(A) In the absence of SAM (left), the ASD sequence (red) is predicted to be single stranded and helix P0 is formed. In this conformation, the SD sequence (green) is accessible for translation initiation. SAM binding (right) causes disruption of helix P0 and stabilization of helices P1, P2, and P4. In this conformation, the SD sequence is sequestered and translation initiation is inhibited. Helix P3 is predicted to be present in both conformations. The AUG start codon of metK is indicated in yellow. (B) The SAM-binding pocket is at the center of a 3-way junction between helices P1, P2, and P4. The three-dimensional cartoon is rotated relative to (A) to facilitate visualization of the ligand-binding pocket. SAM makes direct contacts with the mRNA via its adenosine moiety, while its methionine tail extends into a solvent-filled cavity (Lu et al., 2008). This image was generated from coordinates deposited in the RCSB Protein Data Bank under accession number 3E5C.
Three SAM-responsive riboswitch classes (S box/SAM-I, SAM-II, and SMK box/SAM-III) have been identified (Corbino et al., 2005; Fuchs et al., 2006; McDaniel et al., 2003). Despite recognition of the same ligand, each riboswitch class exhibits a distinct overall tertiary fold. The S box riboswitch has a typical modular architecture that consists of a ligand-binding (aptamer) domain and a separate regulatory domain (Grundy and Henkin, 1998; McDaniel et al., 2005); in contrast, the SAM-II and SMK box riboswitches differ from most metabolite-binding riboswitches in that they utilize a single module that integrates both ligand binding and regulatory control (Corbino et al., 2005; Fuchs et al., 2006).
The high resolution structure determination of representative riboswitches from each class allowed direct comparison of the SAM-binding pockets (Gilbert et al., 2008; Lu et al., 2008; Montange and Batey, 2006). All three riboswitches require the positive charge on the sulfonium ion of SAM for ligand recognition and discrimination against SAH. In contrast, recognition of other SAM functional groups is somewhat variable. In the S box and SAM-II riboswitches, virtually all of the SAM functional groups are important (with the exception of the chemically reactive methyl group of SAM in the S box system), while in the SMK box riboswitch the methionine moiety (beyond the sulfur) and methyl group of SAM are not specifically recognized (Fig. 1B). Differences in the recognition properties of the SAM-binding riboswitches are likely to affect the kinetics of ligand association and dissociation.
In this study, we investigated properties of the E. faecalis SMK box RNA in the native host. We measured SAM pools in cells grown under different conditions, and measured the abundance and stability of the metK transcript. Our data indicate that the metK gene is not regulated at the level of transcript abundance, consistent with the translational control model. We also used a fluorescence assay to measure the stability of the SAM-SMK box RNA complex in vitro, and found that the half-life of the SAM-RNA complex is much shorter than the half-life of the transcript in vivo. This suggested the possibility that the metK transcript can make multiple SAM-dependent regulatory decisions during its lifetime, and reversible switching between the SAM-free and SAM-bound forms on a physiologically relevant time-scale was directly visualized in vitro. These results demonstrate that the SMK box riboswitch can act as a true reversible switch.
Results
Manipulation of SAM pools in E. faecalis
Starvation of a B. subtilis methionine auxotroph for methionine results in decreased intracellular concentrations of SAM, which is synthesized from methionine and ATP (Tomsic et al., 2008; Wabiko et al., 1988). Growth of E. faecalis strain OG1 (Gold et al., 1975) in CDM minimal medium was dependent on addition of methionine, consistent with the observation that E. faecalis strains require methionine for growth (Murray et al., 1993). Cells were harvested after growth in CDM containing methionine (230 μM) and resuspended in CDM containing methionine at high (230 μM) or low (1.8 μM) concentrations. Samples were taken at intervals and extracted with formic acid to release cellular metabolites. The extracts were added to an in vitro transcription assay using a B. subtilis yitJ template, which contains an S box riboswitch that exhibits SAM-dependent transcription termination (McDaniel et al., 2003). The concentration of SAM in each extract was determined by comparing the ratio of terminated and readthrough transcription products to a standard curve generated using known amounts of SAM (Artsimovitch and Henkin, 2009; Tomsic et al., 2008). The intracellular concentration of SAM was then calculated based on the A595 of each culture sample.
SAM levels in E. faecalis increased during the first 40 min after dilution into fresh medium (Fig. 2). This is likely to be due to the small amount of residual methionine in the culture. The SAM concentration then decreased rapidly, with a 5-fold reduction observed at the 53 min time point followed by a slow decline over the remainder of the 180 min time course (~8-fold total reduction of SAM concentration). This result is similar to what we previously observed in B. subtilis, where SAM pools decreased 6-fold at the 75 min time point and showed a 10-fold total reduction over the time course (Tomsic et al., 2008). Addition of methionine to the E. faecalis culture reversed the decrease in SAM pools; when methionine (230 μM) was added immediately after the 60 min time point, SAM levels completely recovered to the maximal value within 10 min (Fig. 2). These results show that SAM pools in E. faecalis can be manipulated easily, and follow patterns similar to those observed in B. subtilis, which validates studies using reporter gene fusions in the heterologous host (Fuchs et al., 2006, 2007).
Figure 2. Measurement of SAM pools in E. faecalis.
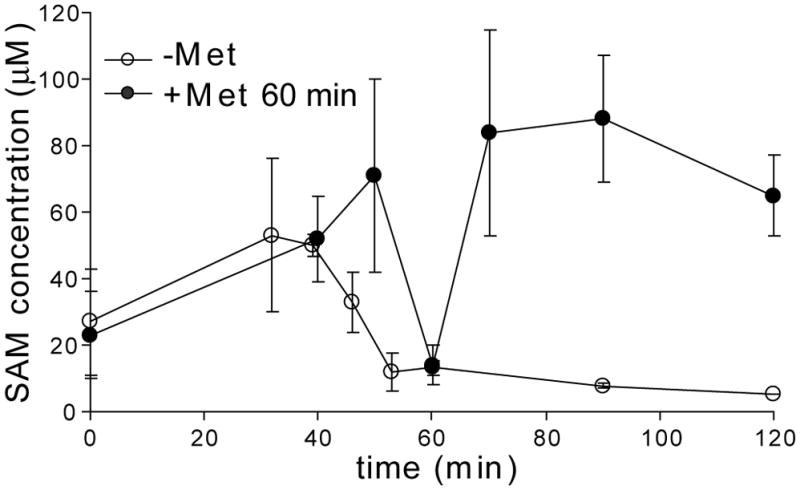
E. faecalis cells were grown in minimal medium containing high methionine (230 μM) until mid-log phase. Cells were collected by centrifugation and resuspended in fresh media containing low methionine (1.8 μM; open circles). Samples were collected over time and the concentration of SAM in formic acid extracts of the cells was determined in an in vitro transcription assay with a SAM-responsive S box RNA, by comparison to a standard curve of transcription reactions carried out with known concentrations of SAM. Reversibility of the response was determined by addition of methionine (to 230 μM) after the 60 min sample (closed circles).
Measurement of metK transcript abundance in E. faecalis
The abundance of the metK transcript in E. faecalis grown under high or low SAM conditions was measured by using a quantitative reverse transcription PCR (qRT-PCR) assay. Separate reverse transcription reactions were carried out using primers that correspond to the coding region of metK, the coding region of a putative methionine synthase gene (which is predicted to be regulated at the level of transcription antitermination by the T box mechanism in response to a reduction in aminoacylated tRNAMet; Gutierrez-Preciado et al., 2009), and 5S rRNA (which is not expected to respond to depletion of SAM pools in this time-frame). After reverse transcription, cDNAs were used as templates in qRT-PCR reactions, and the amount of the target template was normalized to the starting amount of total RNA.
5S rRNA showed no change in abundance in low vs. high methionine conditions (Table 1). In contrast, the putative methionine synthase gene showed a 26-fold increase in transcript abundance after 1 h in low methionine medium, consistent with the prediction that this gene is regulated at the level of transcription antitermination in response to methionine limitation. No change was observed in the abundance of the metK transcript even after 3 h of incubation in low methionine medium (Table 1), conditions under which the SAM pools dropped 8-fold (Fig. 2). This indicates that there is no significant regulation at the level of metK transcript abundance in response to depletion of methionine and SAM in E. faecalis, consistent with the model that regulation is mediated at the level of translation. These results further validate the premise that the reporter experiments in B. subtilis provide an accurate reflection of regulation in E. faecalis.
Table 1.
Transcript levels in E. faecalis
|
mRNA induction ratio (−met/+met)a |
||||
|---|---|---|---|---|
| RNAb | 0 h | 1 h | 2 h | 3 h |
| metK | 1.2 ± 0.3 | 1.5 ± 0.2 | 1.2 ± 0.6 | 1.0 ± 0.1 |
| 5S rRNA | 1.5 ± 0.5 | 1.1 ± 0.3 | 1.2 ± 0.3 | 1.3 ± 0.4 |
| methionine synthase gene | 1.2 ± 0.1 | 26 ± 6 | 13 ± 2 | 7.4 ± 3 |
Total RNA was extracted at 1 h intervals from E. faecalis cells grown in CDM medium containing either low (1.8 μM) or high (230 μM) methionine. Transcript abundance was measured by qRT-PCR. mRNA induction ratio is the abundance of transcript under low methionine conditions divided by abundance of transcript under high methionine conditions.
Specific primers for reverse transcription were designed for each RNA. The methionine synthase gene is predicted based on sequence similarity; it contains a T box motif that is predicted to respond to a reduction in aminoacylated tRNAMet (Gutierrez-Preciado et al., 2009).
Measurement of metK transcript stability in E. faecalis
Addition of rifampicin followed by qRT-PCR was utilized to determine the half-life (t1/2) of the metK transcript in E. faecalis. Rifampicin blocks transcription of new RNA, so that the t1/2 can be determined by measuring the decrease in transcript abundance over time. 5S rRNA was included as a stable RNA control, and no significant decrease in 5S rRNA abundance was observed. The t1/2 of the putative methionine synthase gene transcript, which is predicted to be regulated at the level of transcription antitermination by a T box element, was 3.9 +/− 0.8 min in cells grown in the presence of high methionine (Table 2). The t1/2 increased 1.4-fold after growth in low methionine for 1 h. This increase was transient, however, and the t1/2 returned to a value similar to the initial value after 2 h. This trend is consistent with the transcript abundance data which showed a 26-fold increase at 1 h that tapered off at the 2 h and 3 h time points (Table 1). Although transcript stability may play a small role in this trend, the T box antitermination mechanism is likely to be the most important factor in the initial 26-fold increase in transcript levels.
Table 2.
Half-life (t1/2) of transcripts in vivo
| Growth conditions (time, [methionine])a |
||||
|---|---|---|---|---|
| 1 h, 230 μM | 1 h, 1.8 μM | 2 h, 1.8 μM | ||
| RNAb | Riboswitch | t1/2 (min) | t1/2 (min) | t1/2 (min) |
| E. fae metK, 5′ coding region | SMK box | 2.8 +/− 0.3 | 3.5 +/− 0.6 | 3.7 +/− 0.4 |
| E. fae metK, 3′ coding region | SMK box | 3.2 +/− 0.2 | 4.4 +/− 0.4 | 3.9 +/− 0.6 |
| E. fae putative met gene | T box | 3.9 +/− 0.8 | 5.4 +/− 0.3 | 3.6 +/− 0.1 |
| B. sub metK | S box | 1.3 +/− 0.4 | N/A | N/A |
| B. sub yitJ | S box | 1.4 +/− 0.1 | N/A | N/A |
Cells were grown in CDM (Murray et al., 1993) or Spizizen (Anagnostopoulos and Spizizen, 1961) medium until mid-log phase for E. faecalis or B. subtilis, respectively. The cells were collected by centrifugation and resuspended in medium containing either low (1.8 μM) or high (230 μM) methionine. After incubation at 37°C for 1 or 2 h, rifampicin was added and samples were taken at 0, 2, 5, and 10 min. Transcript abundance was measured by qRT-PCR and the t1/2 was determined from the decrease in transcript over time.
Primers for reverse transcription were designed for each transcript and were complementary to a region near the 5′ end of the coding region unless otherwise indicated.
Two different primers, complementary to the 5′ and 3′ ends of the E. faecalis metK coding region, respectively, were tested to monitor stability of both the 5′ portion and the full-length transcript. Both regions of the transcript exhibited a t1/2 of approximately 3 min under high methionine conditions (Table 2). Limitation for methionine resulted in a small (<1.4-fold) increase in the stability of the transcript. This increase in stability is consistent with a slight increase in transcript abundance in cells grown for one hour in the absence of methionine (Table 1) and is likely to be due to protection of the RNA from degradation by increased translation, resulting from increased availability of the SD region when SAM pools are depleted.
The stability of two S box transcripts (metK and yitJ) in B. subtilis was also measured in order to compare SMK box RNA stability with the stability of transcripts containing SAM-dependent riboswitches that are regulated at the level of premature transcription termination. Both of the S box gene transcripts exhibited a t1/2 of less than 1.5 min (Table 2). These results suggest that these S box gene transcripts have a more rapid rate of turnover than SMK box transcripts, consistent with regulation at the level of transcription attenuation rather than translation initiation. Alternatively, the fact that the E. faecalis T box riboswitch-regulated gene also shows a longer t1/2 may suggest that transcripts in E. faecalis are generally somewhat more stable than in B. subtilis.
Measurement of the stability of the SAM-SMK box complex in vitro
A relatively long transcript lifetime in vivo, in the context of a regulatory mechanism that operates at the level of translation, provides an opportunity for multiple regulatory events for a single mRNA. The B. subtilis yitJ S box RNA-SAM complex was previously shown to be very stable (t1/2 of 7.2 min; Tomsic et al., 2008). We therefore measured the stability of the SAM-SMK box complex to determine whether multiple rounds of SAM binding and release could occur during the lifetime of the transcript. A fluorescence assay that utilizes a bipartite RNA containing a 2-aminopurine (2-AP) substitution at position A29 in the metK leader RNA (Fig. 3A) was developed previously to measure SAM binding to the SMK box RNA (Lu et al., 2008). A29 is predicted to be unpaired in the absence of SAM, and is paired (with residue U69) in the ligand-bound conformation. Analysis of steady-state emission spectra showed that 2-AP fluorescence is quenched upon addition of SAM (Lu et al., 2008). This effect is likely to result from specific binding of SAM to the riboswitch since similar fluorescence quenching is not observed with a leader RNA containing a U72C mutation, which disrupts SAM binding, nor with SAH, which fails to bind the RNA (Lu et al., 2008).
Figure 3. Dissociation of the SAM-SMK box riboswitch complex.

(A) A bipartite RNA corresponding to the E. faecalis metK leader (with a nick at the top of the terminal stem-loop) was used for fluorescence assays. A 2-AP fluorescent probe (arrow) was incorporated in the upstream RNA at a region predicted to undergo a conformational rearrangement in response to SAM binding. (B) Dissociation of SAM from the SMK box riboswitch was monitored at 22 °C in a stopped-flow spectrometer. A 5-fold molar excess of a SAM-sequestering competitor RNA (B. subtilis yitJ leader) was added to the E. faecalis SMK box RNA-SAM complex, resulting in an increase in 2-AP fluorescence. Data points (gray spheres) represent the averages from six individual traces. The residuals plot (bottom panel) shows the difference between the actual (gray spheres) and calculated (black trace) data sets.
The rate of ligand dissociation was measured by rapidly mixing the equilibrated bipartite RNA-SAM complex with an excess of the B. subtilis yitJ S box riboswitch RNA; the yitJ RNA binds SAM with an apparent Kd of 0.019 μM and forms a very stable complex (Tomsic et al., 2008), and therefore acts as a competitor to sequester SAM as it is released from the SAM-SMK box complex. The rate of change in fluorescence, monitored in a stopped-flow spectrometer, represents the koff. Rapid mixing of the SAM-SMK box complex with a 5-fold molar excess of competitor RNA resulted in an increase of 2-AP fluorescence emission, with a koff of 0.089 sec−1 (Fig. 3B). Inspection of the residual plot revealed that a single exponential function provides a reasonable fit, and no improvement was observed with a double exponential function. Similar results were obtained with a 10-fold molar excess of competitor RNA.
From these results, the t1/2 of the SAM-SMK box complex was determined to be 7.8 sec, which is ~20-fold shorter than the t1/2 of the metK transcript in vivo. This suggests that the transcript is available for multiple rounds of SAM binding and dissociation, and supports the model that the SMK box riboswitch can act as a reversible riboswitch with the potential to undergo several regulatory decisions within the lifetime of the mRNA in response to changes in SAM availability.
Reversibility of the SMK box riboswitch in vitro
We utilized a time-resolved fluorescence assay using the 2-AP labeled E. faecalis metK leader RNA to visualize the ability of the SMK box riboswitch to switch between alternate conformations in response to fluctuating levels of SAM. SAM levels were modulated through the addition of SAM, or of the SAM-sequestering yitJ S box RNA, at precise time intervals. Emission fluorescence from the 2-AP labeled bipartite RNA (1 μM) in the absence of additional reaction components was monitored from 0–60 sec (Fig. 4). Under these conditions, a small decrease in fluorescence was observed, which is likely to be due to photobleaching of the 2-AP fluorophore. Addition of SAM (2 μM) at 60 sec resulted in a rapid decrease in fluorescence intensity, consistent with the SAM-dependent quenching of fluorescence. The addition of yitJ S box competitor RNA (4 μM) resulted in reversal of the quenching phenotype and an increase in fluorescence intensity over time (Fig. 4). These data are consistent with results obtained in the SAM-SMK box RNA dissociation experiments and suggest that the SMK box riboswitch returns to a conformational state that resembles the ligand-free conformation as SAM levels are depleted. A second addition of SAM (20 μM) in a 5-fold molar excess over the yitJ RNA at 300 sec resulted in another reversal in fluorescence intensity, as emission levels were once again quenched in response to ligand binding. These data demonstrate that the SMK box riboswitch can undergo multiple conformational switches in response to changing levels of SAM in vitro.
Figure 4. Conformational switching of the SMK box riboswitch.
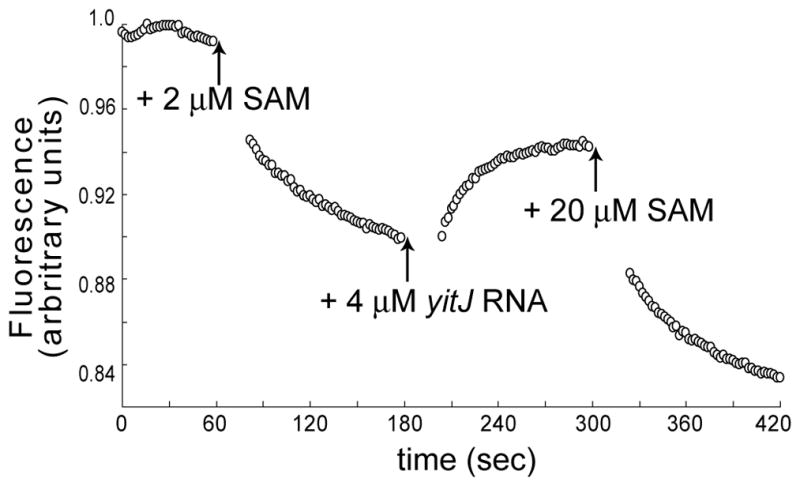
Fluorescence of an E. faecalis metK leader RNA (1 μM) containing a 2-AP fluorescent probe was monitored over time. Addition of SAM (2 μM) at 60 sec resulted in fluorescence quenching, while addition of yitJ competitor RNA (4 μM) at 180 sec caused an increase in fluorescence. Addition of more SAM (20 μM) at 300 sec reversed the phenotype again, leading to an even greater decrease in fluorescence. Gaps in the data represent the time required for addition of sequential reaction components. Values plotted represent the averages from four experiments.
Reversible SAM-dependent repression in vivo
It was previously demonstrated that expression of an E. faecalis metK-lacZ translational fusion, integrated in single copy into the chromosome of B. subtilis strain BR151 (a methionine auxotroph), is repressed in response to methionine (Fuchs et al., 2006). These results were obtained after 4 h of growth in the presence or absence of methionine. To examine the dynamics of the repression response, we monitored lacZ fusion expression over time in cells in which SAM pools were modulated by addition of methionine or SAM.
Low levels of β-galactosidase activity were observed throughout the course of the experiment in cells grown in the presence of methionine (added at T0), consistent with previous results (Fuchs et al., 2006; Fig. 5). In cells to which no methionine was added, initial levels of β-galactosidase activity were also low, presumably due to residual methionine in the cells. β-Galactosidase activity started to increase after 90 min of growth in the absence of methionine; after 210 min, metK-lacZ expression was derepressed by ~4-fold. Addition of either methionine or SAM (at 120 min) was sufficient to reverse the induction of metK-lacZ expression, and after 210 min β-galactosidase activity had returned to near basal levels (Fig. 5). The response to addition of methionine or SAM was similar, consistent with the model that high methionine represses via its rapid conversion to SAM. Some of the β-galactosidase activity observed after addition of methionine or SAM may be due to residual β-galactosidase inside the cells and not to newly synthesized protein, resulting in underrepresentation of the efficiency of repression after SAM pools are restored. These results indicate that addition of methionine or SAM to the growth media can cause rapid shut-off of the SMK box riboswitch in vivo.
Figure 5. Repression of E. faecalis metK-lacZ translational fusions in B. subtilis by addition of methionine or SAM.
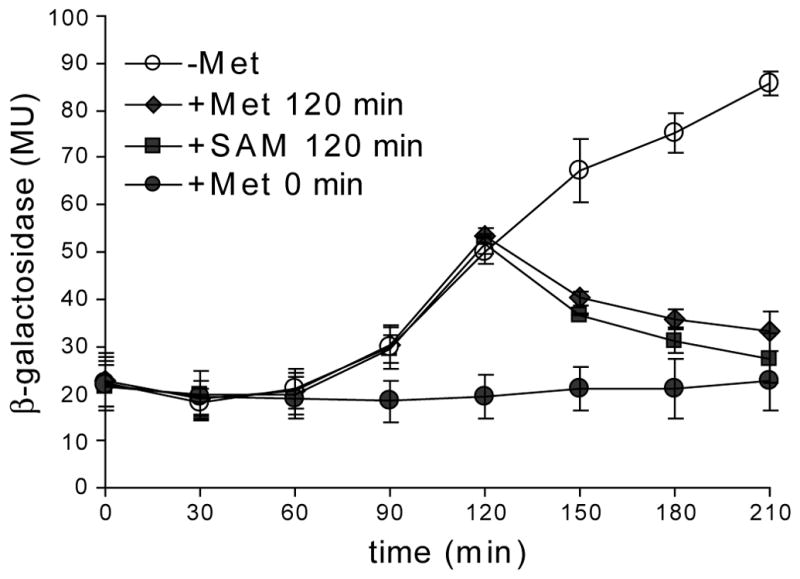
Cells were grown in Spizizen medium (Anagnostopoulos and Spizizen, 1961) in the presence of methionine, collected by centrifugation, and resuspended in fresh medium with or without methionine. After 120 min, methionine or SAM was added to cultures as indicated. Values represent the averages from at least two experiments. MU, Miller units (Miller, 1972).
Discussion
A major question in the riboswitch field is whether metabolite-binding riboswitches can act as true reversible switches rather than as sensors that monitor their cognate signal and make a single regulatory decision. We have reported previously that the SAM-responsive S box riboswitch, which controls genes involved in biosynthesis of methionine and SAM in many Firmicutes, including B. subtilis (Epshtein et al., 2003; McDaniel et al., 2003; Winkler et al., 2003), is likely to be irreversible (Tomsic et al., 2008). The SAM-S box RNA complex is highly stable; for example, the t1/2 of the B. subtilis yitJ-SAM complex is 7.2 min (Tomsic et al., 2008). The t1/2 of the yitJ transcript in vivo is 1.4 min (Table 1), which is significantly shorter than the t1/2 of the complex. Most S box riboswitches, including those in B. subtilis, regulate gene expression at the level of premature termination of transcription. This results in a very short window of opportunity for SAM binding (and potentially for dissociation and rebinding) during transcription of the ~200 nt leader RNA, since once RNAP reaches the termination site it is committed to either the termination or readthrough pathways, and subsequent release or rebinding of SAM to the leader RNA has no effect on synthesis of the full-length transcript. The high stability of the SAM-S box RNA complex indicates that binding of SAM to the nascent transcript during leader RNA transcription will irreversibly commit the transcription elongation complex to termination, and that dissociation of SAM from the RNA is likely to occur only after release of the terminated leader RNA segment. In the worked described here, we consider the potential reversibility of another SAM binding riboswitch, the SMK box from E. faecalis.
The SMK box riboswitch regulates metK gene expression at the level of translation initiation through SAM-dependent sequestration of the SD sequence. Previous in vivo studies of the effect of the E. faecalis SMK box on gene expression were carried out in the heterologous host B. subtilis because of the ease of genetic manipulation of that organism, and because of the known effect on intracellular SAM pools of growth of a B. subtilis methionine auxotroph in the presence or absence of methionine (McDaniel et al., 2006; Tomsic et al., 2008; Wabiko et al., 1988). More direct assessment of metK regulation, and effects on transcript levels in the native E. faecalis background, required establishment of growth conditions under which intracellular SAM pools can change. In the present study, we show that E. faecalis SAM pools decrease in response to methionine limitation, following a pattern similar to that observed in B. subtilis. We also demonstrate that the abundance and stability of the metK transcript does not change significantly when SAM pools are depleted. These results provide additional evidence that regulation of metK expression in response to SAM does not operate at the level of transcription or transcript stability.
Investigation of metK-lacZ translational fusions in B. subtilis revealed that expression of lacZ can be modulated through addition or depletion of either methionine or SAM to the growth media. Expression was initially low in cells resuspended in media containing low methionine, but started to increase once residual methionine was depleted, corresponding to the time at which SAM pools begin to drop. Decreased β–galactosidase activity was observed within minutes after addition of either methionine or SAM to SAM-depleted cells, indicating that repression can be achieved rapidly. These results suggest that SAM can be imported into the cell where it acts directly on the metK leader RNAs. While it is possible that SAM added to the media is hydrolyzed to produce methionine, which can then be recycled back to SAM, this is unlikely given the rapidity of the response.
In contrast to the S box riboswitch, the SMK box riboswitch can function as a reversible riboswitch. The koff of the SMK box-SAM complex was experimentally determined to be 0.089 sec−1 and from these data we calculated a rate of association (kon) of 0.11 uM−1 sec−1 using the equation Kd = koff/kon, where the Kd is 0.85 μM (Lu et al., 2008). The half-life of the SAM-SMK box complex in vitro was calculated to be ~8 sec, which is 20-fold shorter than the half-life of the E. faecalis metK transcript in vivo (~3 min; Table 1). These results indicate that an initially formed SAM-RNA complex can dissociate before the mRNA is degraded, leaving the metK transcript accessible for either translation initiation or interaction with another SAM molecule. The relative rate constants for each of these processes, and the concentrations of reaction components available at a given time, determine which of these events is more likely to occur. We used the fluorescence binding assay to directly demonstrate switching of the metK leader between SAM-bound and SAM-free conformations in vitro in response to fluctuating levels of SAM, in a physiologically relevant time-scale. This validates the prediction that this riboswitch can function as a reversible switch in vivo.
In the SMK box riboswitch, SAM makes specific contacts to the mRNA via its adenosine moiety and positively charged sulfonium ion, while the methionine tail assumes an extended conformation and is accessible to the solvent (Lu et al., 2008). This is in contrast to the S box riboswitch in which the SAM molecule is encapsulated on virtually all sides (Montange and Batey, 2006). The difference in ligand recognition properties between these two classes of SAM-binding RNAs may contribute to the stability of the SAM-RNA complex, and the potential for reversibility of the regulatory response.
SAM is the primary methyl donor used in many essential metabolic processes and must be maintained at sufficient quantities at all times. Under normal growth conditions, SAM levels may not fluctuate as widely as in the severe starvation condtions used in our in vivo analysis (Fig. 2); however, response to minor fluctuations in SAM pools is essential to allow the cell to maintain a near-constant intracellular pool of this essential metabolite. A reversible mechanism of regulation at the level of translation initiation ensures that cells are poised to utilize existing mRNA transcripts to respond to transient fluctuations in SAM pools. This mechanism allows the cell to up-regulate expression of the metK gene rapidly when the intracellular SAM concentration drops below the threshold required for repression. Similar analyses are needed to determine the reversibility of other riboswitch systems, and to explore whether gene function correlates with specific types of regulatory mechanisms.
Experimental procedures
Bacterial strains and growth conditions
E. faecalis strain OG1 (Gold et al., 1975) was grown in BHI (Difco) or CDM minimal medium (Murray et al., 1993). Growth in CDM used a starter culture grown in a 1:4 mixture of BHI and CDM. Overnight cultures were diluted 10-fold in fresh CDM and were incubated at 37°C with shaking. B. subtilis strain BR151 (lys-3 metB10 trpC2) was grown in Spizizen minimal medium as previously described (Anagnostopoulos and Spizizen, 1961).
Measurement of E. faecalis SAM pools
E. faecalis OG1 cells were grown until mid-log phase in CDM minimal medium containing methionine (230 μM) and yeast extract (0.005%). Cells were harvested by centrifugation and resuspended in CDM containing low methionine (1.8 μM). Samples were collected by filtration at the indicated times and nucleotides and related compounds were extracted with formic acid (0.5 M) as described (Ochi et al., 1981). Formic acid was removed from the samples by lyophilization. Extracts were tested in a single round in vitro transcription termination assay using a Pgly-yitJ S box riboswitch template and compared to a SAM standard curve as previously described (Tomsic et al., 2008; Artsimovitch and Henkin. 2009). Each experiment was repeated at least twice.
Total RNA extraction
E. faecalis OG1 cells were grown until mid-log phase in CDM minimal medium containing methionine (230 μM) and yeast extract (0.005%). Cells were harvested by centrifugation and resuspended in fresh CDM containing either low (1.8 μM) or high (230 μM) methionine. Samples were taken at 1 h intervals and added to 2 volumes of RNAprotect™ bacteria reagent (Qiagen). Following 5 min incubation at 22 °C, samples were centrifuged and resuspended in 200 μL of treatment buffer (10 mM Tris-HCl, pH 8.0, 1 mM EDTA, 30 mg/mL lysozyme, and 500 U/mL mutanolysin). After incubation at 37°C for 10 min, total RNA was extracted with the RNeasy® mini kit (Qiagen). RNA samples were treated with RNase-free DNase I (0.06 U/μL; Ambion) to minimize genomic DNA contamination and the total RNA concentration was determined by using a ND-1000 spectrophotometer (NanoDrop Technologies, Inc.).
For RNA stability experiments, aliquots of cells in CDM were taken at desired timepoints and rifampicin was added (0.5 mg/mL; Sigma). Growth was continued, and samples were taken at 0, 2, 5, and 10 min post rifampicin addition and added to 2 volumes of RNAprotect™ bacteria reagent. RNA was extracted as described above.
Quantitative reverse transcriptase PCR assay
Reverse transcription reactions were carried out with total RNA (~100 ng), a primer complementary to the transcript of interest (3 μM) and ThermoScript™ reverse transcriptase (0.75 U/μL; Invitrogen). The resulting cDNA was used as a template for qRT-PCR. Formation of PCR product was measured by iQ™ SYBR® Green fluorescent dye (Bio-Rad) in duplicate. Data sets were collected with a Bio-Rad iQ real-time PCR system and analyzed using iCycler version 3.1 software (Bio-Rad). Each data point was compared to a standard curve to determine the copy number of the target gene in each sample. Copy numbers were normalized based on the amount of RNA present in the initial reverse transcription reaction. Fluorescence data were collected for melt curves from 56°C to 95°C after the last PCR cycle to show that only one product was produced in each reaction. Each experiment was repeated at least three times.
Measurement of SAM-SMK box complex half-life in vitro
Dissociation of SAM from the SMK box riboswitch was measured using stopped-flow spectroscopy with a bipartite RNA comprised of two half molecules corresponding to positions 15–46 and 47–119 of the E. faecalis metK leader RNA. The upstream RNA containing a 2-AP substitution at position A29 was chemically synthesized (Dharmacon), and the downstream RNA was generated by T7 RNAP transcription as previously described (Sampson and Uhlenbeck, 1988) except that reactions were performed overnight at 37 °C. RNA halves (2 μM each) were annealed by combining in 1X transcription buffer (20 mM Tris-HCl, pH 8.0, 20 mM NaCl, 10 mM MgCl2, 0.1 mM EDTA) and heating to 65 °C for 5 min followed by slow cooling to 22 °C. SAM (2 μM) was added and reactions were incubated at 22 °C for 30 min to allow complex formation to reach equilibrium. A competitor RNA (10 or 20 μM), corresponding to positions 14–151 relative to the transcription start site of the B. subtilis yitJ leader RNA, was synthesized by T7 RNAP transcription and folded as described above. Kinetic experiments were performed in an SX18-MV spectrometer (Applied Photophysics) using an excitation wavelength of 310 nm. Equal volumes of preformed SMK box-SAM complex and competitor yitJ leader RNA were rapidly mixed and fluorescence emission was monitored after passage through a 360 nm cutoff filter. For each experiment, six individual traces were averaged and fit to either a single or double exponential equation using KaleidaGraph version 3.51 (Synergy Software) to determine the dissociation rate constant (koff) and complex half-life.
Conformational switching of the SMK box using fluorescence spectroscopy
The bipartite E. faecalis metK and the B. subtilis yitJ leader RNAs were prepared and refolded as described above except that samples were slow cooled to 4 °C instead of 22 °C to slow down the rate of ligand association and dissociation. Emission fluorescence from the metK leader RNA was monitored at 375 nm (with an excitation wavelength of 310 nm) using the constant wavelength analysis application on a FluoroLog-3 spectrofluorometer (Horiba Scientific). Fluorescence intensity was recorded at 2 sec intervals for a total of 420 sec, and either SAM or yitJ leader RNA (to sequester free SAM) was added at 60, 180, and 300 sec as indicated. Background fluorescence was determined using samples containing buffer alone and was subtracted from fluorescence intensity values obtained with samples containing 2-AP labeled metK leader RNA. Experiments were repeated in quadruplicate.
lacZ fusions and β-galactosidase assays
B. subtilis strain BR151 containing an E. faecalis metK-lacZ translational fusion incorporated into the chromosome was described previously (Fuchs et al., 2006). Briefly, the E. faecalis metK leader sequence (including the first 15 nt of the coding region) was positioned downstream of a B. subtilis glyQS promoter, and was fused to codon 18 of lacZ in plasmid pFG328 (Grundy and Henkin, 1993). The construct was integrated into the B. subtilis chromosome using an SPβ prophage. Cells were grown in Spizizen minimal media (Anagnostopoulos and Spizizen, 1961) supplemented with methionine (335 μM) to early exponential phase. Cells were harvested and resuspended (at time zero; T0) in Spizizen minimal media with or without methionine. Alternatively, cells were grown in Spizizen minimal media without methionine for 120 min prior to addition of methionine or SAM. Aliquots were collected every 30 min for determination of cell density and β–galactosidase activity as previously described (Miller, 1972). Experiments were performed in duplicate.
Acknowledgments
We would like to thank Dr. Gary Dunny (University of Minnesota) for providing E. faecalis strains and developing the CDM medium. We would also like to thank Drs. Herve Roy, Rajat Banerjee, and Kurt Fredrick (The Ohio State University) for helpful discussion regarding pre-steady state kinetic experiments. This work was supported by National Institutes of Health Grant GM63615.
References
- Anagnostopoulos C, Spizizen J. Requirements for transformation in Bacillus subtilis. J Bacteriol. 1961;81:741–746. doi: 10.1128/jb.81.5.741-746.1961. [DOI] [PMC free article] [PubMed] [Google Scholar]
- Artsimovitch I, Henkin TM. In vitro approaches to analysis of transcription termination. Methods. 2009;47:37–43. doi: 10.1016/j.ymeth.2008.10.006. [DOI] [PMC free article] [PubMed] [Google Scholar]
- Coppins RL, Hall KB, Groisman EA. The intricate world of riboswitches. Curr Opin Microbiol. 2007;10:176–181. doi: 10.1016/j.mib.2007.03.006. [DOI] [PMC free article] [PubMed] [Google Scholar]
- Corbino KA, Barrick JE, Lim J, Welz R, Tucker BJ, Puskarz I, et al. Evidence for a second class of S-adenosylmethionine riboswitches and other regulatory RNA motifs in alpha-proteobacteria. Genome Biol. 2005;6:R70. doi: 10.1186/gb-2005-6-8-r70. [DOI] [PMC free article] [PubMed] [Google Scholar]
- Edwards TE, Klein DJ, Ferre-D’Amare AR. Riboswitches: small-molecule recognition by gene regulatory RNAs. Curr Opin Struct Biol. 2007;17:273–279. doi: 10.1016/j.sbi.2007.05.004. [DOI] [PubMed] [Google Scholar]
- Epshtein V, Mironov AS, Nudler E. The riboswitch-mediated control of sulfur metabolism in bacteria. Proc Natl Acad Sci U S A. 2003;100:5052–5056. doi: 10.1073/pnas.0531307100. [DOI] [PMC free article] [PubMed] [Google Scholar]
- Fuchs RT, Grundy FJ, Henkin TM. The SMK box is a new SAM-binding RNA for translational regulation of SAM synthetase. Nat Struct Mol Biol. 2006;13:226–233. doi: 10.1038/nsmb1059. [DOI] [PubMed] [Google Scholar]
- Fuchs RT, Grundy FJ, Henkin TM. S-adenosylmethionine directly inhibits binding of 30S ribosomal subunits to the SMK box translational riboswitch RNA. Proc Natl Acad Sci U S A. 2007;104:4876–4880. doi: 10.1073/pnas.0609956104. [DOI] [PMC free article] [PubMed] [Google Scholar]
- Gilbert SD, Rambo RP, Van Tyne D, Batey RT. Structure of the SAM-II riboswitch bound to S-adenosylmethionine. Nat Struct Mol Biol. 2008;15:177–182. doi: 10.1038/nsmb.1371. [DOI] [PubMed] [Google Scholar]
- Gold OG, Jordan HV, van Houte J. The prevalence of enterococci in the human mouth and their pathogenicity in animal models. Arch Oral Biol. 1975;20:473–477. doi: 10.1016/0003-9969(75)90236-8. [DOI] [PubMed] [Google Scholar]
- Grundy FJ, Henkin TM. tRNA as a positive regulator of transcription antitermination in B. subtilis. Cell. 1993;74:475–482. doi: 10.1016/0092-8674(93)80049-k. [DOI] [PubMed] [Google Scholar]
- Grundy FJ, Henkin TM. The S box regulon: a new global transcription termination control system for methionine and cysteine biosynthesis genes in Gram-positive bacteria. Mol Microbiol. 1998;30:737–749. doi: 10.1046/j.1365-2958.1998.01105.x. [DOI] [PubMed] [Google Scholar]
- Gutierrez-Preciado A, Henkin TM, Grundy FJ, Yanofsky C, Merino E. Biochemical features and functional implications of the RNA-based T-box regulatory mechanism. Microbiol Mol Biol Rev. 2009;73:36–61. doi: 10.1128/MMBR.00026-08. [DOI] [PMC free article] [PubMed] [Google Scholar]
- Henkin TM. Riboswitch RNAs: using RNA to sense cellular metabolism. Genes Dev. 2008;22:3383–3390. doi: 10.1101/gad.1747308. [DOI] [PMC free article] [PubMed] [Google Scholar]
- Lu C, Smith AM, Fuchs RT, Ding F, Rajashankar K, Henkin TM, Ke A. Crystal structures of the SAM-III/SMK riboswitch reveal the SAM-dependent translation inhibition mechanism. Nat Struct Mol Biol. 2008;15:1076–1083. doi: 10.1038/nsmb.1494. [DOI] [PMC free article] [PubMed] [Google Scholar]
- McDaniel BA, Grundy FJ, Artsimovitch I, Henkin TM. Transcription termination control of the S box system: direct measurement of S-adenosylmethionine by the leader RNA. Proc Natl Acad Sci U S A. 2003;100:3083–3088. doi: 10.1073/pnas.0630422100. [DOI] [PMC free article] [PubMed] [Google Scholar]
- McDaniel BA, Grundy FJ, Henkin TM. A tertiary structural element in S box leader RNAs is required for S-adenosylmethionine-directed transcription termination. Mol Microbiol. 2005;57:1008–1021. doi: 10.1111/j.1365-2958.2005.04740.x. [DOI] [PubMed] [Google Scholar]
- McDaniel BA, Grundy FJ, Kurlekar VP, Tomsic J, Henkin TM. Identification of a mutation in the Bacillus subtilis S-adenosylmethionine synthetase gene that results in derepression of S-box gene expression. J Bacteriol. 2006;188:3674–3681. doi: 10.1128/JB.188.10.3674-3681.2006. [DOI] [PMC free article] [PubMed] [Google Scholar]
- Miller J. Experiments in molecular genetics. Cold Spring Harbor Laboratory Press; Cold Spring Harbor, N.Y. USA: 1972. [Google Scholar]
- Montange RK, Batey RT. Structure of the S-adenosylmethionine riboswitch regulatory mRNA element. Nature. 2006;441:1172–1175. doi: 10.1038/nature04819. [DOI] [PubMed] [Google Scholar]
- Murray BE, Singh KV, Ross RP, Heath JD, Dunny GM, Weinstock GM. Generation of restriction map of Enterococcus faecalis OG1 and investigation of growth requirements and regions encoding biosynthetic function. J Bacteriol. 1993;175:5216–5223. doi: 10.1128/jb.175.16.5216-5223.1993. [DOI] [PMC free article] [PubMed] [Google Scholar]
- Ochi K, Kandala JC, Freese E. Initiation of Bacillus subtilis sporulation by the stringent response to partial amino acid deprivation. J Biol Chem. 1981;256:6866–6875. [PubMed] [Google Scholar]
- Sampson JR, Uhlenbeck OC. Biochemical and physical characterization of an unmodified yeast phenylalanine transfer RNA transcribed in vitro. Proc Natl Acad Sci U S A. 1988;85:1033–1037. doi: 10.1073/pnas.85.4.1033. [DOI] [PMC free article] [PubMed] [Google Scholar]
- Sudarsan N, Barrick JE, Breaker RR. Metabolite-binding RNA domains are present in the genes of eukaryotes. RNA. 2003;9:644–647. doi: 10.1261/rna.5090103. [DOI] [PMC free article] [PubMed] [Google Scholar]
- Thore S, Leibundgut M, Ban N. Structure of the eukaryotic thiamine pyrophosphate riboswitch with its regulatory ligand. Science. 2006;312:1208–1211. doi: 10.1126/science.1128451. [DOI] [PubMed] [Google Scholar]
- Tomsic J, McDaniel BA, Grundy FJ, Henkin TM. Natural variability in S-adenosylmethionine (SAM)-dependent riboswitches: S-box elements in Bacillus subtilis exhibit differential sensitivity to SAM in vivo and in vitro. J Bacteriol. 2008;190:823–833. doi: 10.1128/JB.01034-07. [DOI] [PMC free article] [PubMed] [Google Scholar]
- Wabiko H, Ochi K, Nguyen DM, Allen ER, Freese E. Genetic mapping and physiological consequences of metE mutations of Bacillus subtilis. J Bacteriol. 1988;170:2705–2710. doi: 10.1128/jb.170.6.2705-2710.1988. [DOI] [PMC free article] [PubMed] [Google Scholar]
- Winkler WC, Nahvi A, Sudarsan N, Barrick JE, Breaker RR. An mRNA structure that controls gene expression by binding S-adenosylmethionine. Nat Struct Biol. 2003;10:701–707. doi: 10.1038/nsb967. [DOI] [PubMed] [Google Scholar]