

Abstract
Objective
The goal of the study was to determine the predictive validity of neutrophil gelatinase-associated lipocalin (NGAL) in anticipating worsening of global and renal childhood-onset SLE (cSLE) disease activity.
Methods
111 patients with cSLE were enrolled in a longitudinal, prospective study with quarterly study visits and had at least three study visits. At each visit global disease activity was measured using three external standards: numerically converted BILAG index, SLEDAI-2K and physician assessment score. Renal and extrarenal disease activity were measured by the respective domain scores. The disease course over time was categorized at the most recent visit (persistently active, persistently inactive, improved or worsening). Plasma and urinary NGAL levels were measured by ELISA, and urinary NGAL was standardized to urinary creatinine. The longitudinal changes in NGAL levels were compared to the changes in SLE disease activity using mixed effects models.
Results
Significant increases in standardized urinary NGAL levels of up to 104% were detected up to three months before worsening of lupus nephritis (as measured by all three external standards). Plasma NGAL levels increased significantly by as much as 20% up to three months before worsening of global SLE disease activity as measured by all three external standards. Plasma NGAL levels increased significantly by 26% as early as three months prior to worsening of lupus nephritis as measured by the renal BILAG domain score.
Conclusion
Serial measurement of urinary and plasma NGAL levels may be valuable in predicting impending worsening of global and renal cSLE disease activity.
Keywords: Childhood-onset systemic lupus erythematosus, lupus nephritis, neutrophil gelatinase-associated lipocalin (NGAL), renal biomarker
Introduction
Lupus nephritis (LN) is very common in childhood-onset SLE (cSLE) (1–3). The onset of LN is usually early in the disease course within two years after the diagnosis of SLE is made (1, 4). The outcome is poor, and about 10% of cSLE patients with LN develop end-stage renal disease within 10 years (5).
Neutrophil gelatinase-associated lipocalin (NGAL) is a candidate biomarker for the early detection of LN (6). NGAL is one of the most highly up-regulated proteins in experimental acute kidney injury (7, 8). Urinary and plasma NGAL (U-NGAL and P-NGAL) predict acute kidney injury after cardiothoracic surgery with levels increasing within two hours after the insult (9). Additionally, NGAL is a good biomarker for chronic kidney disease, since U-NGAL and P-NGAL levels correlate better (inversely) with the glomerular filtration rate than serum creatinine (10).
Our group has previously shown that patients with cSLE and biopsy-proven LN have higher U-NGAL levels than healthy controls or patients with cSLE without LN, and that U-NGAL levels correlate with renal disease activity (11). In cross-sectional comparisons, patients with cSLE and worsening LN have higher U-NGAL levels than patients with stable or improved LN (12).
The goal of the current study was to investigate the association of longitudinal changes in P-NGAL and U-NGAL with changes in renal, extrarenal and global disease activity in cSLE.
Patients and Methods
Patients
With the approval of the participating centers' institutional review boards, patients fulfilling at least 4/11 of the revised American College of Rheumatology classification criteria for SLE prior to the age of 18 years were enrolled in this prospective study (13). Patients fell into three categories: (1) patients with newly diagnosed SLE, (2) patients with established SLE with biopsy-diagnosed LN, and (3) patients with established SLE for at least two years without urinary changes suggestive of LN. To be included in the analysis, patients (n=111) had at least three study visits. The study was a prospective, longitudinal trial with study visits every three months. Some of the patients and samples were part of previous studies of renal biomarkers (12, 14, 15).
Laboratory assays
Urine samples were centrifuged at 4°C, 4000g to remove cellular debris before storing. Plasma and urine samples were frozen within two hours from collection and stored at −80°C until the time of testing. P-NGAL and U-NGAL were measured by ELISA using a commercially available kit (Kit 036; AntibodyShop, Grusbakken, Denmark) as described in our previous reports (12). Urine creatinine was measured using a quantitative colorimetric microplate assay kit (Oxford Biomedical Research, Oxford, MI, USA). All measurements were made in duplicates. The laboratory personnel were blinded to the clinical data. U-NGAL excretion is presented as the amount of U-NGAL in ng per mg of urine creatinine to correct for differences in NGAL due to urine dilution. The P-NGAL concentration is presented in ng/ml plasma.
Childhood-onset SLE disease activity measures
At every study visit, global SLE disease activity was measured using three separate tools: (a) The British Isle Lupus Assessment Group (BILAG) index (16) measures disease activity in eight separate organ systems. While it was designed initially to reflect physicians' intent-to-treat with five categories (A, B, C, D, E), for this study, we used the numerical conversion as proposed by Stoll et al. (BILAG-Global; range 0–72) (17). (b) The SLE Disease Activity Index 2000 Version (SLEDAI-2K-Global; range 0–105). (c) Physician estimated global disease activity (MD-Global) on a 10 cm visual analog scale (VAS) (with 0 representing no disease activity and 10 representing maximal disease activity).
Similarly, for the estimation of renal SLE disease activity, we used three separate measures: (a) The BILAG renal domain score (BILAG-Renal; range 0–9), (b) the SLEDAI-2K renal domain score (range 0–16), and (c) the Physician estimated renal disease activity (MD-Renal) on a 10 cm VAS.
Extrarenal disease activity was measured using two tools: (a) The BILAG-Global minus the BILAG-Renal score (BILAG-Extrarenal; range 0–63) and (b) the SLEDAI-2K-Global minus the SLEDAI-2K-Renal score (SLEDAI-2K-Extrarenal; range 0–89). Both the BILAG and SLEDAI-2K disease activity measures are sensitive to change in cSLE (18).
Course of disease activity
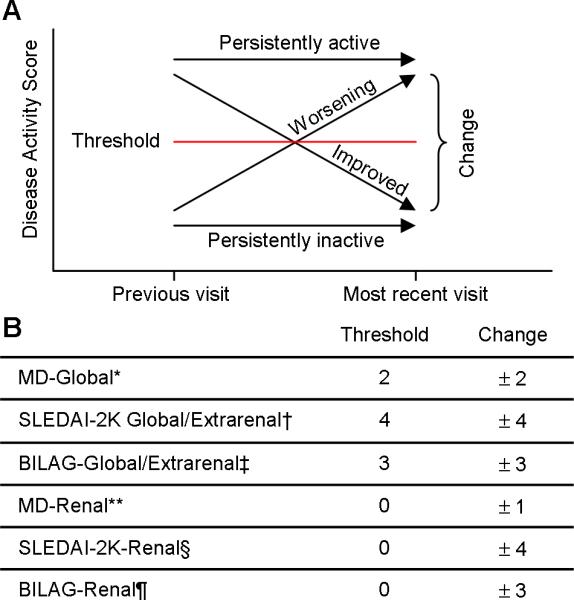
The cSLE disease course was categorized based on the change in disease activity at a reference time point (time 0). The respective disease activity scores were compared between two time points: the score at the time of the most recent visit (time 0) and the time of the preceding visit (time −1). For example, a patient with three study visits could have two reference time points at which the disease course was determined (at the second and the third visit). The disease course could fall into four categories: persistently active, persistently inactive, improved or worsening. Details on how these categories were established are presented in Figure 1. The parameters to define the disease courses were chosen by the authors (HB, PD) and considered to represent a conservative estimate of minimal clinically important change of disease (19, 20). The minimal clinically important change of disease in cSLE is likely smaller than in adult SLE; studies to prospectively validate these parameters in cSLE are currently underway (21).
Figure 1.
Categorization of the Disease Course with childhood-onset SLE
(A) The disease course was categorized as persistently active, persistently inactive, improved or worsening. For patients to be categorized as having persistently active (inactive) disease the disease activity score had to remain above (below) a predefined threshold and the change could not exceed a predefined magnitude. If the change exceeded a predefined magnitude, patients were categorized as having improved (if decreased score) or worsening (if increased score) disease activity. (B) The predefined thresholds and required changes are shown.
* MD-Global: Physician global assessment score measured on a 10 cm visual analog scale; 0 = inactive SLE.
** MD-Renal: Physician renal assessment score measured on a 10 cm visual analog scale; 0 = inactive SLE renal disease.
† SLEDAI-2K-Global/Extrarenal: Systemic Lupus Erythematosus Disease Activity Index 2000 Update global/extrarenal score; range 0 – 105/0–89; 0 = inactive SLE
§ SLEDAI-2K-Renal: Systemic Lupus Erythematosus Disease Activity Index 2000 Update renal score; range 0 – 16; 0 = inactive SLE renal disease.
‡ BILAG-Global/Extrarenal: British Isle Lupus Assessment Group global/extrarenal score; range 0–72/0–63; 0 = inactive SLE.
¶ BILAG-Renal: British Isle Lupus Assessment Group renal score; range 0–9; 0 = inactive SLE renal disease.
Statistical analysis
Both P-NGAL and U-NGAL (standardized by urine creatinine) levels were considered primary measures in this study. They were log transformed in order to fit major assumptions of parametric statistical models in analyses. For each NGAL measure, its change corresponding to a disease course category was assessed using a mixed effect model, adjusting for controlling covariates, mainly the demographics (22). Because each patient had multiple (at least 3) visits, a random effect (i.e. patients) was used in the mixed effect model to account for within-patient correlation during repeated observations. Post-hoc estimates of changes of means were performed simultaneously among all four categories of disease course and adjusted for individual type 1 errors using Tukey's method. Two types of NGAL changes, the change between time −1 and time 0 and the change between time −2 and time −1 were analyzed in the mixed effect models. Other numerical variables were summarized by mean ± standard deviation (SD) and binary or categorical variables were summarized by frequency (in %). Relationships between NGAL measures and disease activity scales were assessed using Pearson's and Spearman's correlation coefficients, respectively. In order to assess if NGAL levels at different time points are able to predict a worsening disease course, we applied multiple logistical regression models using the dichotomized disease course (worsening vs. not-worsening) as the dependent variable, NGAL measurements at different time points were used as predictors, and adjusted for the patients' demographics. The predicted logit of worsening was then transformed into the “predicted probability of worsening” for each case. A receiver-operating characteristics (ROC) curve was plotted by connecting sensitivity/specificity points under all possible probabilities of worsening. The area under the curve (AUC) was used to assess the overall accuracy. Sensitivity, specificity, positive predict value (PPV), and negative positive value (NPV) were also used to assess the discriminating and predicting performance of the NGAL measure using a specific threshold “predicted probability of worsening”. Excel XP (Microsoft, Redmond, WA) and SAS 9.1 (SAS Institute, Cary, NC) programs were used for analysis. P-values < 0.05 were considered statistically significant, and p-values < 0.1 were reported to show trends.
Results
Baseline patient characteristics and treatments
Table 1 summarizes the characteristics of the 111 patients included in the study. The mean age ± SD of the patients was 15.9 ± 3.4 years, and the majority of patients was female (82.4%). LN was classified according to the original system (23) as some biopsies were obtained prior to the introduction of the new system in 2004 (24). Biopsy-proven LN was present in 56.9% of the patients, often with class IV and class V LN. Frequently used anti-inflammatory medications included prednisone (77.1%), hydroxychloroquine (80.7%), mycophenolate mofetil (39.4%), cyclophosphamide (11.0%), and azathioprine (11.0%); 30.3% of patients were treated with angiotensin converting enzyme inhibitors at baseline.
Table 1.
Characteristics of 111 patients with childhood-onset Systemic Lupus Erythematosus (SLE) at the baseline study visit.
| Descriptor | Mean ± SD | N(% of total) |
|---|---|---|
| Age (years) | 15.9 ± 3.4 | |
| Sex – female | 89 (82.4) | |
| Number of visits | 5.2 ± 1.3 | |
| Months between visits | 3.4 ± 1.5 | |
| Race/Ethnicitv | ||
| White | 55 (50.5) | |
| Black | 36 (33.0) | |
| Asian | 14 (12.8) | |
| Hispanic | 13 (11.9) | |
| Biopsy-proven lupus nephritis † | 62 (56.9) | |
| WHO Class II | 2 (1.8) | |
| WHO Class III | 14 (12.8) | |
| WHO Class IV | 27 (24.8) | |
| WHO Class V | 16 (14.7) | |
| WHO Class III + V | 1 (0.9) | |
| WHO Class IV + V | 3 (2.8) | |
| Anti-double stranded DNA antibody positive | 56 (51.4) | |
| Medications at baseline | ||
| Prednisone | 84 (77.1) | |
| Cyclophosphamide | 12 (11.0) | |
| Mycophenolate mofetil | 43 (39.4) | |
| Azathioprine | 12 (11.0) | |
| Methotrexate | 3 (2.8) | |
| Hydroxychloroquine | 88 (80.7) | |
| Angiotensin converting enzyme inhibitor | 33 (30.3) |
Lupus nephritis (LN) was classified according to the revised 1995 criteria (23). Forty-nine of the 111 patients did not have SLE renal involvement. All patients with physician diagnosed SLE renal disease underwent a kidney biopsy.
Change in disease activity – disease course
Table 2 summarizes the mean disease activity during the study period and the proportions of the different disease courses at the reference time point. A total of 365 observations of reference time points were available for the longitudinal analyses. The most common disease course was a `persistently inactive' course, while a `worsening' course occurred less frequently (worsening of global disease activity: 9.6–15.1%, worsening of renal disease activity: 5.2–11.8%, worsening of extrarenal disease activity: 8.2–12.9%).
Table 2.
Disease activity and disease course during the study using the three external standards.
| MEASURES OF DISEASE ACTIVITY | BILAG | SLEDAI-2K | MD | ||||||
|---|---|---|---|---|---|---|---|---|---|
| Global | Renal | Extrarenal | Global | Renal | Extrarenal | Global | Renal | ||
| Average disease activity during the study † | 4.3 ± 4.0 | 1.4 ± 2.5 | 3.2 ± 3.3 | 4.9 ± 4.6 | 1.7 ± 3.2 | 3.2 ± 3.0 | 2.1 ± 2.6 | 1.2 ± 1.9 | |
|
| |||||||||
| Number (%) of observations per disease course ‡ | Persistently active | 83 (22.7) | 106 (29.0) | 60 (16.4) | 65 (17.8) | 35 (9.6) | 46 (12.6) | 47 (12.9) | 59 (16.6) |
|
| |||||||||
| Persistently inactive | 141 (38.6) | 205 (56.2) | 187 (51.2) | 181 (49.6) | 239 (65.5) | 249 (68.2) | 218 (60.1) | 166 (46.8) | |
|
| |||||||||
| Improved | 86 (23.6) | 35 (9.6) | 71 (19.5) | 71 (19.5) | 53 (14.5) | 40 (11.0) | 63 (17.4) | 88 (24.8) | |
|
| |||||||||
| Worsening | 55 (15.1) | 19 (5.2) | 47 (12.9) | 48 (13.2) | 38 (10.4) | 30 (8.2) | 35 (9.6) | 42 (11.8) | |
|
| |||||||||
| Total | 365 | 365 | 365 | 365 | 365 | 365 | 363 | 355 | |
Values represent Mean ± SD of disease activity during the study when using the different disease activity measures.
The number and percentage of different disease courses are shown according to the different disease activity measures.
For additional legend please see Figure 1.
Correlation between different measurements of disease activity
Using Spearman's rank correlation coefficients corrected for tied ranks, there were strong correlations between global and extrarenal disease activity (BILAG-Global vs. Extrarenal: r=0.79, p<0.0001; SLEDAI-2K-Global vs. Extrarenal: r=0.74, p<0.0001), between global and renal disease activity (BILAG-Global vs. Renal: r=0.59, p<0.0001; SLEDAI-2K-Global vs. Renal: r=0.63, p<0.0001, MD-Global vs. Renal: r=0.51, p<0.0001), and between the different tools (BILAG-Global vs. SLEDAI-2K-Global: r=0.60, p<0.0001; BILAG-Global vs. MD-Global: r=0.57, p<0.0001; SLEDAI-2K-Global vs. MD-Global: r=0.51, p<0.0001; BILAG-Renal vs. SLEDAI-2K-Renal: r=0.68, p<0.0001; BILAG-Renal vs. MD-Renal: r=0.69, p<0.0001; SLEDAI-2K-Renal vs. MD-Renal: r=0.69, p<0.0001; BILAG-Extrarenal vs. SLEDAI-2K-Extrarenal: r=0.47, p<0.0001). Renal and extrarenal disease activity were not correlated (BILAG-Renal vs. BILAG-Extrarenal: r=0.07, p<0.0001; SLEDAI-2K-Renal vs. SLEDAI-2K-Extrarenal: r=0.01, p<0.0001).
Distribution of plasma and U-NGAL levels and correlation between P-NGAL and U-NGAL levels
P-NGAL and U-NGAL levels were log-normally distributed in the study population (data not shown). Pearson's correlation using log-transformed P-NGAL and U-NGAL levels indicated that there was no correlation between P-NGAL and U-NGAL levels at any given study visit (r<0.01). Pearson's correlation using log-transformed standardized U-NGAL levels (ng/mg creatinine) and log-transformed absolute U-NGAL levels (ng/mL urine) demonstrated a high degree of correlation (r=0.81). U-NGAL levels are presented in all remaining results sections standardized to the urine creatinine concentration.
Longitudinal changes in plasma NGAL and change in global disease activity
The relationship between the course of global disease activity (BILAG-Global or SLEDAI-2K-Global) and longitudinal P-NGAL levels is shown in Table 3. Among patients who experienced worsening of global disease activity, there was a significant increase in P-NGAL levels, occurring between time −2 and time −1, i.e. approximately 6 to 3 months before the clinical diagnosis of a global flare was made. An identical pattern was observed when global disease activity was measured with the MD-Global; patients with worsening disease activity experienced an increase in P-NGAL between time −2 and time −1 from 57.4 (95% CI 47.9–68.8) to 72.7 ng/mL (95% CI 62.0–85.2) (p<0.001). None of the other disease courses (persistently active, persistently inactive or improved disease activity) were associated with a longitudinal change in P-NGAL levels. Only four patients with a `worsening' disease course (as measured by SLEDAI-2K-Global) at time 0 already had a `worsening' disease course at time −1. When excluding these patients from the analysis, similar results were obtained.
Table 3.
Longitudinal plasma neutrophil gelatinase-associated lipocalin (NGAL) levels and global, renal and extrarenal disease course*
| Course | Time −2 (T−2) | Time −1 (T−1) | Time 0 (T−1) | p values | |||||
|---|---|---|---|---|---|---|---|---|---|
| Tool | Mean | 95% CI‡ | Mean | 95%CI | Mean | 95% CI | T−2 vs T−1 | T−1 vs. T0 | |
| BILAG-Global | Active (n=83) | 57.0 | 49.2–66.0 | 57.8 | 50.7–65.8 | 60.9 | 54.5–68.0 | NS† | NS |
| Inactive (n=141) | 52.7 | 46.5–59.7 | 52.7 | 47.3–58.6 | 53.9 | 49.3–59.0 | NS | NS | |
| Improved (n=86) | 55.4 | 47.6–64.6 | 55.1 | 47.9–63.3 | 55.8 | 49.7–62.7 | NS | NS | |
| Worsening (n=55) | 54.7 | 46.3–64.8 | 65.0 | 56.1–75.4 | 67.8 | 59.7–77.0 | 0.007 | NS | |
| SLEDAI-2K-Global | Active (n=65) | 52.4 | 45.0–61.1 | 55.2 | 48.2–63.3 | 57.5 | 51.2–64.7 | NS | NS |
| Inactive (n=181) | 54.0 | 47.7–61.2 | 51.8 | 46.5–57.7 | 54.0 | 49.4–58.9 | NS | NS | |
| Improved (n=71) | 59.7 | 51.1–69.7 | 59.1 | 51.1–68.2 | 58.2 | 51.4–65.8 | NS | NS | |
| Worsening (n=48) | 52.6 | 45.2–61.2 | 63.2 | 55.5–72.1 | 65.2 | 58.0–73.4 | 0.001 | NS | |
| BILAG-Renal | Active (n=106) | 54.0 | 43.6–66.9 | 55.7 | 45.8–67.7 | 67.7 | 57.8–79.2 | NS | NS |
| Inactive (n=205) | 53.4 | 47.3–60.3 | 52.1 | 47.1–57.7 | 54.0 | 49.7–58.6 | NS | NS | |
| Improved (n=35) | 61.4 | 51.7–72.9 | 62.7 | 53.4–73.7 | 57.4 | 49.8–66.2 | NS | NS | |
| Worsening (n=19) | 51.1 | 42.8–61.1 | 64.5 | 55.5–75.0 | 59.7 | 51.7–68.8 | 0.0001 | NS | |
| SLEDAI-2K-Renal | Active (n=35) | 57.3 | 48.7–67.3 | 57.9 | 50.3–66.6 | 57.9 | 51.3–65.3 | NS | NS |
| Inactive (n=239) | 49.4 | 43.0–56.7 | 50.1 | 44.4–56.4 | 53.5 | 48.6–59.0 | NS | 0.05 | |
| Improved (n=53) | 57.8 | 50.0–66.8 | 58.4 | 51.1–66.6 | 58.8 | 52.7–65.8 | NS | NS | |
| Worsening (n=38) | 62.6 | 52.0–75.3 | 68.0 | 57.3–80.7 | 67.7 | 68.0–79.2 | NS | NS | |
| BILAG-Extrarenal | Active (n=60) | 61.4 | 52.0–72.5 | 65.3 | 56.3–75.6 | 67.5 | 59.5–76.6 | NS | NS |
| Inactive (n=187) | 52.8 | 46.8–59.6 | 52.3 | 47.2–58.0 | 53.5 | 49.2–58.1 | NS | NS | |
| Improved (n=71) | 53.6 | 46.0–62.4 | 55.7 | 48.5–64.0 | 59.1 | 52.4–66.6 | NS | NS | |
| Worsening (n=47) | 55.3 | 46.8–65.5 | 62.9 | 54.0–73.2 | 64.5 | 56.5–73.6 | 0.07 | NS | |
| SLEDAI-2K-Extrarenal | Active (n=46) | 52.3 | 43.6–62.7 | 56.6 | 48.2–66.5 | 59.4 | 51.8–68.1 | NS | NS |
| Inactive (n=249) | 55.0 | 48.8–61.9 | 54.8 | 49.6–60.5 | 55.2 | 50.9–59.8 | NS | NS | |
| Improved (n=40) | 53.4 | 44.0–64.9 | 55.0 | 45.8–66.1 | 57.7 | 49.4–67.3 | NS | NS | |
| Worsening (n=30) | 53.1 | 44.4–63.5 | 60.9 | 51.7–71.6 | 70.1 | 60.9–80.8 | 0.07 | 0.02 | |
Time 0 = reference time point at which the disease course was defined; Time −1 = time point one visit prior to the reference time point; Time −2 = time point two visits prior to the reference time point. Shaded areas point out statistically significant comparisons over time.
NS = not significant
CI = confidence interval
n = the number of observations for each disease course
For additional legend please see Figure 1.
Longitudinal changes in P-NGAL and change in renal disease activity
Patients with worsening renal disease activity as measured by the BILAG-Renal experienced a significant increase in P-NGAL level between time −2 and time −1. A similar pattern was observed with the MD-Renal; the group of patients with worsening disease activity experienced an increase in plasma NGAL between time −2 and time −1 from 53.6 (95% CI 42.2–68.1) to 73.4 ng/mL (95% CI 59.7–90.3) (p<0.001). Such increases did not reach significance when using the SLEDAI-2K-Renal (see Table 3). P-NGAL was not predictive of any other LN disease course (active, inactive or improved).
Longitudinal changes in U-NGAL and LN disease course
Patients with worsening BILAG-Renal or SLEDAI-2K-Renal experienced, on average, a significant increase in U-NGAL level between time points time −2 and time −1 of 70% (SLEDAI-2K-Renal) and 104% (BILAG-Renal). A similar increase was seen when renal disease activity was measured by the MD-Renal; the group of patients with worsening LN experienced an increase in U-NGAL between time −2 and time −1 from 10.1 (95% CI 6.5–15.7) to 17.2 (95% CI 10.7–27.8) (p=0.04), while with none of the other diseases courses a significant change of U-NGAL occurred during that interval. Only four patients with a `worsening' disease course at time 0 already had a `worsening' disease course at time −1. The exclusion of these patients from the analysis yielded similar results.
There was a significant concurrent increase in U-NGAL in patients that had persistently inactive disease at the reference time point. This significant increase was due to a subgroup of patients that experienced worsening at the subsequent time point (SLEDAI-2k-Renal: p = 0.05) while patients that continued to have inactive disease at the subsequent time point did not experience a significant increase in U-NGAL (data not shown). These properties of U-NGAL are summarized using ROC analysis, using a dichotomized outcome (worsening vs. not-worsening of LN). The sensitivity, specificity, positive (PPV) and negative predictive values (PPV) were calculated for the resulting “predicted probability of worsening” (Figure 2). When using the SLEDAI-2K-Renal as the external standard, the resulting area-under-the-curve (AUC) was 0.78 and, when using the BILAG-Renal as the external standard, the resulting AUC was 0.80.
Figure 2.

ROC curves of predicting worsening of renal disease activity.
The sensitivity, specificity of the predicted probability of worsening, estimated from multivariate logistic regression, are represented, using (A) the SLEDAI-2K-Renal as the external standard (AUC = 0.78) “and (B) the BILAG-Renal as the external standard (AUC = 0.80).
There was no statistically important relationship between the course of global or extrarenal disease and U-NGAL levels over time.
Discussion
The longitudinal data presented in this study demonstrate that an increase in U-NGAL anticipates worsening of cSLE renal disease activity. Additionally, an increase in plasma NGAL anticipates worsening of global and renal cSLE disease activity. Therefore, U-NGAL and P-NGAL are excellent candidates for predictive biomarkers for worsening of cSLE renal and global disease activity, respectively.
SLE often follows a relapsing-remitting disease course (25). Treatment is often only initiated once disease activity is severe and damage has occurred due to the difficulty in predicting worsening of SLE disease activity. Given the high morbidity and mortality in cSLE with frequent and severe LN (3, 26), the identification of predictive biomarkers that can anticipate worsening of LN is highly desirable. The early recognition of worsening LN, however, is difficult using routinely available laboratory tests. For example, anti-double-stranded DNA (anti-dsDNA) antibodies may increase prior to the worsening of LN (27–29) but only 50% of patients with cSLE renal disease test positive for anti-dsDNA antibodies (2). In addition, anti-dsDNA antibodies sometimes decrease concurrently with acute SLE flares, possibly due to increased tissue deposition (30), demonstrating a complex relationship between anti-dsDNA levels and SLE disease activity. Serum levels of the complement components C3 and C4 decrease often concurrently with renal flares, and, thus, have little predictive value (31). Other routine tests used to evaluate renal function, such as serum creatinine, urine protein and examination of the urine sediment, vary not only with LN activity but also with the presence of renal damage (32).
Additionally, there is no statistically important relationship between the future course of global, renal or extrarenal disease and serum complement C3 and C4 levels and the urine protein-to-creatinine ratio in our patient population. This information has been published for the presented patient cohort (15).
One of the difficulties in studying biomarkers for LN has been the absence of a noninvasive criterion standard. While kidney biopsy is the gold standard to diagnose LN, it is impractical to perform repeated biopsies to screen for worsening of LN. Alternative external standards must be used for the assessment of LN and global SLE disease activity, including the BILAG and SLEDAI-2K summary and renal domain scores. For this study, we quantified global and renal disease activity using three external standards (two for extrarenal domains) to ensure that relationships between and NGAL and cSLE disease courses did not represent spurious findings. The BILAG index has been developed from the perspective of physicians' intent-to-treat to provide a snapshot of SLE activity per organ involvement rather than to supply a global disease activity score (33). Conversely, the SLEDAI-2K have been designed as global assessment tools for SLE disease activity (34). There were strong correlations among the different tools for the assessment of global, renal and extrarenal disease activity, supporting the concurrent validity of these measures in our study.
NGAL is a small, glycosylated (25 kDa) protein produced in multiple normal tissues and organs, including epithelial tissues, endothelium and bone marrow and its production is increased in neoplastic and inflammatory conditions (35, 36). U-NGAL increases markedly and immediately following acute kidney injury (37). Similarly, U-NGAL is elevated with chronic kidney disease, correlating with disease severity (10, 38).
Previously, we and others have shown that U-NGAL is an excellent biomarker of concurrent LN activity. Patients with active LN have significantly higher U-NGAL levels when compared cross-sectionally to patients with inactive LN and healthy controls (11); patients with worsening LN have higher U-NGAL levels when compared to patients with stable or improving LN (12).
Our longitudinal prospective study has allowed us to examine whether NGAL anticipates future course of cSLE. One impressive result of our study is the marked increase in U-NGAL levels up to three months prior to worsening LN activity, irrespective of the external standard used. Our data also demonstrate a significant increase of P-NGAL up to three months prior to worsening of global SLE disease activity and a significant increase of plasma NGAL prior to worsening of renal disease activity. P-NGAL increased also prior to worsening of extrarenal SLE disease activity but changes did not reach statistical significance.
At the present, reasons why U-NGAL and P-NGAL may raise before clinically detectable worsening of LN remain speculative. One possibility may be that the kinetics and specificity of the molecule are different from other biomarkers. U-NGAL may be an immediate-early marker of general kidney injury, as is supported by the findings reported in acute kidney injury. Another possibility may be that NGAL is produced after SLE-specific glomerular or tubular injury. While in acute kidney injury the most likely source of U-NGAL is the distal tubules, the source of U-NGAL in LN is less clear. The observed increase in U-NGAL may result from increased glomerular protein loss and disturbed reabsorption in the proximal nephron segment in addition to increased intrarenal production. Furthermore, the glomerulus may represent a source of NGAL, based on results from experimental studies. Mesangial cells treated in vitro with nephritogenic murine anti-dsDNA antibodies overexpress NGAL, indicating mesangial cells as a possible source (39). Additionally, a murine model of crescentic glomerulonephritis suggests that glomerular epithelial cells are a possible source of NGAL (40). The increase in P-NGAL prior to worsening of LN but not prior to worsening of extrarenal cSLE suggests a prominent role of LN in increasing P-NGAL levels. Similar findings are seen in other types of chronic kidney disease, with an inverse correlation between P-NGAL levels and glomerular filtration rate (41). Several mechanisms may be postulated. Kidney injury results in a dramatically increased NGAL mRNA expression in distant organs, especially the liver and lungs, and the over-expressed NGAL protein may constitute a distinct systemic pool (42). Additional contributions to the systemic pool may derive from NGAL released from neutrophils and macrophages. Furthermore, any decrease in glomerular filtration rate resulting from kidney injury would be expected to decrease the renal clearance of NGAL, with subsequent accumulation in the systemic circulation. The relative contribution of these mechanisms to the rise in P-NGAL after acute kidney injury and in LN remains to be determined.
Some of the problems in clinical use of NGAL may include its nonspecific nature, i.e. the fact that U-NGAL increases also after various other types of kidney injury, including ischemic and toxic injury. We anticipate that U-NGAL may eventually be used in concert with other biomarkers to better understand the nature of the underlying renal insult. Studies to identify and validate additional biomarkers for LN are currently underway (14, 15, 43).
In summary, we demonstrated that U-NGAL may anticipate the development or worsening of LN in cSLE. In addition, an increase in P-NGAL may anticipate worsening of global and renal disease activity. As with all initial biomarker validation studies, confirmation of our findings in other cohorts are warranted. Future studies are needed to verify that NGAL is a predictive biomarker in an independent patient cohort, preferably one with cSLE and adult SLE. The early identification of patients at risk would be extremely helpful in order to initiate treatment early with the eventual goal being the avoidance of longterm morbidity and mortality due to LN and SLE.
Table 4.
Urinary neutrophil gelatinase-associated lipocalin (NGAL) levels over time and the future course of LN†
| Course | Time −2 (T−2) | Time −1 (T−1) | Time 0 (T0) | p values | |||||
|---|---|---|---|---|---|---|---|---|---|
| Tool | Mean | 95% CI | Mean | 95%CI | Mean | 95% CI | T−2 vs. T−1 | T−1 vs. T0 | |
| BILAG-Renal | Active (n=106) | 12.7 | 9.6–16.9 | 14.7 | 10.1–21.4 | 16.9 | 11.5–24.8 | NS | NS |
| Inactive (n=205) | 8.3 | 6.5–10.6 | 10.8 | 7.9–14.7 | 16.0 | 12.1–21.2 | NS | 0.002 | |
| Improved (n=35) | 8.6 | 5.1–14.6 | 9.0 | 4.4–18.6 | 8.4 | 4.1–17.3 | NS | NS | |
| Worsening (n=19) | 11.1 | 6.1–20.1 | 22.6 | 12.7–40.4 | 43.8 | 25.1–76.3 | 0.01 | 0.02 | |
| SLEDAI-2K-Renal | Active (n=35) | 24.8 | 15.3–40.0 | 23.4 | 11.7–46.5 | 25.9 | 13.4–50.3 | NS | NS |
| Inactive (n=239) | 7.6 | 6.0–9.6 | 9.6 | 7.1–13.1 | 13.5 | 10.2–17.9 | NS | 0.007 | |
| Improved (n=53) | 13.3 | 9.0–19.7 | 11.4 | 5.9–21.9 | 14.8 | 8.3–26.3 | NS | NS | |
| Worsening (n=38) | 10.3 | 6.9–15.5 | 17.5 | 11.2–27.2 | 27.3 | 17.3–42.8 | 0.03 | 0.06 | |
Acknowledgement
CCHMC: Drs. Michael Bennett (discussion), Thelma Kathman and Qing Ma (both: technical assistance), Dr. Susan Thompson (sample storage), Drs. Bob Colbert, Thomas Griffin, Alexei Grom, Daniel Lovell (all data collection); Shannen Nelson (study coordinating center study nurse), Jamie Meyers-Eaton (study coordinator), and Shweta Srivastava (sample processing). Dr. Amber Khan, Clinical Fellow, (data entry). Aimee Baker (manuscript preparation).
University of Oklahoma: Drs. James N. Jarvis and Michael Hendrickson (data collection), Lisa Kempke, Tracy Fuelling, Kathy Redmond and Linda Menifee (study coordinators).
Hackensack University Medical Center: Drs. Yukiko Kimura, Suzanne Li and Jennifer Weiss (data collection); Mary Ellen Riordan (study coordination).
Children's Hospital of British Columbia: Drs. David Cabral, Ross Petty, Kristin Houghton, Stuart Turvey, Jaime Guzman and Peter Malleson (data collection); Dr. America Uribe and Tony Hong (study coordinators).
Hospital for Sick Children, Toronto: Lawrence Ng (study coordinator).
Rainbow Babies & Children's Hospital, Cleveland: Dr. Elizabeth Brooks (data collection), Michelle Walette (study coordinator).
University of Chicago: Dr. Linda Wagner-Weiner (data collection), Becky Puplava (study coordinator).
Northwestern University, Chicago: Blair Dina (study coordinator).
Medical College of Wisconsin, and Children's Research Institute, Milwaukee: Drs. James Nocton and Calvin Williams and Elizabeth Roth-Wojicki, PNP (data collection), Marsha Malloy (data collection and site coordination), Joshua Kapfhamer and Noshaba Khan (both study coordinators).
GRANT SUPPORT: This study was supported by the NIH (clinical research grant P60-AR-47784 from the National Institute of Arthritis and Musculoskeletal and Skin Diseases). Dr. Brunner's work was supported by a grant from the Alliance for Lupus Research. Dr. Devarajan's work was supported by the NIH (R01 DK069749; RO1 HL08676) and by the Department of Defense (PR064328).
Footnotes
DISCLOSURES: Cincinnati Children's Hospital has signed an exclusive licensing agreement with Abbott Diagnostics for the development of urinary neutrophil gelatinase–associated lipocalin as a biomarker of kidney damage, and with Biosite Inc. for the development of plasma neutrophil gelatinase–associated lipocalin as a biomarker of kidney damage
References
- 1.Font J, Cervera R, Espinosa G, Pallares L, Ramos-Casals M, Jimenez S, et al. Systemic lupus erythematosus (SLE) in childhood: analysis of clinical and immunological findings in 34 patients and comparison with SLE characteristics in adults. Ann Rheum Dis. 1998;57(8):456–9. doi: 10.1136/ard.57.8.456. [DOI] [PMC free article] [PubMed] [Google Scholar]
- 2.Hoffman IE, Lauwerys BR, de Keyser F, Huizinga TW, Isenberg DA, Cebecauer L, et al. Juvenile onset systemic lupus erythematosus: different clinical and serological pattern compared to adult onset systemic lupus erythematosus. Ann Rheum Dis. 2008 doi: 10.1136/ard.2008.094813. [DOI] [PubMed] [Google Scholar]
- 3.Brunner HI, Gladman DD, Ibanez D, Urowitz MD, Silverman ED. Difference in disease features between childhood-onset and adult-onset systemic lupus erythematosus. Arthritis Rheum. 2008;58(2):556–62. doi: 10.1002/art.23204. [DOI] [PubMed] [Google Scholar]
- 4.Bogdanovic R, Nikolic V, Pasic S, Dimitrijevic J, Lipkovska-Markovic J, Eric-Marinkovic J, et al. Lupus nephritis in childhood: a review of 53 patients followed at a single center. Pediatr Nephrol. 2004;19(1):36–44. doi: 10.1007/s00467-003-1278-y. [DOI] [PubMed] [Google Scholar]
- 5.Hagelberg S, Lee Y, Bargman J, Mah G, Schneider R, Laskin C, et al. Longterm followup of childhood lupus nephritis. J Rheumatol. 2002;29(12):2635–42. [PubMed] [Google Scholar]
- 6.Rubinstein T, Pitashny M, Putterman C. The novel role of neutrophil gelatinase-B associated lipocalin (NGAL)/Lipocalin-2 as a biomarker for lupus nephritis. Autoimmun Rev. 2008;7(3):229–34. doi: 10.1016/j.autrev.2007.11.013. [DOI] [PubMed] [Google Scholar]
- 7.Supavekin S, Zhang W, Kucherlapati R, Kaskel FJ, Moore LC, Devarajan P. Differential gene expression following early renal ischemia/reperfusion. Kidney Int. 2003;63(5):1714–24. doi: 10.1046/j.1523-1755.2003.00928.x. [DOI] [PubMed] [Google Scholar]
- 8.Yuen PS, Jo SK, Holly MK, Hu X, Star RA. Ischemic and nephrotoxic acute renal failure are distinguished by their broad transcriptomic responses. Physiol Genomics. 2006;25(3):375–86. doi: 10.1152/physiolgenomics.00223.2005. [DOI] [PMC free article] [PubMed] [Google Scholar]
- 9.Mishra J, Dent C, Tarabishi R, Mitsnefes MM, Ma Q, Kelly C, et al. Neutrophil gelatinase-associated lipocalin (NGAL) as a biomarker for acute renal injury after cardiac surgery. Lancet. 2005;365(9466):1231–8. doi: 10.1016/S0140-6736(05)74811-X. [DOI] [PubMed] [Google Scholar]
- 10.Bolignano D, Lacquaniti A, Coppolino G, Campo S, Arena A, Buemi M. Neutrophil gelatinase-associated lipocalin reflects the severity of renal impairment in subjects affected by chronic kidney disease. Kidney Blood Press Res. 2008;31(4):255–8. doi: 10.1159/000143726. [DOI] [PubMed] [Google Scholar]
- 11.Brunner HI, Mueller M, Rutherford C, Passo MH, Witte D, Grom A, et al. Urinary neutrophil gelatinase-associated lipocalin as a biomarker of nephritis in childhood-onset systemic lupus erythematosus. Arthritis Rheum. 2006;54(8):2577–84. doi: 10.1002/art.22008. [DOI] [PubMed] [Google Scholar]
- 12.Suzuki M, Wiers KM, Klein-Gitelman MS, Haines KA, Olson J, Onel KB, et al. Neutrophil gelatinase-associated lipocalin as a biomarker of disease activity in pediatric lupus nephritis. Pediatr Nephrol. 2008;23(3):403–12. doi: 10.1007/s00467-007-0685-x. [DOI] [PubMed] [Google Scholar]
- 13.Hochberg MC. Updating the American College of Rheumatology revised criteria for the classification of systemic lupus erythematosus. Arthritis Rheum. 1997;40(9):1725. doi: 10.1002/art.1780400928. [DOI] [PubMed] [Google Scholar]
- 14.Suzuki M, Ross GF, Wiers K, Nelson S, Bennett M, Passo MH, et al. Identification of a urinary proteomic signature for lupus nephritis in children. Pediatr Nephrol. 2007;22(12):2047–57. doi: 10.1007/s00467-007-0608-x. [DOI] [PubMed] [Google Scholar]
- 15.Suzuki M, Wiers K, Brooks EB, Greis KD, Haines K, Klein-Gitelman MS, et al. Initial Validation of a Novel Protein Biomarker Panel for Active Pediatric Lupus Nephritis. Pediatr Res. 2009 doi: 10.1203/PDR.0b013e31819e4305. [DOI] [PMC free article] [PubMed] [Google Scholar]
- 16.Hay EM, Bacon PA, Gordon C, Isenberg DA, Maddison P, Snaith ML, et al. The BILAG index: a reliable and valid instrument for measuring clinical disease activity in systemic lupus erythematosus. Q J Med. 1993;86(7):447–58. [PubMed] [Google Scholar]
- 17.Stoll T, Stucki G, Malik J, Pyke S, Isenberg DA. Further validation of the BILAG disease activity index in patients with systemic lupus erythematosus. Ann Rheum Dis. 1996;55(10):756–60. doi: 10.1136/ard.55.10.756. [DOI] [PMC free article] [PubMed] [Google Scholar]
- 18.Brunner HI, Feldman BM, Bombardier C, Silverman ED. Sensitivity of the Systemic Lupus Erythematosus Disease Activity Index, British Isles Lupus Assessment Group Index, and Systemic Lupus Activity Measure in the evaluation of clinical change in childhood-onset systemic lupus erythematosus. Arthritis Rheum. 1999;42(7):1354–60. doi: 10.1002/1529-0131(199907)42:7<1354::AID-ANR8>3.0.CO;2-4. [DOI] [PubMed] [Google Scholar]
- 19.Gladman DD, Urowitz MB, Kagal A, Hallett D. Accurately describing changes in disease activity in Systemic Lupus Erythematosus. J Rheumatol. 2000;27(2):377–9. [PubMed] [Google Scholar]
- 20.Gordon C, Sutcliffe N, Skan J, Stoll T, Isenberg DA. Definition and treatment of lupus flares measured by the BILAG index. Rheumatology (Oxford) 2003;42(11):1372–9. doi: 10.1093/rheumatology/keg382. [DOI] [PubMed] [Google Scholar]
- 21.Sagcal-Gironella AC, Lapidus SK, Higgins GC, Ying J, Graham TB, Onel KB, et al. Minimal Clinically Important Difference (MCID) of SLE Disease Activity Measures When Used In Childhood Systemic Lupus Erythematosus(cSLE). American College of Rheumatology 2008 Annual Scientific Meeting; San Francisco. 2008. [Google Scholar]
- 22.Searle SR, Casella G, McCulloch CE. Variance components. Wiley; New York: 1992. [Google Scholar]
- 23.Churg J, Bernstein J, Glassock RJ. Renal disease : classification and atlas of glomerular diseases. 2nd ed. Igaku-Shoin; New York: 1995. [Google Scholar]
- 24.Weening JJ, D'Agati VD, Schwartz MM, Seshan SV, Alpers CE, Appel GB, et al. The classification of glomerulonephritis in systemic lupus erythematosus revisited. J Am Soc Nephrol. 2004;15(2):241–50. doi: 10.1097/01.asn.0000108969.21691.5d. [DOI] [PubMed] [Google Scholar]
- 25.Dubois EL, Tuffanelli DL. Clinical Manifestations of Systemic Lupus Erythematosus. Computer Analysis of 520 Cases. Jama. 1964;190:104–11. doi: 10.1001/jama.1964.03070150014003. [DOI] [PubMed] [Google Scholar]
- 26.Levy M, Montes de Oca M, Claude-Babron M. Unfavorable outcomes (end-stage renal failure/death) in childhood onset systemic lupus erythematosus. A multicenter study in Paris and its environs. Clin Exp Rheumatol. 1994;12(Suppl 10):S63–8. [PubMed] [Google Scholar]
- 27.Swaak AJ, Groenwold J, Aarden LA, Statius van Eps LW, Feltkamp EW. Prognostic value of anti-dsDNA in SLE. Ann Rheum Dis. 1982;41(4):388–95. doi: 10.1136/ard.41.4.388. [DOI] [PMC free article] [PubMed] [Google Scholar]
- 28.Swaak AJ, Groenwold J, Bronsveld W. Predictive value of complement profiles and anti-dsDNA in systemic lupus erythematosus. Ann Rheum Dis. 1986;45(5):359–66. doi: 10.1136/ard.45.5.359. [DOI] [PMC free article] [PubMed] [Google Scholar]
- 29.ter Borg EJ, Horst G, Hummel EJ, Limburg PC, Kallenberg CG. Measurement of increases in anti-double-stranded DNA antibody levels as a predictor of disease exacerbation in systemic lupus erythematosus. A long-term, prospective study. Arthritis Rheum. 1990;33(5):634–43. doi: 10.1002/art.1780330505. [DOI] [PubMed] [Google Scholar]
- 30.Ho A, Magder LS, Barr SG, Petri M. Decreases in anti-double-stranded DNA levels are associated with concurrent flares in patients with systemic lupus erythematosus. Arthritis Rheum. 2001;44(10):2342–9. doi: 10.1002/1529-0131(200110)44:10<2342::aid-art397>3.0.co;2-8. [DOI] [PubMed] [Google Scholar]
- 31.Ho A, Barr SG, Magder LS, Petri M. A decrease in complement is associated with increased renal and hematologic activity in patients with systemic lupus erythematosus. Arthritis Rheum. 2001;44(10):2350–7. doi: 10.1002/1529-0131(200110)44:10<2350::aid-art398>3.0.co;2-a. [DOI] [PubMed] [Google Scholar]
- 32.Zappitelli M, Duffy CM, Bernard C, Gupta IR. Evaluation of activity, chronicity and tubulointerstitial indices for childhood lupus nephritis. Pediatr Nephrol. 2008;23(1):83–91. doi: 10.1007/s00467-007-0619-7. [DOI] [PubMed] [Google Scholar]
- 33.Isenberg DA. BILAG, SLEDAI, SIS, ECLAM, WAM, SLAM …. thank you MAM. Lupus. 2007;16(11):849–51. doi: 10.1177/0961203307085124. [DOI] [PubMed] [Google Scholar]
- 34.Gladman DD, Ibanez D, Urowitz MB. Systemic lupus erythematosus disease activity index 2000. J Rheumatol. 2002;29(2):288–91. [PubMed] [Google Scholar]
- 35.Cowland JB, Borregaard N. Molecular characterization and pattern of tissue expression of the gene for neutrophil gelatinase-associated lipocalin from humans. Genomics. 1997;45(1):17–23. doi: 10.1006/geno.1997.4896. [DOI] [PubMed] [Google Scholar]
- 36.Cowland JB, Sorensen OE, Sehested M, Borregaard N. Neutrophil gelatinase-associated lipocalin is up-regulated in human epithelial cells by IL-1 beta, but not by TNF-alpha. J Immunol. 2003;171(12):6630–9. doi: 10.4049/jimmunol.171.12.6630. [DOI] [PubMed] [Google Scholar]
- 37.Mishra J, Ma Q, Prada A, Mitsnefes M, Zahedi K, Yang J, et al. Identification of neutrophil gelatinase-associated lipocalin as a novel early urinary biomarker for ischemic renal injury. J Am Soc Nephrol. 2003;14(10):2534–43. doi: 10.1097/01.asn.0000088027.54400.c6. [DOI] [PubMed] [Google Scholar]
- 38.Bolignano D, Donato V, Coppolino G, Campo S, Buemi A, Lacquaniti A, et al. Neutrophil gelatinase-associated lipocalin (NGAL) as a marker of kidney damage. Am J Kidney Dis. 2008;52(3):595–605. doi: 10.1053/j.ajkd.2008.01.020. [DOI] [PubMed] [Google Scholar]
- 39.Qing X, Zavadil J, Crosby MB, Hogarth MP, Hahn BH, Mohan C, et al. Nephritogenic anti-DNA antibodies regulate gene expression in MRL/lpr mouse glomerular mesangial cells. Arthritis Rheum. 2006;54(7):2198–210. doi: 10.1002/art.21934. [DOI] [PubMed] [Google Scholar]
- 40.Ka SM, Rifai A, Chen JH, Cheng CW, Shui HA, Lee HS, et al. Glomerular crescent-related biomarkers in a murine model of chronic graft versus host disease. Nephrol Dial Transplant. 2006;21(2):288–98. doi: 10.1093/ndt/gfi229. [DOI] [PubMed] [Google Scholar]
- 41.Mitsnefes MM, Kathman TS, Mishra J, Kartal J, Khoury PR, Nickolas TL, et al. Serum neutrophil gelatinase-associated lipocalin as a marker of renal function in children with chronic kidney disease. Pediatr Nephrol. 2007;22(1):101–8. doi: 10.1007/s00467-006-0244-x. [DOI] [PubMed] [Google Scholar]
- 42.Devarajan P. Neutrophil gelatinase-associated lipocalin--an emerging troponin for kidney injury. Nephrol Dial Transplant. 2008 doi: 10.1093/ndt/gfn531. [DOI] [PMC free article] [PubMed] [Google Scholar]
- 43.Wu T, Xie C, Wang HW, Zhou XJ, Schwartz N, Calixto S, et al. Elevated urinary VCAM-1, P-selectin, soluble TNF receptor-1, and CXC chemokine ligand 16 in multiple murine lupus strains and human lupus nephritis. J Immunol. 2007;179(10):7166–75. doi: 10.4049/jimmunol.179.10.7166. [DOI] [PubMed] [Google Scholar]