

Abstract
Collective cell migration in tissues occurs throughout embryonic development, during wound healing, and in cancerous tumor invasion, yet most detailed knowledge of cell migration comes from single-cell studies. As single cells migrate, the shape of the cell body fluctuates dramatically through cyclic processes of extension, adhesion, and retraction, accompanied by erratic changes in migration direction. Within confluent cell layers, such subcellular motions must be coupled between neighbors, yet the influence of these subcellular motions on collective migration is not known. Here we study motion within a confluent epithelial cell sheet, simultaneously measuring collective migration and subcellular motions, covering a broad range of length scales, time scales, and cell densities. At large length scales and time scales collective migration slows as cell density rises, yet the fastest cells move in large, multicell groups whose scale grows with increasing cell density. This behavior has an intriguing analogy to dynamic heterogeneities found in particulate systems as they become more crowded and approach a glass transition. In addition we find a diminishing self-diffusivity of short-wavelength motions within the cell layer, and growing peaks in the vibrational density of states associated with cooperative cell-shape fluctuations. Both of these observations are also intriguingly reminiscent of a glass transition. Thus, these results provide a broad and suggestive analogy between cell motion within a confluent layer and the dynamics of supercooled colloidal and molecular fluids approaching a glass transition.
Keywords: active matter, cell mechanics, jamming, collective cell dynamics, nonequilibrium
The collective motion of cells within a tissue is a fundamental biological process, both in health and in disease; for example it is essential to embryonic morphogenesis, organ regeneration, and wound repair (1–4). However, while the motion of individual cells is well understood, collective motion of a large number of cells such as in tissues is only understood in specific instances. Moreover, the transition of the motion of single cells to the collective motion of many cells has not been as extensively studied. This transition is well represented by single monolayers of cells; as they become confluent, the motion of the cells becomes increasingly collective, depending on the presence of their neighbors (5). During collective migration within confluent cell layers, cell sheets flow like a fluid yet remain fixed and solid-like at short time scales, with the motion of each cell constrained by the crowding due to its neighbors (5–7). This solid-like character over short times and collective flow over longer times is reminiscent of many crowded particulate systems, which undergo a transition from a supercooled fluid-like state to a glass-like state. By analogy, the collective motion of cells might be described by a similar transition: as cell density rises, neighboring cells restrict the motion of each cell, forcing cells to move in groups. However, single cells are highly deformable and their motions are self-generated; thus to understand the duality of the fluid-like and solid-like properties of a cell layer, it is essential to measure cell motion at both the multi and subcell scale. Moreover, cell shape can exhibit significant fluctuations even within confluent layers, and the relationship between such subcell fluctuations and multicell migration remains obscure (4, 8). Careful measurement of the correlation between subcell fluctuations and multicellular motion as cell density increases is essential to develop a full understanding of this transition. Such results are also crucial to explore the intriguing analogy between the collective motion of cells and the emergence of collective motion in particulate supercooled fluids approaching a glass transition.
Here we investigate the motion of cells within a confluent layer over a broad range of time and length scales, quantifying both collective cell dynamics, such as migration, as well as single-cell dynamics, such as self-diffusivity, and internal deformations. We find that motion within the cell layer is intriguingly analogous to that within a supercooled fluid, approaching a glass-like state with increasing number-density of cells. We observe pronounced signatures of supercooled fluids within the cell layer: dynamic heterogeneities in cell migration, a non-Arrhenius dependence of relaxation times on cell density, and peaks in the vibrational density of states (DOS). Within the cell layer, however, the details of these characteristic motions arise from single-cell-body deformations and cell proliferation: it is this internal activity that distinguishes confluent tissue-cell dynamics from more traditional molecular or colloidal glass-forming systems.
Results
A confluent island of Madin-Darby canine kidney (MDCK) cells is grown on a flat, 100 μm thick poly-acrylamide gel (Fig. 1A). The gel is functionalized with Collagen I and the shear modulus of the gel is chosen to match the cell shear modulus of 420 Pa; this has the effect of mimicking the chemical and materials properties of real tissue (9–11). Approximately 5,000 cells are deposited in a drop at the center of the gel and allowed to settle. After the cells have adhered to the surface, the dish is filled with media and transferred to an environmentally controlled chamber on a microscope, maintained at 37 °C and 5% CO2. We study motion within the cell layer by collecting time-lapse, phase-contrast images over the course of several days, and we count the cells to monitor the evolution of cell density; the cell layer is confluent and, thus, as cell density increases, the projected area per cell decreases (6). To follow in time the evolution of cell motion and density, each set of 200 images are grouped and analyzed as separate datasets of duration 200 min, unless otherwise indicated.
Fig. 1.

MDCK cells within a confluent monolayer migrate in a spatially heterogeneous manner (A, B). The average area of contiguous regions of the fastest velocity vectors defines ξh, the area of dynamic heterogeneities (B, white regions). As cell density rises, ξh grows from an area of about 10 cell bodies to 30 cell bodies (C, inset: ξh in μm2). The average migration speed of cells within the entire field of view, v, decreases with increasing cell density (D). (Scale bar, 100μm.).
Multicell Migration and Dynamic Heterogeneities.
To quantify motion on multicell length scales, we employ a Particle Image Velocimetry (PIV)-like analysis that measures a displacement field between images in time. Each image is divided into 1,024 subregions, and the peak position of the 2D spatial autocorrelation function of each subregion at successive time points produces a displacement vector for each subregion across the entire image. Short-time, subcellular motions add random fluctuations to the frame-by-frame displacement field, d(r,t), and the displacement autocorrelation function exhibits a rapid decay at short times, and a plateau at lag times between 100 and 200 min. Thus, before breaking the displacement field into groups of length 200 min, we use a running boxcar-average of 100 min over the full dataset, determining a well defined migration velocity field in space and time, v(r,t). We observe that cells within the confluent layer are confined by their neighbors and move with a nearly constant velocity over time scales of hundreds of minutes (Fig. S1).
The resulting migration velocity fields are spatially heterogeneous, exhibiting a variation in magnitude from region to region. There is no apparent structural heterogeneity in cell density that correlates with cell motion, suggesting that the large scale heterogeneities in the migration velocity field are dynamic in nature (Fig. S2). To characterize the spatial extent of the area containing these dynamic heterogeneities, ξh, we employ a method similar to that used in dense colloidal systems: we identify the fastest 20% of all migration velocity vectors at each time point and calculate the average area of the subregions that contain the selected vectors and are contiguous; this determines ξh in each 200 min dataset (Fig. 1B). The cell density increases with time; concomitantly the dynamic heterogeneities grow in spatial extent. At the lowest cell densities the dynamic heterogeneity comprises an area of about ten cells; however there is a marked increase in this size scale as the cell density increases. The size of the dynamic heterogeneities saturates at a spatial extent of an area of about 30 cell bodies, but decreases again beyond a cell density of approximately 2,800 mm-2 (Fig. 1C).
To quantify the migration rate, we calculate the speed from the averaged-velocity fields, v = 〈|v(r,t)|〉r,t, where angle brackets indicate an average over the position of the velocity vectors, r, throughout the entire field of view, and an average over time, t, throughout each 200 min period. Although ξh grows with density, v decreases, shown in Fig. 1D. This combination of growing dynamic heterogeneities and slowing migration speed with increasing cell density is strikingly reminiscent of the nature of the relaxations observed in supercooled fluids approaching the glass transition, suggesting the possibility of an analogy between cell motion within a confluent layer and the crowding within a particulate system approaching a glass transition with increasing density (12, 13).
The Dynamic Structure Factor of Confluent Cell Motion.
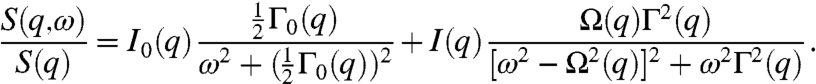
To further explore possible analogies between glass-forming systems and collective migration within confluent cell layers, we search for other signatures of the glass transition by measuring the dynamic structure factor, S(q,ω) of the confluent cell layer. The dynamic structure factor is traditionally measured with inelastic neutron, X-ray, or light scattering methods, and we adapt a similar method for the analysis of time-lapse images of cell motion; this provides dynamical information over a wide range of wavelengths and frequencies. Formally, the dynamic structure factor is the modulus-squared of the time and space Fourier transform of a dynamic variable such as electron density or neutron density (14). By analogy, we use the image intensity to determine S(q,ω) of the cell layer; this characterizes dynamic fluctuations in cell shape at short wavelengths, and also in cell density at long wavelengths. We assume the sample is isotropic, and orientationally average to determine S(q,ω); an example is shown in Fig. 2A.
Fig. 2.

The dynamic structure factor S(q,ω) of the migrating cell monolayer is calculated to quantify cooperative and self motions over a broad range of length scales and time scales (A). An example slice through S(q,ω) at q = 0.8 rad μm-1 shows that the spectral line shape is well described by the DHO model, consisting of a diffusive Rayleigh peak (red line) and a Brillouin peak (blue line) (B). The spectrum of diffusing particles is dramatically different than the DHO spectrum, as seen on a log - log plot (C, diffusing particle data: empty black square, red line: Rayleigh peak fit, cell data: filled black circle, blue line: DHO fit).
To describe the data, we use the damped harmonic oscillator (DHO) model, often employed to measure the dynamics of fluids and disordered materials,
 |
[1] |
The first term is a Rayleigh peak, with amplitude I0(q), and width Γ0(q), and quantifies self-diffusivity. The second term is a Brillouin peak, with amplitude I(q), width Γ(q), and peak position Ω(q), and reflects an elastic response to density fluctuations (15). Both terms are essential to describe the cell data, as show in Figs. 2 B and C. To confirm the essential requirement of the Brillouin peak to describe the data for confluent cell layers, we compare these data to that obtained from simulations of particles undergoing diffusive motion, which can be accurately described by the first term alone; the fit to the diffusive motion yields the correct diffusion coefficient, provided the data are corrected by the experimental resolution, given by the reciprocal of the experimental duration as shown in Fig. S3. We therefore correct the measured width of all data by 2π/(3.33 h) = 1.88 h-1.
Non-Arrhenius Self-Diffusivity within the Monolayer.
The width of the central peak provides a probe of the short-time random fluctuations of the cell motion. We find that Γ0(q) ∼ q2, allowing us to extract a diffusion coefficient by averaging over the high q-range, D0 = 〈q-2Γ0(q)〉q, which is well defined at all cell densities. Interestingly, we find that D0 decreases with increasing cell density, as shown in Fig. 3A and (inset). We calculate an average speed over a short duration, τ, from  , and compare this to the average speed from the PIV analysis; for all τ within the range 100 ≤ τ ≤ 200 min . we find that the migration distance is larger than the diffusion distance at all cell densities measured. Surprisingly, however, extrapolating to somewhat larger cell densities suggests that these lengths converge, whereupon self-diffusive motion overtakes cooperative migration, as shown in Fig. 3B. This convergence defines a transition density: below this density cells move greater distances by directed migration than by stochastic motions, whereas above this density, individual cell motion is predominantly diffusive-like, and cell layer motion is similar to that of concentrated deformable particles (16). Interestingly, this transition from collective relaxation to highly constrained localized motion of cells is reminiscent of a glass transition controlled by cell density; for all τ within the range 100 ≤ τ ≤ 200 min . this occurs at the density where the lengths converge, σg = 2800 mm-2.
Fig. 3.

The width of the Rayleigh peak, Γ0(q), is the q-dependent inverse relaxation time, and is equal to D0 q2 (A, empty black square: σ = 1,479 mm-2, empty red circle: σ = 2,088 mm-2, empty green triangle: σ = 2,214 mm-2, empty inverted blue triangle: σ = 2,634 mm-2). The average of Γ0(q)/q2 over high q yields a well defined self-diffusivity, D0 (A, inset). Migration distances over 200 min. durations, by diffusion and migration, are calculated from v and D0, showing that collective migration decreases to levels of self-diffusive motion with increasing cell density. At the highest density, insufficient dynamic range in S(q,ω) prevented the extraction of a diffusivity. (B). An Arrhenius plot of  as a function of cell density illustrates the analogy between motion within the cell monolayer and particulate supercooled fluids approaching a glass transition (C, blue line: AM equation fit, red line: VFT equation fit).
To further characterize the approach of fluid-like cell motion to a glass-like state we plot the inverse diffusivity as a function of cell density, and fit the data with the Avramov-Milchev (AM) equation, 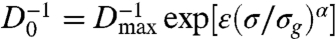 , where σ is the cell density, Dmax is the diffusivity at zero density, ε is the dimensionless activation energy at the glass-transition density, σg is the glass-transition density, and α is a fragility parameter (Fig. 3C). The AM equation describes stress relaxation times as a function of temperature in glass-forming molecular fluids and as a function of density in glass-forming colloidal fluids (17). Therefore, by analogy, we identify the cell density with the volume fraction in colloidal suspensions, which corresponds to the inverse temperature in molecular glass formers. From the fit we obtain Dmax = 30 ± 4 μm2 h-1, showing that diffusive-like motions of cells within a confluent layer are more than an order of magnitude slower than the anomalous migration of isolated MDCK cells (18). By contrast, within the confluent cell layer, Dmax arises from very different dynamics, as migrating cells have been shown to pass through a kinetic phase transition as cell density is increased from subconfluent densities to confluent densities (5). Glass-like relaxation within the cell layer is captured by the parameters α and ε. For “strong” glasses, α = 1, whereas for the most fragile glasses, α ≈ 5–6; we find that within the cell layer, α = 2.4 ± 0.1, indicating that the cell layer is analogous to a moderately fragile glass-forming fluid. Interestingly, we find that ε = 1.8 ± 0.1, suggesting that the relative width of the activation energy spectrum at σg is large compared to that of most molecular glasses, in which ε ≈ 30. Similar results are obtained by fitting our data with another widely used description of non-Arrhenius relaxations in glass-forming systems, the Vogel-Fulcher-Tamman (VFT) equation (19). Although the underlying details of the AM and VFT models differ, and the VFT predicts a divergence in
  which we cannot observe (20), both models reveal the same relaxation behavior in the cell system: collective migration within a confluent cell monolayer exhibits behavior that is remarkably reminiscent of the non-Arrhenius relaxation within a moderately fragile glass-forming fluid (21).
Density of States within the Confluent Cell Layer.
An additional means of analyzing the information provided by S(q,ω) is through the DOS, which provides an additional point of comparison to glass-like behavior. The DOS in 2D is given by 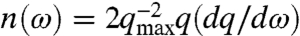 , where, dq/dω is the reciprocal of the group velocity, c = dΩ(q)/dq. Because there is no well defined cutoff in our system, such as an intermolecular spacing, and we analyze fluctuations in the cell layer down to subcellular length scales, we arbitrarily choose the pixel size to define the maximum wave vector, qmax = 2π/(1.55 μm). This choice of qmax affects the overall scale of n(ω), but does not change the ω-dependent features. The dispersion relations exhibit two important features that affect the DOS. At low q, corresponding to length scales just larger than the cell size, Ω(q) flattens out, and at higher q, Ω(q) develops an inflection point, shown in Fig. 4A. At these frequencies where the group velocity is reduced, there is an increase in the DOS. The excess in DOS is frequently measured in reference to the Debye-approximation for the DOS, which scales like ω in 2D; thus n(ω)/ω exhibits peaks corresponding to the reductions in dΩ(q)/dq, as shown in Fig. 4B.
Fig. 4.

Analysis of the Brillouin peaks in S(q,ω) yield dispersion relations of cell motion, Ω(q), at each cell density (A). The DOS of cell motion, extracted from Ω(q), exhibits two sets of peaks, analogous to boson peaks in supercooled fluids (B). The peaks at lower frequencies and wave vectors correspond to the time scale and length scale of cell shape oscillations; the peaks at higher frequencies and wave vectors correspond to the time scale and length scale of cell divisions (C, D). (σ2 = 1,550 mm-2, σ4 = 1,480 mm-2, σ11 = 1,880 mm-2, σ12 = 2,090 mm-2, σ14 = 2,210 mm-2, σ15 = 2,550 mm-2, and σ16 = 2,630 mm-2)
At the lowest cell densities, n(ω)/ω resembles that of molecular and colloidal fluids: there is a single, dominant peak at low frequencies and the DOS decreases and flattens out at high frequencies, as shown in Fig. 4B (22). This peak is commonly called the boson peak; in supercooled fluids, the boson peak arises from damped oscillations of long lived molecular structures (23, 24). This peak shifts to lower frequency with increasing cell density; the associated time scale of this peak, τ∗ = 2π/ωpeak, increases from approximately 1 h to 1.6 h, as shown in Fig. 4C. By locating the corresponding q-value in Ω(q), we find that the wavelength of this oscillation, λ∗ = 2π/q∗, does not shift dramatically relative to cell size as a function of cell density; approximating the cell length as lc ∼ σ-1/2, we find λ∗ = 1.19 ± 0.14 lc, shown in Fig. 4D. Typical migration time scales over the length of a cell body are much larger than an hour, as can be determined from Fig. 3B, however, cell body shape fluctuations during cooperative migration within the layer can be seen directly, and appear to have a time scale comparable to an hour. Furthermore, it is natural that the Fourier-mode corresponding to the inchworm-like, antiparallel oscillations of cell shape during migration have a reduced group velocity, relative to neighboring modes in Ω(q). Thus, we believe that the low-ω peak in the DOS arises from coupled cell body shape fluctuations within the migrating cell layer, where τ∗ and λ∗ provide a direct measure of the oscillation period and wavelength.
As cell density rises, we observe that the division time per cell remains constant and, thus, the number of cell divisions per unit area increases. There is a characteristic type of motion associated with divisions; the parent cell separates into two daughter cells, each less than one-half the parent cell size, moving antiparallel to one another over the course of one-half to 1 h. This type of highly correlated motion of daughter cell pairs is analogous to the short-wavelength longitudinal standing-wave mode in atomic systems; neighboring atoms oscillate out of phase with a corresponding group velocity of zero. Consistent with this picture, we observe a second peak in the DOS at short wavelengths and high frequencies corresponding to the characteristic length scale and time scale of cell division motion; τ∗ ∼ 0.4 to 1 h, and, in units of cell lengths, lc, λ∗ = 0.39 ± 0.05 (Fig. 4 C and D). We check these values by direct inspection of the time-lapse movies; the size and time scale of separating daughter cells is always within this range. Thus, as density rises and σg is approached, migration, diffusion, and cell-body deformations dramatically slow within the cell layer, while the spatial density of cell divisions rises and persists as an increasingly dominant source of high-frequency motion.
Discussion
This study uncovers a conceptual foundation for understanding collective cell migration by exploring several analogies between confluent cell layer motion and classical glass-forming particulate systems. The growth of dynamic heterogeneities and the reduction in diffusive motion with increasing cell density, and the existence of peaks in the DOS, demonstrate several connections between cell monolayer migration and classical particulate glass-forming systems. We extend this analogy further by comparing the fragility analysis of the cell layer to the fragility of atomic and molecular glasses (Fig. 3C). From the fit to the VFT equation and the glass-transition density, σg = 2,800 mm-2, we extract a glass-transition diffusivity, Dg = 4.17 ± 0.15 μm2 hr-1. In particulate glass-forming fluids, the temperature at which the single particle relaxation time reaches 100 s is defined as the glass-transition temperature, Tg. We search for a similar time scale to define the glass-like state of cell layers from Dg and σg: at σg, the only motion in the cell layer will be associated with divisions. Within one division time, all of the material within each cell is partitioned into two halves of each cell body. We find that the length scale of this single-cell motion is 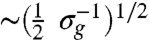 , and the time scale associated with this motion,
  is 42.8 h. We directly measure the average division time, and, remarkably, we find it to be 44.1 h. Thus, there is a fundamental time scale associated with the glass-like state of the cell monolayer: the cell division time. This role of division time in the glass-like dynamics of a cell monolayer illustrates just one of several important dramatic differences between cell systems and traditional particulate systems; to understand the glass transition in cell systems will require accounting for nonequilibrium particles that generate forces internally, actively and passively change shape, as well as proliferate.
An important feature of the cells is the evolution of their density with time. This process is analogous to aging, and other time-evolving systems also exhibit relaxation due to dynamic heterogeneities, similar to those observed here. For example, foams evolve in time as the local stresses within them change due to the coarsening of the bubbles, and this drives relaxation due to dynamic heterogeneities (25, 26). However, the time scales of the coarsening and the relaxations are very different. The temporal evolution of the cells also occurs on a much longer time scale than does the relaxation due to the dynamic heterogeneities. However, the relaxation of the cell layer is due to active motion generated directly by the cells whereas the relaxations in foams are ultimately thermally driven, assisted by the coarsening of the bubbles. Perhaps the closest analogy to the behavior of the cell layer is that of soft, deformable spheres; they exhibit non-Arrhenius relaxation behavior as they approach the colloidal glass transition, suggesting that relaxations might occur through dynamic heterogeneities (16). Dynamic heterogeneities in soft sphere systems have been observed in simulations and, recently, experimentally but only in 2D (27, 28). By contrast, nothing whatsoever is known about the approach to a glass-like state in systems of active deformable objects that internally generate forces, such as the system of cells studied here. Accordingly, the connections observed between dynamic heterogeneity, non-Arrhenius relaxation, and excess DOS within a confluent cell layer can lay a broad groundwork for future understanding of the glass transition in active particle systems.
It has been predicted that over long time scales, tissues flow like fluids and their internal motions are mediated by a balance of cell proliferation and apoptosis; viscoelastic relaxations within tissue fragments, cell spheroids, and single cells occur over time scales less than a few hours, yet cell division times exceed time scales of days (29–33). Our results are complementary: if cell density is below σg, then confluent cells flow like a fluid over time scales longer than the relatively short viscoelastic relaxation times of about an hour. However, if the cell density is above σg, then the behavior of the cell layer is reminiscent of a glass, and structural relaxations are only observed over the much longer time scale of cell division, exceeding days. This glass-like behavior of confluent cells has direct implications to well known types of collective migration; in wound healing assays, for example, in which large groups of cells are removed from a confluent layer, the cell density is reduced to zero at the edge of the wound and cells rapidly migrate inward to fill the wound. Our results suggest that the dramatic reduction of cell density at the edge of a wound is analogous to a localized reduction of particle density within a colloidal glass, or analogous to a localized increase in temperature within a molecular glass, creating an effectively melted region of the wounded cell layer. Many mechanical and chemical signals essential to drive the wound healing process are well known, and our results provide a framework for understanding the resulting collective dynamics of wound healing (34, 35). The role of glass-like dynamics in other instances of collective motion within healthy, diseased, and developing tissues remains to be explored, but the several clear signatures of glass formation within the confluent cell monolayer, observed here, will serve as a foundation for future work.
Materials and Methods
Cell Culture and Substrate Preparation.
Previously published methods are used to make the polyacrylamide substrates (11, 36, 37). The gel shear modulus is 420 Pa, controlled by the monomer and cross-linker concentrations. Strain II MDCK cells are cultured in MEM with Earle’s salts supplemented with 5% FBS, 2 mM L-glutamine, 100 U mL-1 penicillin and 100 μg mL-1 streptomycin. Approximately 5,000 cells are seeded in a small drop at the center of the gels. After the cells are left to adhere for 30 min at 37 °C and 5% CO2, the dish is filled with media and transferred to an environmentally controlled chamber on a microscope, also maintained at 37 °C and 5% CO2.
Phase-Contrast and Fluorescence Imaging.
Near the center of the layer, two separate images are collected at a frame rate of once per minute. The cells are imaged in phase contrast, and beads attached to the inside of the Petri dish bottom are imaged in FITC fluorescence. To dedrift the data, the Petri dish bottom images are used instead of the cell layer images. This procedure mitigates the potential problem that collective motion may occur on length scales larger than our field of view, making true collective motion indistinguishable from mechanical stage drift.
PIV Analysis and Cell Counting.
Custom PIV and image segmentation software was written in MATLAB. The accuracy of automated cell counting was checked by manually counting cells in several frames during each 200 min time period. The manual counts agreed with the automated counts to within the standard deviation of the mean automated count. In the PIV analysis, each image was broken into 1,024 regions of 16 × 16 pixel2.
Calculation of the Dynamic Structure Factor.
The Fast Fourier Transform is used to calculate S(q,ω), and in order to remove long-wavelength and low-frequency artifacts, the mean intensity in time and space is subtracted (38). Writing the time-lapse image sequences as i(r,t), the dynamic structure factor is S(q,ω) = 〈|FFTr,t[i(r,t)]|2〉φ, in which the angle brackets indicate an average over the azimuthal angle in 2D q-space. Frequencies and wave vectors are sampled at integer factors of π/L, where L is the duration of the dataset or the spatial extent of the image.
Supplementary Material
Acknowledgments.
We thank Dr. James Butler and Prof. Johan Mattsson for helpful conversations. This work was supported by the National Science Foundation (NSF) (DMR-1006546) and the Harvard Materials Research Science and Engineering Centers (MRSEC) (DMR-0820484). M.M. gratefully acknowledges partial funding for this work from the University of Malaga (Junta de Andalucia), Project P09-TEP-5369 in collaboration with Prof. Ignacio Loscertales. X.T. acknowledges support of the European Research Council (Starting Grant), the Spanish Ministry of Science and Innovation, and the Institució Catalana de Recerca i Estudis Avançats.
Footnotes
The authors declare no conflict of interest.
This article is a PNAS Direct Submission.
See Commentary on page 4701.
This article contains supporting information online at www.pnas.org/lookup/suppl/doi:10.1073/pnas.1010059108/-/DCSupplemental.
References
- 1.Friedl P, Hegerfeldt Y, Tusch M. Collective cell migration in morphogenesis and cancer. Int J Dev Biol. 2004;48:441–449. doi: 10.1387/ijdb.041821pf. [DOI] [PubMed] [Google Scholar]
- 2.Martin P, Parkhurst SM. Parallels between tissue repair and embryo morphogenesis. Development. 2004;131:3021–3034. doi: 10.1242/dev.01253. [DOI] [PubMed] [Google Scholar]
- 3.Lecaudey V, Gilmour D. Organizing moving groups during morphogenesis. Curr Opin Cell Biol. 2006;18:102–107. doi: 10.1016/j.ceb.2005.12.001. [DOI] [PubMed] [Google Scholar]
- 4.Friedl P. Prespecification and plasticity: shifting mechanisms of cell migration. Curr Opin Cell Biol. 2004;16:14–23. doi: 10.1016/j.ceb.2003.11.001. [DOI] [PubMed] [Google Scholar]
- 5.Szabo B, et al. Phase transition in the collective migration of tissue cells: experiment and model. Phys Rev E . 2006;74:061908. doi: 10.1103/PhysRevE.74.061908. [DOI] [PubMed] [Google Scholar]
- 6.Angelini TE, Hannezo E, Trepat X, Fredberg JJ, Weitz DA. Cell migration driven by cooperative substrate deformation patterns. Phys Rev Lett. 2010;104:168104. doi: 10.1103/PhysRevLett.104.168104. [DOI] [PMC free article] [PubMed] [Google Scholar]
- 7.Trepat X, et al. Physical forces during collective cell migration. Nat Phys. 2009;5:426–430. [Google Scholar]
- 8.Farooqui R, Fenteany G. Multiple rows of cells behind an epithelial wound edge extend cryptic lamellipodia to collectively drive cell-sheet movement. J Cell Sci. 2005;118:51–63. doi: 10.1242/jcs.01577. [DOI] [PubMed] [Google Scholar]
- 9.Dembo M, Wang Y-L. Stresses at the cell-to-substrate interface during locomotion of fibroblasts. Biophys J. 1999;76:2307–2316. doi: 10.1016/S0006-3495(99)77386-8. [DOI] [PMC free article] [PubMed] [Google Scholar]
- 10.Discher DE, Janmey P, Wang Y-l. Tissue cells feel and respond to the stiffness of their substrate. Science. 2005;310:1139–1143. doi: 10.1126/science.1116995. [DOI] [PubMed] [Google Scholar]
- 11.Beningo KA, Lo CM, Wang YL. Methods in cell-matrix adhesion. Vol 69. San Diego: Academic Press; 2002. Flexible polyacrylamide substrata for the analysis of mechanical interactions at cell-substratum adhesions; pp. 325–339. (Methods in Cell Biology). [DOI] [PubMed] [Google Scholar]
- 12.Weeks ER, Crocker JC, Levitt AC, Schofield A, Weitz DA. Three-dimensional direct imaging of structural relaxation near the colloidal glass transition. Science. 2000;287:627–631. doi: 10.1126/science.287.5453.627. [DOI] [PubMed] [Google Scholar]
- 13.Sessoms DA, Bischofberger I, Cipelletti L, Trappe V. Multiple dynamic regimes in concentrated microgel systems. Philos T R Soc A. 2009;367:5013–5032. doi: 10.1098/rsta.2009.0178. [DOI] [PubMed] [Google Scholar]
- 14.Sinha SK. Theory of inelastic X-ray scattering from condensed matter. J Phys-Condens Mat. 2001;13:7511–7523. [Google Scholar]
- 15.Ruocco G, Sette F. The high-frequency dynamics of liquid water. J Phys-Condens Mat. 1999;11:R259–R293. [Google Scholar]
- 16.Mattsson J, et al. Soft colloids make strong glasses. Nature. 2009;462:83–86. doi: 10.1038/nature08457. [DOI] [PubMed] [Google Scholar]
- 17.Avramov I. Viscosity of glassforming melts. J Non-Cryst Solids. 1998;238:6–10. [Google Scholar]
- 18.Dieterich P, Klages R, Preuss R, Schwab A. Anomalous dynamics of cell migration. Proc Natl Acad Sci USA. 2008;105:459–463. doi: 10.1073/pnas.0707603105. [DOI] [PMC free article] [PubMed] [Google Scholar]
- 19.Vogel H. Das Temperaturabhängigkeitsgesetz der Viskosität von Flüssigkeiten [The law of relation between the viscosity of liquids and the temperature] Phys Z. 1921;22:645–646. German. [Google Scholar]
- 20.Hecksher T, Nielsen AI, Olsen NB, Dyre JC. Little evidence for dynamic divergences in ultraviscous molecular liquids. Nat Phys. 2008;4:737–741. [Google Scholar]
- 21.Martinez LM, Angell CA. A thermodynamic connection to the fragility of glass-forming liquids. Nature. 2001;410:663–667. doi: 10.1038/35070517. [DOI] [PubMed] [Google Scholar]
- 22.Shintani H, Tanaka H. Universal link between the boson peak and transverse phonons in glass. Nat Mater. 2008;7:870–877. doi: 10.1038/nmat2293. [DOI] [PubMed] [Google Scholar]
- 23.Duval E, et al. Vibrational dynamics and the structure of glasses. J Phys-Condens Mat. 1990;2:10227–10234. [Google Scholar]
- 24.Novikov VN, Sokolov AP. Poisson’s ratio and the fragility of glass-forming liquids. Nature. 2004;431:961–963. doi: 10.1038/nature02947. [DOI] [PubMed] [Google Scholar]
- 25.Mayer P, et al. Heterogeneous dynamics of coarsening systems. Phys Rev Lett. 2004;93:115701. doi: 10.1103/PhysRevLett.93.115701. [DOI] [PubMed] [Google Scholar]
- 26.Durian DJ, Weitz DA, Pine DJ. Multiple light-scattering probes of foam structure and dynamics. Science. 1991;252:686–688. doi: 10.1126/science.252.5006.686. [DOI] [PubMed] [Google Scholar]
- 27.Yamamoto R, Onuki A. Dynamics of highly supercooled liquids: Heterogeneity, rheology, and diffusion. Phys Rev E. 1998;58:3515–3529. [Google Scholar]
- 28.Yunker P, Zhang Z, Yodh AG. Observation of the disorder-induced crystal-to-glass transition. Phys Rev Lett. 2010;104:015701. doi: 10.1103/PhysRevLett.104.015701. [DOI] [PubMed] [Google Scholar]
- 29.Basan M, Risler T, Joanny J-F, Sastre-Garau X, Prost J. Homeostatic competition drives tumor growth and metastasis nucleation. HFSP J. 2009;3:265–272. doi: 10.2976/1.3086732. [DOI] [PMC free article] [PubMed] [Google Scholar]
- 30.Forgacs G, Foty RA, Shafrir Y, Steinberg MS. Viscoelastic properties of living embryonic tissues: a quantitative study. Biophysical J. 1998;74:2227–2234. doi: 10.1016/S0006-3495(98)77932-9. [DOI] [PMC free article] [PubMed] [Google Scholar]
- 31.Schotz E-M, et al. Quantitative differences in tissue surface tension influence zebrafish germ layer positioning. HFSP J. 2008;2:42–56. doi: 10.2976/1.2834817. [DOI] [PMC free article] [PubMed] [Google Scholar]
- 32.Desprat N, Richert A, Simeon J, Asnacios A. Creep function of a single living cell. Biophys J. 2005;88:2224–2233. doi: 10.1529/biophysj.104.050278. [DOI] [PMC free article] [PubMed] [Google Scholar]
- 33.Fernandez P, Pullarkat PA, Ott A. A master relation defines the nonlinear viscoelasticity of single fibroblasts. Biophys J. 2006;90:3796–3805. doi: 10.1529/biophysj.105.072215. [DOI] [PMC free article] [PubMed] [Google Scholar]
- 34.Poujade M, et al. Collective migration of an epithelial monolayer in response to a model wound. Proc Natl Acad Sci USA. 2007;104:15988–15993. doi: 10.1073/pnas.0705062104. [DOI] [PMC free article] [PubMed] [Google Scholar]
- 35.Omelchenko T, Vasiliev JM, Gelfand IM, Feder HH, Bonder EM. Rho-dependent formation of epithelial “leader” cells during wound healing. Proc Natl Acad Sci USA. 2003;100:10788–10793. doi: 10.1073/pnas.1834401100. [DOI] [PMC free article] [PubMed] [Google Scholar]
- 36.Dembo M, Wang YL. Stresses at the cell-to-substrate interface during locomotion of fibroblasts. Biophys J. 1999;76:2307–2316. doi: 10.1016/S0006-3495(99)77386-8. [DOI] [PMC free article] [PubMed] [Google Scholar]
- 37.Wang N, et al. Cell prestress. I. Stiffness and prestress are closely associated in adherent contractile cells. Am J Physiol-Cell Ph. 2002;282:C606–616. doi: 10.1152/ajpcell.00269.2001. [DOI] [PubMed] [Google Scholar]
- 38.Press WH. Numerical recipes in c: the art of scientific computing. New York: Cambridge University Press; 1992. [Google Scholar]
Associated Data
This section collects any data citations, data availability statements, or supplementary materials included in this article.