

Abstract
Rising global demands for food and biofuels are driving forest clearance in the tropics. Oil-palm expansion contributes to biodiversity declines and carbon emissions in Southeast Asia. However, the magnitudes of these impacts remain largely unquantified until now. We produce a 250-m spatial resolution map of closed canopy oil-palm plantations in the lowlands of Peninsular Malaysia (2 million ha), Borneo (2.4 million ha), and Sumatra (3.9 million ha). We demonstrate that 6% (or ≈880,000 ha) of tropical peatlands in the region had been converted to oil-palm plantations by the early 2000s. Conversion of peatswamp forests to oil palm led to biodiversity declines of 1% in Borneo (equivalent to four species of forest-dwelling birds), 3.4% in Sumatra (16 species), and 12.1% in Peninsular Malaysia (46 species). This land-use change also contributed to the loss of ≈140 million Mg of aboveground biomass carbon, and annual emissions of ≈4.6 million Mg of belowground carbon from peat oxidation. Additionally, the loss of peatswamp forests implies the loss of carbon sequestration service through peat accumulation, which amounts to ≈660,000 Mg of carbon annually. By 2010, 2.3 million ha of peatswamp forests were clear-felled, and currently occur as degraded lands. Reforestation of these clearings could enhance biodiversity by up to ≈20%, whereas oil-palm establishment would exacerbate species losses by up to ≈12%. To safeguard the region's biodiversity and carbon stocks, conservation and reforestation efforts should target Central Kalimantan, Riau, and West Kalimantan, which retain three-quarters (3.9 million ha) of the remaining peatswamp forests in Southeast Asia.
Keywords: carbon payment, climate change, Reducing Emissions from Deforestation and Forest Degradation, rural livelihoods, tropical ecology
Global deforestation rates have remained worryingly high over the past decade, although forest loss might be slowing down in some areas such as the Amazon (1, 2). The top five countries with highest rates of primary forest loss―Brazil, Papua New Guinea, Gabon, Indonesia, and Peru―lost a total of 3.6 million ha of primary forests annually, due largely to agricultural and forestry expansion (3, 4). A case in point is oil-palm agriculture in Southeast Asia (5–9). Indonesia and Malaysia are the world's top producers of palm oil (≈43 million Mg/y), accounting for 87% of global production (10). Since 1990, the combined harvested area for oil palm in both countries have expanded by 6.5 million ha, or almost fourfold (11). Even if only half of oil-palm expansion resulted in forest loss (4, 8), this single crop would have contributed to >10% of total deforestation in Indonesia and Malaysia between 1990 and 2010 (1).
Indonesia and Malaysia harbor 80% (or ≈51 million ha) of Southeast Asia's remaining primary forests (1). These forests provide important ecosystem services, including biodiversity conservation, pest control, water filtration, and carbon storage and sequestration (6, 12, 13). In particular, the region's peatswamp forests (i.e., primary forests on tropical peatlands) both contain high concentrations of region-endemic species and are important reservoirs of peat and biomass carbon (14). The conversion of peatlands to oil palm has purportedly contributed to substantial biodiversity declines and carbon emissions (5, 6, 14). However, surprisingly, scientists have little understanding of the historical pathways of land-use change leading to oil-palm development in Southeast Asia (4, 8, 15). Consequently, any environmental impact due to oil-palm expansion remains largely unquantified, especially at the regional scale (4, 8, 16). The need to fill this gap in knowledge is acquiring urgency because oil-palm agriculture continues to expand not only in Southeast Asia but also in other forest-rich nations such as Papua New Guinea, Colombia, and Liberia (9, 17).
Our main objectives are (i) to produce a 250-m spatial resolution map of closed canopy oil-palm plantations in the lowlands of Peninsular Malaysia, Borneo, and Sumatra for 2010; (ii) to quantify the extent of oil-palm expansion in tropical peatlands by the early 2000s; (iii) to model the biodiversity impacts of converting peatswamp forests to oil palm, based on a matrix-calibrated species-area model; (iv) to estimate the magnitudes of above- and belowground carbon emissions and forfeited carbon sequestration service due to peatland deforestation; and (v) to project the environmental impacts of alternative future land-use scenarios for the region's peatlands.
Results
A total of 8.3 million ha of closed canopy oil-palm plantations occur in Peninsular Malaysia (2 million ha), Borneo (2.4 million ha), and Sumatra (3.9 million ha) (Fig. 1 and Table S1). Approximately one-tenth of these plantations are established on peatlands (≈880,000 ha, or 6% of total peatland area) (Table S2). The five subregions that suffered the most severe losses of peatswamp forests to oil palm are Riau (≈240,000 ha), Peninsular Malaysia (≈240,000 ha), North Sumatra (≈110,000 ha), Sarawak (≈100,000 ha), and West Sumatra (≈32,000 ha) (Fig. 2 and Table S2).
Fig. 1.

Distribution of closed canopy oil palm plantations and tropical peatlands in the lowlands of Peninsular Malaysia, Borneo and Sumatra (PM, Peninsular Malaysia; SW, Sarawak; SB, Sabah; WK, West Kalimantan; CK, Central Kalimantan; SK, South Kalimantan; EK, East Kalimantan; AC, Aceh; NS, North Sumatra; RI, Riau; WS, West Sumatra; JB, Jambi; BK, Bengkulu; SS, South Sumatra; LP, Lampung).
Fig. 2.

Peatland composition in the lowlands of Peninsular Malaysia, Borneo, and Sumatra. Column widths reflect relative areas of peatland among subregions. Refer to Materials and Methods for detailed definition of each land cover class; see also Table S2 (PM, Peninsular Malaysia; SW, Sarawak; SB, Sabah; WK, West Kalimantan; CK, Central Kalimantan; SK, South Kalimantan; EK, East Kalimantan; AC, Aceh; NS, North Sumatra; RI, Riau; WS, West Sumatra; JB, Jambi; BK, Bengkulu; SS, South Sumatra; LP, Lampung).
By the early 2000s, conversion of peatswamp forests to oil palm likely led to the local extinction of ≈3% of forest-dwelling birds across our three study regions: 1% in Borneo (or four species), 3.4% in Sumatra (16 species), and 12.1% in Peninsular Malaysia (46 species) (Table 1). At the subregional level, projected biodiversity losses range from 0.2% in Central Kalimantan to ≈35% in Bengkulu (Table 1; discounting South and East Kalimantan, which have negligible oil-palm area). Furthermore, this land-use change potentially contributed to a net loss of ≈140 million Mg of aboveground biomass carbon, and annual emissions of ≈4.6 million Mg of belowground carbon from peat oxidation (Table 1). The loss of these peatswamp forests also implies the loss of associated carbon sequestration service through peat accumulation, which amounts to ≈660,000 Mg of carbon annually.
Table 1.
Biodiversity and carbon losses from conversion of peatswamp forests to oil-palm plantations in the lowlands of Peninsular Malaysia, Borneo, and Sumatra
| Region/subregion | Biodiversity loss,* % | Net biomass carbon loss,† Mg | Net peat carbon loss,‡ Mg/y | Forfeited carbon sequestration,§ Mg/y |
| Peninsular Malaysia | 12.1 (±0.015)¶ | 36,825,473 (±9,283,335) | 1,241,883 (±267,133) | 178,088 (±59,679) |
| Borneo | 1 (±0.001) | 27,553,214 (±6,945,891) | 929,190 (±199,872) | 133,248 (±44,652) |
| Sarawak | 3.6 (±0.005) | 16,147,240 (±4,070,558) | 544,541 (±117,132) | 78,088 (±26,168) |
| Sabah | 8.7 (±0.011) | 4,690,878 (±1,182,524) | 158,193 (±34,028) | 22,685 (±7,602) |
| West Kalimantan | 0.5 (±0.001) | 3,982,546 (±1,003,960) | 134,305 (±28,889) | 19,260 (±6,454) |
| Central Kalimantan | 0.2 (±<0.001) | 2,727,705 (±687,627) | 91,988 (±19,787) | 13,191 (±4,420) |
| South Kalimantan | 0 | 0 | 0 | 0 |
| East Kalimantan | <0.01 (±<0.001) | 4,845 (±1,221) | 163 (±35) | 23 (±8) |
| Sumatra | 3.4 (±0.004) | 72,238,161 (±18,210,520) | 2,436,122 (±524,017) | 349,345 (±117,068) |
| Aceh | 1.7 (±0.002) | 1,507,748 (±380,088) | 50,847 (±10,937) | 7,291 (±2,443) |
| North Sumatra | 24.2 (±0.028) | 16,922,431 (±4,265,976) | 570,683 (±122,756) | 81,837 (±27,424) |
| Riau | 2.6 (±0.003) | 37,604,540 (±9,479,730) | 1,268,156 (±272,784) | 181,856 (±60,941) |
| West Sumatra | 14.3 (±0.017) | 4,979,637 (±1,255,317) | 167,931 (±36,122) | 24,082 (±8,070) |
| Jambi | 2.3 (±0.003) | 4,207,353 (±1,060,632) | 141,887 (±30,520) | 20,347 (±6,818) |
| Bengkulu | 35.1 (±0.037) | 2,509,683 (±632,666) | 84,635 (±18,205) | 12,137 (±4,067) |
| South Sumatra | 1.4 (±0.002) | 3,107,549 (±783,382) | 104,797 (±22,542) | 15,028 (±5,036) |
| Lampung | 16.3 (±0.018) | 1,399,220 (±352,729) | 47,187 (±10,150) | 6,767 (±2,268) |
| Total study region | 2.6 (±0.003) | 136,616,848 (±34,439,746) | 4,607,195 (±991,021) | 660,681 (±221,398) |
*Refers to the local extinction of bird species within the peatland landscape of each region/subregion that is attributable to the conversion of peatswamp forests to oil palm; modeled based on a matrix-calibrated species-area model (34, 35).
†Derived from the difference in aboveground biomass carbon between peatswamp forest (179.7 ± 38.2 Mg/ha) and oil palm (24.2 ± 8.1 Mg/ha) (39).
‡Derived from belowground carbon flux between heterotrophic soil respiration in oil palm and soluble and physical removal (i.e., carbon output; 10.3 ± 2.8 Mg/ha·y−1), and oil-palm litterfall and root mortality (i.e., carbon input; 5.1 ± 1.1 Mg/ha·y−1) (39).
§Derived from rate of peat accumulation in peatswamp forest (0.75 ± 0.25 Mg/ha·y−1) (39).
¶Number in parentheses indicates SE.
By 2010, a total of 2.3 million ha (roughly equivalent to the land area of New Jersey) of peatswamp forests have been clear-felled, although the fate of these clearings remains to be determined (Fig. 2 and Table S2). The most extensive areas of cleared peatlands are found in Riau (≈450,000 ha), Central Kalimantan (≈400,000 ha), South Sumatra (≈320,000 ha), and Sarawak (≈290,000 ha) (Fig. 2 and Table S2). The recovery of mosaic vegetation on these clearings could enhance bird diversity by at least 0.2% (Aceh), whereas the reforestation of these lands could boost biodiversity by up to ≈20% (South Kalimantan) (Fig. 3 and Table S3). In contrast, the planting of oil palm on cleared peatlands would result in further losses of biodiversity by between 0.6% (Aceh) and ≈12% (South Kalimantan).
Fig. 3.

Biodiversity outcomes of land-use transition scenarios for cleared peatlands. Land-use transition scenarios are oil-palm establishment (cleared peatland to oil palm), mosaic regrowth (cleared peatland to mosaic), and forest regrowth (cleared peatland to regrowth forest). See also Table S3 (PM, Peninsular Malaysia; SW, Sarawak; SB, Sabah; WK, West Kalimantan; CK, Central Kalimantan; SK, South Kalimantan; EK, East Kalimantan; AC, Aceh; NS, North Sumatra; RI, Riau; WS, West Sumatra; JB, Jambi; BK, Bengkulu; SS, South Sumatra; LP, Lampung).
Discussion
Indonesia recently announced plans to double oil-palm production by 2020 (18). Our analytical approach can be used for qualitative and quantitative monitoring of future land-use change driven by oil-palm expansion. This approach could facilitate more environmentally sustainable development in the country. An accuracy assessment of our oil-palm map reveals that 98% of areas we identified to be oil palm is verified to be planted with oil palm; and 85% of areas covered by closed canopy oil-palm plantations could be identified by our mapping approach. In practice, this assessment implies that our approach produced a highly reliable, albeit slightly conservative, map of closed canopy oil-palm plantations within our study region.
Our results suggest that almost 90% of oil-palm development, before the early 2000s, had occurred on nonpeat areas, and that only 6% of total peatlands within our study region had been planted with oil palm (Table S1). These findings imply that, from a regional perspective, the oil-palm industry was not the main perpetrator of peatland deforestation. At the subregional level, however, substantial proportions of peatswamp forests in North Sumatra (≈38%), Bengkulu (≈35%), and Peninsular Malaysia (≈27%) were lost to oil palm (Fig. 2 and Table S2). These subregions also experienced the greatest biodiversity losses (Table 1). Furthermore, in absolute terms, the Indonesian province of Riau suffered the most severe deforestation due to oil-palm expansion (≈240,000 ha) (Table S2). This deforestation resulted in a net loss of ≈38 million Mg of biomass carbon (roughly equivalent to annual greenhouse gas emissions from Britain's transportation sector) (19), which accounts for ≈28% of total carbon emissions attributable to oil-palm conversion within our study region (Table 1). Therefore, oil-palm development did result in substantial, albeit variable, biodiversity and carbon impacts across parts of Southeast Asia.
A recent analysis of agricultural and deforestation statistics for the period 1990–2005 shows that more than half of oil-palm development in Malaysia and Indonesia had resulted in deforestation (8). These findings were subsequently confirmed by a remote sensing-based analysis of land-use change (4), which demonstrates that primary forests were the source of nearly 60% of new plantations established in Southeast Asia between 1980 and 2000, although that study did not distinguish unique expansion pathways for different types of commercial plantations (e.g., oil palm or rubber). Thus, the results of our analysis are consistent with previous estimates of land conversion. Additionally, our study reveals that the proportion of peatswamp forests destroyed by oil-palm development (up to ≈38% in North Sumatra) is lower than the proportion of forests, in general, that was lost to oil palm (at least 50%). This finding is likely due to the higher financial costs of establishing oil-palm plantations on peatlands than on mineral soils. Such additional costs derive largely from land preparation requirements before a new planting, including the drainage of the peat swamp (20). Nevertheless, as productive and profitable lands for oil palm become scarcer, and if global demands for palm oil continues to increase as predicted (5), future oil-palm development will likely encroach more extensively on peatlands and other marginal areas.
In fact, our study shows that the extent of cleared peatlands (2.3 million ha) is more than double the land area under oil-palm cultivation (≈880,000 ha) (Table S2). Some of these clearings might already be planted with oil palm (e.g., young palms lacking a closed canopy, and/or smallholder plantations <200 ha), but have not been so identified because of the limitations of our mapping approach (Materials and Methods). The remaining unplanted clearings are under increasing threat of conversion, particularly if cleared peatlands were to be considered “degraded lands” by land-use policymakers. Recent international negotiations on climate-change mitigation and forest protection have emphasized the diversion of future agricultural expansion to degraded lands (21–23). However, without a clear and transparent definition of degraded lands, any form of secondary vegetation, including cleared peatlands, will be exposed to future development risks, despite forest protection schemes such as Reducing Emissions from Deforestation and Forest Degradation (21–24). Our analysis shows that the conversion of cleared peatlands to oil palm would further threaten biodiversity and carbon stocks, whereas the reforestation of such lands could reap substantial environmental benefits (Fig. 3 and Table S3). Therefore, we argue that cleared peatlands must be distinguished from degraded lands and be accorded a high priority for conservation and forest restoration efforts.
It is striking that more than half of peatswamp forests have been lost in all, except one (West Kalimantan), of the subregions (Fig. 2 and Table S2). Fortunately, subregions that contain the largest peatland areas are also those that still retain a third or more of their peatswamp forests: West Kalimantan (1 million ha), Central Kalimantan (1.4 million ha), and Riau (1.4 million ha). To safeguard the region's biodiversity and carbon stocks, forest protection efforts should be targeted at these three Indonesian provinces, which account for ≈74% of remaining peatswamp forests in our study region.
Materials and Methods
Mapping Oil Palm.
The extent and distribution of oil-palm plantations were derived from a 250-m spatial resolution land cover map of insular Southeast Asia, which was based on Moderate Resolution Imaging Spectroradiometer (MODIS) images acquired from the Earth Observing System Data Service (25, 26). A total of 490 daily MODIS images captured between January 2 and July 3, 2010, were used to create composite images of the study region. In addition, other data sources used in our analysis include 90-m spatial resolution digital elevation data from the Shuttle Radar Topography Mission (27), regional peatland distribution maps (28–30), and Daichi-Advanced Land Observing Satellite (ALOS) data (31).
We adopted a three-step approach to mapping oil-palm plantations. First, we performed unsupervised land cover classification based on the ISODATA clustering algorithm (32), which produced 100 land cover clusters from the MODIS composite images we compiled. These clusters were visually inspected and assigned to one of five basic land cover types (water, forest, plantation/regrowth, mosaic, or open). Second, based on further visual inspection and manual delineation, the five basic land cover types were split into 12 land cover classes, including a “plantation/regrowth” class, which encompasses closed canopy vegetation ranging from tree crop plantations to dense shrubland and young secondary forests. Third, from this plantation/regrowth class, we identified closed canopy oil-palm plantations based on the ALOS Phased Array type L-band Synthetic Aperture Radar mosaic data (31). All areas within the plantation/regrowth land cover class with >6.5 dB difference in the HH (horizontal-horizontal) and HV (horizontal-vertical) backscatter values were identified as oil-palm plantations (33). Given that only closed canopy (>80%) oil-palm plantations could be identified by using this method, our mapping of oil palm was limited to mature plantations, estimated to be established in 2002 or earlier. Furthermore, because of the difficulty of distinguishing small patches of oil palm, we imposed a minimum threshold area of 200 ha for mapping oil-palm plantations. Current satellite image resolution and our method of identifying oil-palm plantations do not allow us to identify plantations smaller than this minimum threshold area. Thus, our analysis is limited to large scale monoculture plantations, which would typically be operated by oil-palm corporations, aggregates of smallholder oil-palm farmers, or government-supported smallholder schemes. Subsequently, all areas classified as oil palm were visually inspected on the MODIS composite and ALOS mosaic images; clearly misclassified areas were excluded (mainly shrublands on peat soil, narrow stretches of coastal vegetation, and known rubber plantations).
To assess the accuracy of our mapping method, we acquired 100 pan-sharpened IKONOS satellite images (natural color, 1-m spatial resolution) over southern Peninsular Malaysia (south of 3°N on the peninsula). We overlaid our newly generated land cover map on these IKONOS images. On cloud-free portions of the IKONOS images, we randomly selected 100 sample pixels, comprising 50 pixels each of the plantation/regrowth land cover class and the oil-palm areas we identified by using the method described above. Each sample pixel was then visually inspected and determined to be either a closed canopy oil-palm plantation or not, using the IKONOS images for verification. Finally, we quantified the proportion of incorrectly identified oil-palm samples, as well as the proportion of oil-palm samples that our method failed to identify.
The land cover classes relevant to this study are defined as follows: (i) peatswamp forest: forest growing on peat soil; (ii) regrowth forest: closed canopy plantations (excluding oil palm) and natural secondary forests; (iii) mosaic: mosaic of closed canopy vegetation and open areas comprising croplands, agroforests, and small forest patches; (iv) closed canopy oil palm: large scale, mature oil-palm monoculture; (v) cleared peatland: open areas covered by remnants of original vegetation, sparse grass/shrublands, and transitional agricultural areas.
Modeling Biodiversity Change.
We modeled change in biodiversity based on a matrix-calibrated species-area model (34, 35). This model accounts for both changes in primary forest cover and taxon-specific responses to each component of a heterogeneous landscape matrix. By accounting for difference in matrix composition between landscape scenarios, the model allows the attribution of any changes in biodiversity to specific land-use transitions. The matrix-calibrated species-area model partitions the z value (i.e., slope) of species-area models, into two components: γ, a constant, and σ, a measure of the sensitivity of the taxon to the transformed habitat [quantified as the proportional decrease in the number of species (0 < σ < 1)]. The model accounts for situations whereby land-use change results in a mosaic of several habitat types of varying quality for the taxon, by incorporating an area-weighted average of the taxon's response to each component of the heterogeneous transformed landscape. The matrix-calibrated species-area model is expressed as:
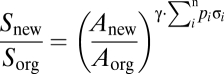 |
where S and A represent species richness and primary forest area, respectively; and the subscripts “new” and “org” represent the transformed and original landscapes, respectively. Additionally, p is the proportional area of the ith habitat type relative to the total converted land area (matrix), and n represents the total number of habitat types. We focused our analysis on forest-dwelling birds—defined as those species that might occur in nonforested habitats but require forests for long-term persistence—as an indicator of potential change in forest biodiversity. Birds are arguably the best studied tropical taxon in terms of the effects of land-use change on biodiversity (16). Based on data on z values compiled by Watling and Donnelly (36), we calculated the mean slope of species-area relationships of birds on land-bridge archipelagos and used this value, z = 0.35 ± 0.06 (±SEM), as the γ value in the matrix-calibrated model. Additionally, based on the data compiled by Sodhi et al. (16), we determined the sensitivity (i.e., the σ value) of birds to cleared peatland (σ = 0.43 ± 0.06), closed canopy oil palm (σ = 0.70 ± 0.04), regrowth mosaic (σ = 0.33 ± 0.05), and regrowth forests (σ = 0.14 ± 0.03).
For each region/subregion, we modeled biodiversity loss due to oil-palm conversion by comparing projected biodiversity outcomes between two landscape scenarios: pre-oil palm and post-oil palm development. Under the post-oil palm development scenario, we projected the percentage biodiversity remaining in the peatland landscape by applying the matrix-calibrated species-area model, based on the above γ and σ parameters, on current peatland composition (Table S2). Under the pre-oil palm development scenario, we did the same except that we assumed all current oil palm-planted areas were occupied by peatswamp forests. We quantified the percentage biodiversity loss attributable to oil-palm conversion as the difference in biodiversity projections between these two scenarios. To calculate absolute biodiversity loss, these predictions of percentage biodiversity loss were applied to the known number of species of birds occurring within regional peatswamp forests (Peninsular Malaysia: 381 species; Sumatra: 463 species; Borneo: 396 species) (37).
In this study, biodiversity loss refers to local species extinctions (i.e., population extinctions). Furthermore, because of the lag effects of species “extinction debts” (38), our projections of species losses would include persistent species that are consigned to extinction.
Additionally, we modeled biodiversity change under three alternative land-use transition scenarios for cleared peatlands: (i) oil-palm establishment (cleared peatland to oil palm), (ii) mosaic regrowth (cleared peatland to mosaic), and (iii) forest regrowth (cleared peatland to regrowth forest). We applied the matrix-calibrated species-area model, as described above, to calculate the potential change in species richness of birds resulting from each alternative land-use transition scenario.
We performed Monte Carlo simulations to account for variability in both the slope of species-area relationships (γ value) and the sensitivity of birds to each land cover class (σ value). For a total of 100,000 simulation runs, we entered randomized γ and σ values—derived from their mean and SD (assuming normal distribution of errors)—to the species-area model to calculate the mean biodiversity remaining (and SE) under each landscape/land-use transition scenario.
Estimating Carbon Emissions due to Oil-Palm Conversion.
We assumed that all oil-palm plantations on peatlands were converted from peatswamp forests (i.e., there was no intermediate land use). We calculated potential biomass carbon loss as the difference in aboveground biomass carbon between peatswamp forest (179.7 ± 38.2 Mg/ha) (±SEM) and oil palm (24.2 ± 8.1 Mg/ha) (39). Hence, conversion of peatswamp forest to oil palm would result in net carbon loss of 155.5 ± 39.2 Mg/ha. We derived potential peat carbon emissions based on the belowground carbon flux between heterotrophic soil respiration in oil palm and soluble and physical removal (i.e., carbon output; 10.3 ± 2.8 Mg/ha·y−1), and oil-palm litterfall and root mortality (i.e., carbon input; 5.1 ± 1.1 Mg/ha·y−1) (39). Therefore, conversion of peatswamp forest to oil palm would lead to net peat carbon emissions of 5.2 ± 1.1 Mg/ha·y−1. We quantified forfeiture in carbon sequestration service as the rate of peat accumulation in peatswamp forests (0.75 ± 0.25 Mg/ha·y−1) (39).
Supplementary Material
Acknowledgments
We thank D. Murdiyarso for valuable feedback on the carbon calculations and two anonymous reviewers for their comments. L.P.K. is supported by the Swiss National Science Foundation and the North-South Center, Eidgenössische Technische Hochschule Zurich. J.M. and S.C.L. acknowledge financial support from the Agency for Science, Technology and Research (A*STAR) of Singapore.
Footnotes
The authors declare no conflict of interest.
*This Direct Submission article had a prearranged editor.
This article contains supporting information online at www.pnas.org/lookup/suppl/doi:10.1073/pnas.1018776108/-/DCSupplemental.
References
- 1.FAO . Global Forest Resources Assessment 2010: Main Report. Rome, Italy: Food and Agric Org of the UN; 2010. [Google Scholar]
- 2.Hansen MC, Stehman SV, Potapov PV. Quantification of global gross forest cover loss. Proc Natl Acad Sci USA. 2010;107:8650–8655. doi: 10.1073/pnas.0912668107. [DOI] [PMC free article] [PubMed] [Google Scholar]
- 3.Rudel TK, Defries R, Asner GP, Laurance WF. Changing drivers of deforestation and new opportunities for conservation. Conserv Biol. 2009;23:1396–1405. doi: 10.1111/j.1523-1739.2009.01332.x. [DOI] [PubMed] [Google Scholar]
- 4.Gibbs HK, et al. Tropical forests were the primary sources of new agricultural land in the 1980s and 1990s. Proc Natl Acad Sci USA. 2010;107:16732–16737. doi: 10.1073/pnas.0910275107. [DOI] [PMC free article] [PubMed] [Google Scholar]
- 5.Koh LP. Potential habitat and biodiversity losses from intensified biodiesel feedstock production. Conserv Biol. 2007;21:1373–1375. doi: 10.1111/j.1523-1739.2007.00771.x. [DOI] [PubMed] [Google Scholar]
- 6.Danielsen F, et al. Biofuel plantations on forested lands: Double jeopardy for biodiversity and climate. Conserv Biol. 2009;23:348–358. doi: 10.1111/j.1523-1739.2008.01096.x. [DOI] [PubMed] [Google Scholar]
- 7.Fitzherbert EB, et al. How will oil palm expansion affect biodiversity? Trends Ecol Evol. 2008;23:538–545. doi: 10.1016/j.tree.2008.06.012. [DOI] [PubMed] [Google Scholar]
- 8.Koh LP, Wilcove DS. Is oil palm agriculture really destroying tropical biodiversity? Conservation Letters. 2008;1:60–64. [Google Scholar]
- 9.Wilcove DS, Koh LP. Addressing the threats to biodiversity from oil-palm agriculture. Biodivers Conserv. 2010;19:999–1007. [Google Scholar]
- 10.USDA-FAS . Oilseeds: World Markets and Trade. Circular Series FOP 8-10 August 2010. Washington, DC: US Depart of Agric-Foreign Agric Serv; 2010. [Google Scholar]
- 11.FAO . FAOSTAT: Statistical Databases and Data-Sets. Rome: Food and Agric Org of the UN; 2010. [Google Scholar]
- 12.Koh LP. Can oil palm plantations be made more hospitable for forest butterflies and birds? J Appl Ecol. 2008;45:1002–1009. [Google Scholar]
- 13.Koh LP. Birds defend oil palms from herbivorous insects. Ecol Appl. 2008;18:821–825. doi: 10.1890/07-1650.1. [DOI] [PubMed] [Google Scholar]
- 14.Yule CM. Loss of biodiversity and ecosystem functioning in Indo-Malayan peat swamp forests. Biodivers Conserv. 2010;19:393–409. [Google Scholar]
- 15.Koh LP. Impending disaster or sliver of hope for Southeast Asian forests? The devil may lie in the details. Biodivers Conserv. 2007;16:3935–3938. [Google Scholar]
- 16.Sodhi NS, Lee TM, Koh LP, Brook BW. A meta-analysis of the impact of anthropogenic forest disturbance on Southeast Asia's biotas. Biotropica. 2009;41:103–109. [Google Scholar]
- 17.Koh LP, Wilcove DS. Oil palm: Disinformation enables deforestation. Trends Ecol Evol. 2009;24:67–68. doi: 10.1016/j.tree.2008.09.006. [DOI] [PubMed] [Google Scholar]
- 18.Koh LP, Ghazoul J. Spatially explicit scenario analysis for reconciling agricultural expansion, forest protection, and carbon conservation in Indonesia. Proc Natl Acad Sci USA. 2010;107:11140–11144. doi: 10.1073/pnas.1000530107. [DOI] [PMC free article] [PubMed] [Google Scholar]
- 19.WRI . Climate Analysis Indicators Tool (CAIT) Version 8.0. Washington, DC: World Resour Inst; 2011. [Google Scholar]
- 20.Corley RHV, Tinker PB. The Oil Palm. 4th Ed. Oxford: Blackwell Science; 2003. [Google Scholar]
- 21.Clements GR, et al. Cautious optimism over Norway-Indonesia REDD pact. Conserv Biol. 2010;24:1437–1438. doi: 10.1111/j.1523-1739.2010.01584.x. [DOI] [PubMed] [Google Scholar]
- 22.Edwards DP, Fisher B, Boyd E. Protecting degraded rainforests: Enhancement of forest carbon stocks under REDD+ Conservation Letters. 2010;3:313–316. [Google Scholar]
- 23.Edwards DP, et al. Degraded lands worth protecting: The biological importance of Southeast Asia's repeatedly logged forests. Proc Biol Sci. 2010 doi: 10.1098/rspb.2010.1062. in press 10.1098/rspb.2010.1062. [DOI] [PMC free article] [PubMed] [Google Scholar]
- 24.Sasaki N, Putz F. Critical need for new definitions of “forest” and “forest degradation” in global climate change agreements. Conservation Letters. 2009;2:226–232. [Google Scholar]
- 25.Miettinen J, Shi C, Tan WJ, Liew SC. 2010 land cover map of insular Southeast Asia in 250m spatial resolution. Remote Sensing Lett. 2010 in press. [Google Scholar]
- 26.NASA . Earth Observing System Data Services. Washington, DC: Natl Aeronaut and Space Admin; 2010. [Google Scholar]
- 27.Jarvis A, Reuter HI, Nelson A, Guevara E. Hole-Filled SRTM for the Globe Version 4. Cali, Colombia: Int Center for Trop Agric; 2008. [Google Scholar]
- 28.Wahyunto Ritung S, Subagjo H. Maps of Area of Peatland Distribution and Carbon Content in Sumatra, 1990-2002. Bogor, Indonesia: Wetlands Int-Indonesia Programm and Wildl Habitat Canada; 2003. [Google Scholar]
- 29.Wahyunto, Ritung S, Suparto, Subagjo H. Maps of Area of Peatland Distribution and Carbon Content in Kalimantan, 2000-2002. Bogor, Indonesia: Wetlands International-Indonesia Programme and Wildlife Habitat Canada; 2004. [Google Scholar]
- 30.Selvaradjou S-K, et al. The Soil Maps of Asia-European Digital Archive of Soil Maps (EuDASM) Luxembourg: Office of the Official Publ of the Eur Communities; 2005. [Google Scholar]
- 31.ALOS . ALOS Research and Application Project. Ibaraki, Japan: Earth Observation Res Center-Japan Aerospace Explor Agency; 2010. [Google Scholar]
- 32.Tou JT, Gonzalez RC. Pattern Recognition Principles. Reading, MA: Addison-Wesley; 1974. [Google Scholar]
- 33.Miettinen J, Liew SC. Separability of insular Southeast Asian woody plantation species in the 50m resolution ALOS PALSAR mosaic product. Remote Sensing Lett. 2010;2:299–307. [Google Scholar]
- 34.Koh LP, Ghazoul J. A matrix-calibrated species-area model for predicting biodiversity losses due to land-use change. Conserv Biol. 2010;24:994–1001. doi: 10.1111/j.1523-1739.2010.01464.x. [DOI] [PubMed] [Google Scholar]
- 35.Koh LP, Lee TM, Sodhi NS, Ghazoul J. An overhaul of the species-area approach for predicting biodiversity loss: Incorporating matrix and edge effects. J Appl Ecol. 2010;47:1063–1070. [Google Scholar]
- 36.Watling JI, Donnelly MA. Fragments as islands: A synthesis of faunal responses to habitat patchiness. Conserv Biol. 2006;20:1016–1025. doi: 10.1111/j.1523-1739.2006.00482.x. [DOI] [PubMed] [Google Scholar]
- 37.WWF . WildFinder: Online Database of Species Distributions. Version 01.06. Washington, DC: World Wildl Fund; 2011. [Google Scholar]
- 38.Tilman D, May RM, Lehman CL, Nowak MA. Habitat destruction and the extinction debt. Nature. 1994;371:65–66. [Google Scholar]
- 39.Murdiyarso D, Hergoualc'h K, Verchot LV. Opportunities for reducing greenhouse gas emissions in tropical peatlands. Proc Natl Acad Sci USA. 2010;107:19655–19660. doi: 10.1073/pnas.0911966107. [DOI] [PMC free article] [PubMed] [Google Scholar]
Associated Data
This section collects any data citations, data availability statements, or supplementary materials included in this article.