

Abstract
The hypothesis for directional selectivity of frequency modulations (FMs) invokes a mechanism with an honored tradition in sensory neurobiology, the relative timing of excitation and inhibition. The proposal is that the timing disparity is created by asymmetrical locations of excitatory tuning and inhibitory sidebands. Thus, cells in which the inhibitory sidebands are tuned to frequencies lower than the excitatory tuning are selective for downward sweeping FMs, because frequencies first generate excitation followed by inhibition. Upward sweeping FMs, in contrast, first evoke inhibition that either leads or is coincident with the excitation and prevents discharges. Here we evaluated FM directional selectivity with in vivo whole-cell recordings from the inferior colliculus of awake bats. From the whole-cell recordings, we derived synaptic conductance waveforms evoked by downward and upward FMs. We then tested the effects of shifting inhibition relative to excitation in a model and found that latency shifts had only minor effects on EPSP amplitudes that were often <1.0 mV/ms shift. However, when the PSPs peaked close to spike threshold, even small changes in latency could cause some cells to fire more strongly to a particular FM direction and thus change its directional selectivity. Furthermore, the effect of shifting inhibition depended strongly on initial latency differences and the shapes of the conductance waveforms. We conclude that “timing” is more than latency differences between excitation and inhibition, and response selectivity depends on a complex interaction between the timing, the shapes, and magnitudes of the excitatory and inhibitory conductances and spike threshold.
Introduction
The timing of inputs in the auditory system has a long and honored role in the generation of various response properties (Jeffress, 1948; Yin and Chan, 1990; Casseday et al., 2002; McAlpine and Grothe, 2003), including directional selectivity for frequency modulations (FMs), in which cells fire more strongly or exclusively to FMs that sweep in one direction compared with the other. FMs are prominent features of communication calls (Wang et al., 1995; Doupe and Kuhl, 1999; Holy and Guo, 2005; Bohn et al., 2008; Portfors et al., 2009), including in humans, and FM directional selectivity is a major contributor to call-specific selectivity in many higher auditory neurons (Andoni et al., 2007).
The importance of input timing follows from two principal observations. First, neurons selective for downward (or upward) FM sweeps have inhibitory fields that are lower (or higher) in frequency than the frequencies that activate their excitatory fields (Suga, 1973; Suga and Schlegel, 1973; Covey and Casseday, 1999; Brimijoin and O'Neill, 2005; Fuzessery et al., 2006; Razak and Fuzessery, 2006; Andoni et al., 2007; Yue et al., 2007). Second, blocking inhibition reduces or eliminates directional preferences (Fuzessery and Hall, 1996; Koch and Grothe, 1998; Andoni et al., 2007; Razak and Fuzessery, 2010). Following from these observations, the timing hypothesis posits that, for downward preferring cells, downward FMs sweep through the excitatory field before the inhibitory field, thereby evoking an initial excitation (Suga, 1973; Suga and Schlegel, 1973; Fuzessery and Hall, 1996; Covey and Casseday, 1999; Zhang et al., 2003; Ye et al., 2010). Conversely, upward sweeps first activate inhibition that quenches subsequent excitation. The same arguments apply for upward preferring cells, but the frequencies of the excitatory and inhibitory fields are reversed. This spectral arrangement of the excitatory and inhibitory fields can account for FM directionality and explain why blocking inhibition eliminates directionality.
The timing hypothesis has two implicit assumptions. First, the latencies of the excitatory and inhibitory inputs evoked by an FM sweep occur in the same temporal sequence as the sequence of frequencies in the signal itself. Second, the cells are sensitive to small changes in the relative timing of excitation and inhibition.
Although evidence from extracellular studies of both the inferior colliculus (IC) (Poon et al., 1991; Covey and Casseday, 1999; Fuzessery et al., 2006; Andoni et al., 2007) and auditory cortex (Zhang et al., 2003; Razak and Fuzessery, 2006, 2010; Ye et al., 2010) is consistent with this hypothesis, these assumptions have never been directly tested. Here we evaluated these assumptions with in vivo whole recordings from the IC of awake bats. We show that the sequence of excitation and inhibition does not predict directionality. We also show that most IC cells were relatively insensitive to small changes in timing between inhibition and excitation, but the small changes would impact discharge probability differently for different signals, even in the same cells. Most importantly, we show that the effects of timing on discharge selectivity are a complex interaction among numerous factors that include the latency difference between excitatory and inhibitory conductances, the shapes of the conductance waveforms, the relative magnitudes of the excitation and inhibition, and how close PSP amplitude is to spike threshold.
Materials and Methods
Experiments were conducted on male Mexican free-tailed bats, Tadarida brasilensis mexicana, captured from local sources in Austin, Texas. We recorded from the central nucleus of the inferior colliculus in awake bats using patch electrodes in whole-cell current-clamp mode. All animal procedures were in accordance with a protocol approved by the University of Texas Institutional Animal Care Committee. Detailed experimental methods were reported previously (Gittelman et al., 2009).
Surgery.
Bats were sedated with isoflurane (inhalation) and then anesthetized with an intraperitoneal injection of ketamine/xylazine (75–100 mg/kg ketamine, 11–15 mg/kg xylazine). Recordings began after recovery from anesthesia and thus data were obtained from awake animals.
Electrophysiology.
Internal solution contained the following (in mm): 115 K-gluconate, 10 HEPES, 7 KCl, 4 MgATP, 0.3 Na2GTP, 0.5 EGTA, and 10 Na2-phosphocreatine. Membrane potentials were not corrected for liquid junction potential. To improve the conductance estimates in three cells, we substituted cesium for potassium to minimize the effects of voltage-gated potassium currents and included 1 mm QX-314 [N-(2,6-dimethylphenylcarbamoylmethyl)triethylammonium bromide] to block sodium channels. Results of the conductance estimates were similar to recordings made with the standard internal solution, and so the data were combined.
Sound presentation.
The sweep frequency range was fixed (one octave) to approximate the range this bat uses. The start and stop frequencies were adjusted to maximize the depolarizing response. We then obtained responses to downward and upward FMs that logarithmically swept this fixed range. In some cells, we also varied velocity and/or intensity. In recordings that were sufficiently stable, we then estimated the excitatory and inhibitory conductance evoked by downward and upward FMs at one to three velocity/intensity combinations. The velocity/intensity combination that evoked the best response was chosen for additional analysis in this study.
Quantifying membrane responses.
Spikes were filtered from the PSP responses by detecting spike threshold (dV/dt > 10 V/s), interpolating a straight line across the spike waveform and then smoothing. Spike threshold was the mean ± SD of the membrane potential at which dV/dt exceeded 10 V/s for all the evoked spikes. We found that PSP height correlated well with spiking and better than dV/dt (the rising slope of the depolarization) in most cells. We therefore quantified PSPs in terms of height (maximum depolarization − rest potential). The PSPs presented are averages of at least 10 trials.
Estimating access resistance, membrane resistance, and membrane capacitance.
Electrode capacitance was minimized by capacity compensation, and then membrane properties (resistance, time constant, and capacitance), access resistance, and pipette time constant were estimated by fitting voltage responses to small hyperpolarizing current steps (25–50 pA, 200 ms duration) with a double exponential.
Deriving synaptic conductances.
We chose to estimate synaptic conductances in current-clamp mode rather than voltage-clamp because access resistance is typically high and unstable in vivo compared with slice. These conditions are more problematic in voltage clamp than in current clamp and potentially introduce errors when using series resistance compensation. We therefore estimated synaptic conductances using the following equation (Priebe and Ferster, 2005; Gittelman et al., 2009):
where Cm is the membrane capacitance, dVm/dt is the slope of the membrane potential, Im is the current across the cell membrane, and Iinj is the current injected through the electrode. We assumed three membrane currents: excitatory, inhibitory, and leak. Equation 1 can be expanded to include the conductance and driving force terms:
 |
The conductances (g) are as follows: excitatory, ge; inhibitory, gi; leak, gleak. Vm is the measured membrane potential, and the reversal potentials for gleak, ge, and gi are (respectively) Vleak, Ve, and Vi. Most of these terms can be measured or estimated. Vm and dVm/dt were measured directly. Membrane capacitance and resistance (1/gleak) were measured as described above. Ve was assumed to be 0 mV, and Vi was estimated to be −63 mV from the changes in the PSP polarity while different amounts of constant current were being injected. Vleak was calculated from the steady-state Vm, membrane resistance measured at the steady-state Vm, and the Iinj.
Using the above values, there are only two unknowns in Equation 2, ge and gi. Consequently, ge and gi can be estimated from FM-evoked responses while hyperpolarizing the cell to only two different steady-state potentials. In practice, we required FM-evoked responses recorded at a minimum of three different steady-state potentials (for additional details, see Gittelman et al., 2009).
Modeling.
Model cells consisted of excitatory, inhibitory, and leak conductances with corresponding reversal potentials and a capacitance. We made a unique model cell for each neuron used in the conductance estimates based on responses to current steps in each cell.
The validity of the conductance estimates was determined by two criteria. We used the estimated values for ge and gi to predict the voltage responses in the models. Correlation analysis between the predicted PSPs and measured PSPs indicates that the conductance estimates account for ≥94% of the variance (R2 ≥ 0.94 for all conductance sets). Predictions were good across a broad range of membrane potentials, indicating that the state of voltage-gated channels changed little during the time course of the PSPs and thus had a relatively small effect on our conductance estimates. Second, we excluded analyses that found conductance values <0. Due to the bat IC having little spontaneous activity (Vater, 1979; Klug et al., 1999; Bauer et al., 2000), we reasoned that ligand-gated channels were mostly closed (0 nS) before sound presentation, and thus changes in synaptic conductance could only be positive.
Results
We recorded responses (spikes and PSPs) evoked by FM sweeps with whole-cell electrodes from 24 cells in the IC in awake bats. The two FMs presented to each cell had the same range of frequencies and the same intensity but differed in sweep direction. In 10 cells, the excitatory and inhibitory synaptic conductances evoked by each signal were computed from FM responses recorded in current-clamp mode, as reported previously (Priebe and Ferster, 2005; Gittelman et al., 2009). We then used the conductances in a model to compute a predicted PSP for each FM (Gittelman et al., 2009). The computations do not incorporate voltage-gated channels and thus only predict the PSPs, either the EPSP or IPSP or both, that would be evoked by the upward and downward sweeping FMs. The predicted and the actual sound-evoked PSPs were in close agreement, showing that we could compute accurate reproductions of the sound-evoked PSPs (Fig. 1).
Figure 1.

Two directionally selective cells. Black traces are the measured PSPs (mean of 10 trials, spikes removed by filtering). Red traces are PSPs computed from derived conductance waveforms (shown in Figs. 2, 3). Gray traces are spike responses to single sweeps. Dashed ± gray line is spike threshold ± SD. a, Cell 1 fired seven spikes in 10 trials to the preferred (downward) sweep and never fired to the null (upward) sweep. b, In 10 trials, cell 2 fired 10 spikes to the preferred (downward) and five spikes to the null.
Both the discharges and PSPs evoked in 21 of 24 IC cells exhibited a preference for one FM sweep direction, which we refer to as the preferred FM, over the other, termed the null FM (Xie et al., 2007; Gittelman et al., 2009) (Fig. 1). Because PSPs can be predicted from the excitatory and inhibitory conductances (Gittelman et al., 2009), we manipulated the relative timing of the excitatory and inhibitory conductances in the 10 cells and computed the responses that would be evoked by the changes in timing. Timing was manipulated by first determining the timing of the excitatory and inhibitory conductances actually evoked by each FM. We refer to these as the control delays. We then advanced or delayed the inhibitory conductance from the control delays in 1 ms steps (Figs. 2, 3). The peak PSP amplitude computed for each 1 ms time shift was compared with the peak PSP evoked by the control delay.
Figure 2.

Cell 1: temporal shifts of inhibition affect PSP height. Left, Conductance waveforms. Red, Excitation; blue, inhibition. Middle, Computed PSPs. Black, Control; gray, shifted inhibition. Dashed ± gray line is spike threshold ± SD. Right, Change in PSP height plotted against the time shift of inhibition. a, Preferred. Every temporal shift of inhibition increased PSP height. Because firing probability was ∼70%, any increase in PSP height would likely increase firing probability. b, Null. The control PSP was so far from spike threshold that large delays of inhibition (4–5 ms) would be needed to evoke spikes.
Figure 3.

Cell 2: temporal shifts of inhibition affect PSP height. Same format as Figure 2. a, Preferred. No temporal shift of inhibition reduced PSP height below threshold. b, Null. Delaying inhibition increased PSP height, and advancing inhibition decreased PSP height. With firing probability at 50%, shifting inhibition would likely affect spiking.
Inhibitory time shifts
We first show how small (1 ms) time shifts of the inhibitory conductances influenced PSP amplitudes using two cells. These cells were chosen because together they show that the temporal relationship between excitation and inhibition does not act in isolation to determine firing probability and therefore cannot by itself determine directional selectivity. The two cells also illustrate almost all of the features we observed that impact the relationship between input timing and directional selectivity. Cell 1, shown in Figure 1a, was directionally selective and fired with a probability of 70% to the downward (preferred) FMs but never fired to the upward (null) FMs. The EPSPs were also different in that the EPSP evoked by the preferred FM reached threshold, whereas the null FM evoked an EPSP that was subthreshold and substantially smaller. Cell 2 (Fig. 1b) fired to every presentation of the preferred FM, but the null FM evoked discharges with a 50% probability. In contrast to cell 1, the amplitudes of the EPSPs evoked by the preferred and null FMs were similar in cell 2, both peaking near threshold, but the null EPSP was, on average, 1.7 mV smaller than the preferred EPSP.
In the sections below, we first consider the effects of inhibitory time shifts on the preferred and null FM PSP amplitudes in cells 1 and 2, the relation of the changes in PSP amplitudes to spike threshold, and how each change in PSP amplitude should have affected discharge probability. In each case, threshold is defined as the membrane potential at which the slope of the membrane potential (dV/dt) exceeds 10 mV/ms, and stimuli that evoke ∼50% discharge probability are said to be near threshold. We then consider in greater detail how the various latencies and shapes of the conductance waveforms evoked by the two FMs interacted to produce the changes in PSP amplitudes that were computed for inhibitory time shifts.
Effects of time shifts on cell 1
The control inhibitory conductances were nearly coincident with the excitatory conductances in cell 1 for both the preferred and null FMs (Fig. 2). There were differences in the magnitudes of the excitatory conductances in that the excitatory conductance was larger for the preferred than the null FM. As we showed in a previous report (Gittelman et al., 2009), the difference in the magnitudes of the excitatory conductances was an important factor that contributed to the directional preference of the cell. The question we explore here is the degree to which the relative timing of excitation and inhibition could influence PSP amplitudes and thereby contribute to directionality.
Time shifts in the preferred FM
We turn first to the preferred FM in which the predicted PSPs with inhibitory delays are shown in the top of Figure 2a, and the predicted PSPs with inhibitory advances are in the bottom. The PSP evoked by the control preferred FM was near threshold because the preferred FM evoked a 70% discharge probability. Thus, any increase in PSP amplitude would shift the membrane potential farther above threshold and increase firing probability, whereas a decrease in PSP amplitude would shift the membrane potential farther from threshold and reduce firing probability.
Three features of time shifting the inhibitory conductance for the preferred FM are noteworthy. The first is that delaying the inhibition by 1 ms caused only a small increase in peak PSP amplitude (1.1 mV), and a 2 ms shift increased PSP amplitude by 2.6 mV relative to the control peak. Longer delays caused substantially larger PSPs that increased linearly at a rate of ∼1.4 mV/ms, up to a 5 ms delay. Because the control PSP was near threshold, even small delays would likely have increased PSP amplitudes and increased discharge probability. Delays longer than 5 ms caused only minor increases in PSP amplitudes because the inhibition was so far removed in time from the excitation that additional time increments had little effect on the peak amplitude of the PSP.
The second feature is that advancing inhibition generated smaller changes in PSP amplitudes than did the delays (Fig. 2a, bottom). Advances of 1 ms produced a PSP height increase of <0.2 mV, and advances from 2 to 10 ms increased PSP height at a rate of ∼0.4 mV/ms. Thus, small advancements and equivalent delays would have produced different increases in PSP amplitudes and differentially affected discharge probability.
The third feature is that PSP amplitudes never fell below threshold, regardless of the shift direction or amount (Fig. 2a). The reason that PSPs never fell below threshold is that inhibition was most efficacious in the control condition, in which excitation and inhibition were nearly coincident. Thus, any temporal shift of the inhibition only increased PSP amplitude.
Time shifts in the null FM
Similar but even smaller effects occurred with timing changes for the null FM in cell 1 (Fig. 2b). Delaying inhibition caused only small changes in PSP amplitude in which delays of 1–5 ms increased PSP amplitudes at a rate of ∼1 mV/ms. PSPs were always below threshold with a delay of <4 ms. Only delays of at least 4 ms caused a sufficient temporal separation of inhibitory and excitatory conductances to generate PSP amplitudes at or above threshold. Longer delays, of 6–10 ms, did not alter PSP height much because the inhibitory conductance at a 5 ms delay was already temporally separated from the excitatory conductance.
Advances of up to 3 ms produced a slight decrease in PSP height (<0.3 mV), whereas additional advances from 4 to 10 ms produced even smaller increases in PSP height at a rate of ∼0.25 mV/ms. The small changes in peak PSP amplitude with inhibitory advances is attributable to the prolonged fall time of the inhibitory waveform, which continued to overlap with the excitation even when the inhibitory conductance was advanced by 10 ms. In short, to bring the PSP amplitude close to spike threshold, inhibition had to be either delayed by ∼4 ms or advanced by >10 ms.
Effects of time shifts on cell 2
In contrast to cell 1, the preferred FM in cell 2 evoked discharges on every presentation (100% probability), whereas the probability of evoking discharges with the null FM was 50%. Moreover, cell 2 differed from cell 1 in that excitation led inhibition in both the preferred and null FM responses.
Time shifts in the preferred FM
For the preferred FM (Fig. 3a), time shifts caused larger changes in PSP amplitudes than they did in cell 1. In the control conductances, peak excitation led peak inhibition by 1.5 ms. Both waveforms were relatively sharp and brief. Thus, small delays of 1–3 ms took the peak inhibition farther from threshold and caused PSP amplitudes to increase linearly by ∼2.1 mV/ms, the biggest effect in our sample (see Fig. 5). Small advances, in contrast, first brought the excitation and inhibition into complete coincidence, thereby slightly reducing PSP amplitude, whereas longer advances took them farther from coincidence and the PSP amplitudes increased. The increases in PSP amplitudes with time shifts may have increased the number of discharges to each stimulus. However, the preferred PSP amplitudes never fell below threshold with any delay or advancement of the inhibitory conductance, and thus the firing probability would probably have been 100% regardless of the temporal separation.
Figure 5.

Small shifts in the timing of inhibition have only a small effect on PSP height. The effect of shifting inhibition ± 3 ms on PSP height in each of 10 cells. a, Preferred. b, Null.
Time shifts in the null FM
The influence of timing on the null FM responses had different consequences. In the control, there was a longer delay of ∼4.2 ms between the peaks of excitation and inhibition, in which excitation led (Fig. 3b). Delaying inhibition separated inhibition farther from excitation and thus generated increases in PSP amplitudes. However, the increases were very small. Delaying inhibition by 1–3 ms caused only increases of 0.5–0.8 mV/ ms in PSP height. Additional delays generated even smaller increases in PSP amplitudes for each millisecond delay. The inhibitory conductance had an initial “hump” with a shallow slope, which increased the breadth of the inhibitory conductance. Thus, delays moved the inhibition away from excitation, but the initial hump in the inhibitory conductance waveform continued to suppress excitation and allowed only small increases in PSP amplitudes for each millisecond delay. Advancing inhibition, in contrast, caused small reductions in PSP amplitudes as the peak of the inhibitory conductance came into coincidence with the excitation (Fig. 3b, bottom). Even a 10 ms advance still left the PSP just below threshold, because the prolonged fall time of the inhibitory conductance continued to overlap with the excitation.
A significant feature is that the null control PSP evoked a discharge probability of 50%. The PSPs evoked by each of the 10 null FMs that were presented varied in height from 9 to 16 mV from stimulus to stimulus (Fig. 4), allowing the responses evoked by five presentations of the null FMs to evoke spikes, whereas the responses evoked by the presentation of five other null FMs failed to evoke spikes. Thus, although delays caused only small increases in PSP amplitudes, those small changes would almost certainly have caused a change in discharge probability because the membrane potential, which was already hovering around threshold, would have been brought above threshold. In this way, spike threshold could act to amplify the resulting small change in membrane potential into a larger change in discharge probability evoked by the null FM. This is the same argument made previously for cell 1, but for cell 1 it was small time shifts with the preferred FM that would have increased discharge probability.
Figure 4.

PSP variability evoked by the null FM in cell 2. Firing probability was 50%. Black traces evoked spikes; gray traces did not (spike removed by filtering). Dashed line in gray box is spike threshold ± SD.
Population responses
In Figure 5, we show the changes in PSP amplitudes that resulted from shifts of ±3 ms around the control for 10 cells in which the effects of timing shifts were evaluated. Shifts of ±3 ms around the control resulted in only small changes in PSP amplitudes for both the preferred and null FMs in the 10 cells in which time shifts were evaluated. The time changes in PSP amplitudes for cell 1 are shown as red lines with filled circles, and those for cell 2 are shown as red lines with open circles. It should be noted that the changes in PSP amplitudes for cell 2 were the largest in our sample. In most cells, a 3 ms shift resulted in <2 mV change in PSP height.
We also considered the temporal relationship between excitation and inhibition evoked by the preferred compared with the null FM (Fig. 6). Recall that the timing hypothesis, outlined in the Introduction, requires that excitation lead inhibition for the preferred FM and that inhibition either be coincident with or lead excitation for the null FM. In the 10 cells that we evaluated, there was no consistent temporal sequence between the peaks of the excitatory and inhibitory conductance waveforms for either the preferred or null FMs. In some cells, excitation and inhibition were essentially coincident in both the null and FM responses, whereas in other cells, excitation led inhibition in the responses of both FMs. In one cell, the temporal relationship proposed by the timing hypothesis was reversed; inhibition led excitation in the response to the preferred FM and excitation led inhibition in the null response.
Figure 6.

The timing relationship between excitation and inhibition does not correlate with the directional preference. We plotted the relative time of peak inhibition compared with peak excitation (0 ms) for the preferred conductance pairs (filled circles) and the null pairs (open circles) in each of 10 cells. The cell in the bottom red box is consistent with the timing hypothesis, in which inhibition leads excitation in response to the null sweep and lags in response to the preferred. The top red box shows the opposite relationship, in which inhibition leads in response to the preferred but lags in response to the null. The blue boxes show examples in which the temporal relationship between inhibition and excitation is the same for both the preferred and null, with inhibition either leading for both (top blue) or lagging for both (bottom blue). The black box shows nearly coincident excitation and inhibition in both the preferred and the null (inhibition lags excitation by <1 ms in both).
Several features of excitation and inhibition interact with shifts in timing
In the above section, we showed that relatively small changes in PSP amplitude with small inhibitory time shifts were seen in all of the cells from which conductances were obtained (Fig. 5). In all cells, the effect of shifts in timing on PSP amplitude for both the preferred and null FMs depended on three principal features of the conductance waveforms: (1) the asymmetry of the conductance waveforms; (2) the width of the conductances; and (3) the initial (control) latency between excitation and inhibition. We illustrate the influence of these features with graphs that show how PSP amplitude changed as a function of temporally shifting inhibition for cells 1 and 2 (Fig. 7). The graphs were V-shaped where the lowest points (smallest PSP amplitude) in each graph occurs when the peaks of excitation and inhibition were coincident or nearly coincident.
Figure 7.
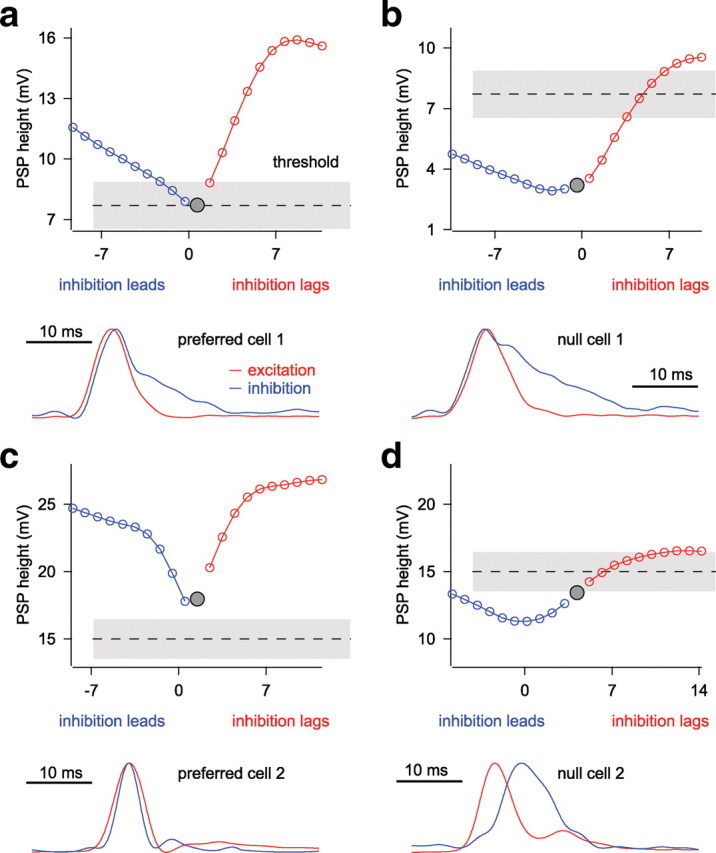
How temporally shifting inhibition affects PSP height depends on the asymmetry of the conductances, the width of the conductances, and the initial delay between excitation and inhibition. a–d, The effects on PSP height of advancing (blue) or delaying (red) inhibition with respect to control delays (gray circle) and compared with spike threshold (dashed ± gray line). Conductance heights (bottom) are normalized to show control delay between excitation and inhibition. For details, see Results.
The first feature is the asymmetry of the shapes of the conductance waveforms. This was most pronounced in inhibition, as exemplified by the conductances of the example in Figure 7, a and b, where the decays tended to be much slower than the rise. The decay of inhibition is also slower than the decay of excitation. With an asymmetric inhibitory conductance, delaying inhibition affected PSP amplitude differently than advancing inhibition. When inhibition was delayed, inhibition more quickly became separated from excitation, and thus PSP amplitude increased more rapidly. Graphically, this is shown by the steeper right arm (inhibition lags) than the left arm (inhibition leads) of the V-shaped functions in Figure 7, a and b. In contrast, when inhibition was advanced from coincidence, inhibition continued to overlap excitation even when the peaks were well separated. The result was that advancing inhibition tended to have relatively small effects on PSP amplitude, as shown graphically in the relatively shallow slope of the left arm of the V-shape.
The second feature is the relative duration or width of the conductance waveforms. When inhibition and excitation had the same or similar widths, as in Figure 7c, shifting inhibition even a small amount reduced the overlap between excitation and inhibition, thereby decreasing the efficacy of inhibition and increasing PSP amplitude. Graphically, this made a relatively narrow V-shaped amplitude–time shift function. In contrast, when inhibition is substantially wider than excitation (Fig. 7b), advancing inhibition has only a small effect on the PSP amplitude because small advances still did not decrease the overlap between excitation and inhibition. The effect of a relatively broad inhibition was to broaden the V, so that the graph has more of a U-shape with a flatter bottom.
The third feature of importance is the latency difference between the excitation and inhibition in the control responses. When the control excitatory and inhibitory conductances were coincident or nearly coincident, small shifts in the inhibitory timing in either direction caused the inhibition to be less efficacious and resulted in PSP increases (Fig. 7a–c). Graphically, the control latency difference, shown as a gray filled circle, sits near the bottom of the V-shaped curve that plots PSP amplitudes as a function of time shifts. Thus, delaying or advancing inhibition could only increase PSP amplitude.
In contrast, cells in which the control excitation led inhibition, delaying or advancing inhibition had different effects (Fig. 7d). Advances brought inhibition and excitation into closer coincidence, resulting in a decrease in PSP amplitude, whereas delays caused a larger temporal separation between excitation and inhibition and thus resulted in an increase in PSP amplitude. Graphically, the control latency sits in the middle of the right arm. Delaying inhibition, moving to the right (red circles), caused PSP amplitudes to increase, whereas advancing inhibition, moving to the left (blue circles), decreased PSP amplitude. In other cells, the control latency sat on the left arm of the V-shape, i.e., inhibition led excitation in the control condition. In these cases, delaying inhibition decreased the PSP amplitude, whereas advancing inhibition increased the PSP amplitude (data not shown). Thus, the initial timing of excitation and inhibition determined, in part, the effects of timing shifts on PSP amplitude.
These three features, the timing difference between excitation and inhibition under control conditions, the relative width of inhibition compared with excitation, and the asymmetry of inhibition, all affected the change in PSP amplitude with inhibitory shifts.
Changes in PSP amplitudes interact with spike threshold to affect discharge probability
We next consider the relationship between PSP amplitude and spike threshold and suggest how that relationship should translate into firing probability. It should be noted, however, that we treat spike threshold as a fixed rather than as a dynamic value and use PSP amplitude as a proxy for firing probability. Moreover, because the model did not incorporate voltage-gated channels, we do not consider how such channels might alter PSP responses or how parameters such as rate of depolarization (dV/dt) might alter spike threshold. The model only predicts how the timing of excitatory and inhibitory inputs would affect PSP amplitude, and our analysis is limited to how changes in PSP amplitude are likely to affect spiking.
Small changes in PSP amplitudes are likely to affect discharge probability only when the sound-evoked response is near threshold, as was the case in the preferred FM in cell 1 (Fig. 2a) and the null FM in cell 2 (Fig. 3b). We found in the IC that it is common to have responses that are near threshold. We recorded responses to downward and upward FMs that swept the same frequency range while varying intensity and/or sweep speed in 24 cells. In 19 of 24 cells, we recorded a near-threshold response (firing probability of 20–80%) to at least one of the FMs we presented and often to many of those FMs. Furthermore, many of the FMs presented did not evoke spikes but did evoke PSPs that were very close to spike threshold. Although small changes in the timing between excitation and inhibition generate only small changes in PSP amplitudes, we suggest that those small changes are likely to be important determinants of firing probability when the response is close to spike threshold.
Discussion
The major findings of this study are that many IC neurons are relatively insensitive to input timing, and the hypothesis that FM directional preferences are primarily determined by whether excitation precedes is coincident with or follows inhibition is overly simplistic and does not hold for many IC neurons. For the IC neurons in this study, the temporal sequence of excitation and inhibition provided no information about directional preference; inhibition in the null FM responses was not confined to any temporal position relative to excitation and could lead, be coincident with, or even lag behind excitation. Additionally, the PSP evoked by each FM was shaped not only by the relative latency of excitation and inhibition but also by the shapes of the conductance waveform and the magnitudes of the excitatory and inhibitory conductances evoked by that signal.
The influences of conductance timing and magnitude are not equal. We showed in a previous report (Gittelman et al., 2009) that magnitudes always dominate over latencies and thus the relative timing of excitation and inhibition is less important than the relative magnitudes of excitation and inhibition for determining directional preferences. The lesser role that latency plays in creating directional preferences is further underscored by the degree to which small changes in the timing of inhibition relative to excitation changed PSP amplitudes. In most of the cells we tested, 3 ms shifts in the latency of inhibition changed the PSP height by <2 mV.
The impact of delays or advances of inhibition relative to excitation is also complicated by the finding that almost all features of the excitatory and inhibitory conductances change with different signals. Even the upward and downward FMs that we presented to a given cell, which had the same durations, the same intensities, the same frequency compositions, and the same power spectra, each evoked excitatory and inhibitory conductance waveforms that differed in relative latency, waveform shape, and magnitude. Because all of those features essentially determine the timing sensitivity of the cell, the two FMs produced different timing sensitivities in the same cell. This differential timing sensitivity is well illustrated by the changes in PSP amplitudes with timing delays of cell 1 in Figure 2. Delaying inhibition of the preferred FM by 3 ms caused PSP amplitudes to increase by 4.2 mV, whereas the same delay in the null FM caused PSP amplitudes to increase by only 1.2 mV. For the same delays, the increases in PSP amplitudes for the preferred were nearly three times as large as they were for the null. Thus, the timing sensitivity of an IC cell is not a constant but rather varies from signal to signal, because the features of conductances change as signal parameters are varied.
The term “timing” is commonly applied to processes in the auditory system as if it were synonymous with differences in the latencies of excitation and inhibition (Covey and Casseday, 1999; Casseday et al., 2000; Zhang et al., 2003; Fuzessery et al., 2006; Joris and Yin, 2007; Razak and Fuzessery, 2010). As we showed here, timing is more than just the relative latencies of excitation and inhibition. The PSP evoked by a signal is shaped by the interaction among the temporal features of the inputs, the relative latencies of excitation and inhibition, the shapes of the excitatory and inhibitory conductances, together with their magnitudes. Each of those features not only shapes the response evoked by a particular signal, but each also shapes the degree to which PSP amplitudes change as a result of delaying or advancing inhibition relative to excitation.
To all of the above, we need to add the nonlinear influence spike threshold. How the change in PSP amplitude influenced discharge probability was dependent in large part on how close the control PSP was to spike threshold. If PSP amplitude was far from threshold, even substantial changes in PSP amplitude would have little or no effect on spike probability. Conversely, if the PSP amplitude was near threshold, then even a PSP increase or decrease as small as a fraction of a millivolt could affect discharge probability. Thus, there is often a disjunction between the effects of input timing and other changes in signal parameters on the “response” of the cell. On one hand, the changes in the timing of excitation and inhibition generate only small changes in PSP amplitudes, but, on the other hand, the small change in PSP amplitude could be amplified by spike threshold into larger changes in the discharge probability of the cell. Thus, in cells in which signals evoke PSPs close to threshold, even small shifts in timing could potentially change the discharge probability to one of the signals and thus modulate the spiking directional selectivity of the cell.
Footnotes
This work was supported by National Institutes of Health Grants DC007856 and 1F32DC009741. We thank Sari Andoni for helpful comments and discussions. We also thank Carl Resler for technical support.
References
- Andoni S, Li N, Pollak GD. Spectrotemporal receptive fields in the inferior colliculus revealing selectivity for spectral motion in conspecific vocalizations. J Neurosci. 2007;27:4882–4893. doi: 10.1523/JNEUROSCI.4342-06.2007. [DOI] [PMC free article] [PubMed] [Google Scholar]
- Bauer EE, Klug A, Pollak GD. Features of contralaterally evoked inhibition in the inferior colliculus. Hear Res. 2000;141:80–96. doi: 10.1016/s0378-5955(99)00206-3. [DOI] [PubMed] [Google Scholar]
- Bohn KM, Schmidt-French B, Ma ST, Pollak GD. Syllable acoustics, temporal patterns, and call composition vary with behavioral context in Mexican free-tailed bats. J Acoust Soc Am. 2008;124:1838–1848. doi: 10.1121/1.2953314. [DOI] [PMC free article] [PubMed] [Google Scholar]
- Brimijoin WO, O'Neill WE. On the prediction of sweep rate and directional selectivity for FM sounds from two-tone interactions in the inferior colliculus. Hear Res. 2005;210:63–79. doi: 10.1016/j.heares.2005.07.005. [DOI] [PMC free article] [PubMed] [Google Scholar]
- Casseday JH, Ehrlich D, Covey E. Neural measurement of sound duration: control by excitatory-inhibitory interactions in the inferior colliculus. J Neurophysiol. 2000;84:1475–1487. doi: 10.1152/jn.2000.84.3.1475. [DOI] [PubMed] [Google Scholar]
- Casseday JH, Fremouw T, Covey E. The inferior colliculus: a hub for the central auditory system. In: Oertel D, Popper AN, Fay RR, editors. Integrative functions in the mammalian auditory pathway. New York: Springer; 2002. pp. 238–318. [Google Scholar]
- Covey E, Casseday JH. Timing in the auditory system of the bat. Annu Rev Physiol. 1999;61:457–476. doi: 10.1146/annurev.physiol.61.1.457. [DOI] [PubMed] [Google Scholar]
- Doupe AJ, Kuhl PK. Birdsong and human speech: common themes and mechanisms. Annu Rev Neurosci. 1999;22:567–631. doi: 10.1146/annurev.neuro.22.1.567. [DOI] [PubMed] [Google Scholar]
- Fuzessery ZM, Hall JC. Role of GABA in shaping frequency tuning and creating FM sweep selectivity in the inferior colliculus. J Neurophysiol. 1996;76:1059–1073. doi: 10.1152/jn.1996.76.2.1059. [DOI] [PubMed] [Google Scholar]
- Fuzessery ZM, Richardson MD, Coburn MS. Neural mechanisms underlying selectivity for the rate and direction of frequency-modulated sweeps in the inferior colliculus of the pallid bat. J Neurophysiol. 2006;96:1320–1336. doi: 10.1152/jn.00021.2006. [DOI] [PubMed] [Google Scholar]
- Gittelman JX, Li N, Pollak GD. Mechanisms underlying directional selectivity for frequency modulated sweeps in the inferior colliculus revealed by in vivo whole-cell recordings. J Neurosci. 2009;29:13030–13041. doi: 10.1523/JNEUROSCI.2477-09.2009. [DOI] [PMC free article] [PubMed] [Google Scholar]
- Holy TE, Guo Z. Ultrasonic songs of male mice. PLoS Biology. 2005;3:e386. doi: 10.1371/journal.pbio.0030386. [DOI] [PMC free article] [PubMed] [Google Scholar]
- Jeffress LA. A place theory of sound localization. J Comp Physiol Psychol. 1948;41:35–39. doi: 10.1037/h0061495. [DOI] [PubMed] [Google Scholar]
- Joris P, Yin TC. A matter of time: internal delays in binaural processing. Trends Neurosci. 2007;30:70–78. doi: 10.1016/j.tins.2006.12.004. [DOI] [PubMed] [Google Scholar]
- Klug A, Bauer EE, Pollak GD. Multiple components of ipsilaterally evoked inhibition in the inferior colliculus. J Neurophysiol. 1999;82:593–610. doi: 10.1152/jn.1999.82.2.593. [DOI] [PubMed] [Google Scholar]
- Koch U, Grothe B. GABAergic and glycinergic inhibition sharpens tuning for frequency modulations in the inferior colliculus of the big brown bat. J Neurophysiol. 1998;80:71–82. doi: 10.1152/jn.1998.80.1.71. [DOI] [PubMed] [Google Scholar]
- McAlpine D, Grothe B. Sound localization and delay lines: do mammals fit the model? Trends Neurosci. 2003;26:347–350. doi: 10.1016/S0166-2236(03)00140-1. [DOI] [PubMed] [Google Scholar]
- Poon PW, Chen X, Hwang JC. Basic determinants for FM responses in the inferior colliculus of rats. Exp Brain Res. 1991;83:598–606. doi: 10.1007/BF00229838. [DOI] [PubMed] [Google Scholar]
- Portfors CV, Roberts PD, Jonson K. Over-representation of species-specific vocalizations in the awake mouse inferior colliculus. Neuroscience. 2009;162:486–500. doi: 10.1016/j.neuroscience.2009.04.056. [DOI] [PubMed] [Google Scholar]
- Priebe NJ, Ferster D. Direction selectivity of excitation and inhibition in simple cells of the cat primary visual cortex. Neuron. 2005;45:133–145. doi: 10.1016/j.neuron.2004.12.024. [DOI] [PubMed] [Google Scholar]
- Razak KA, Fuzessery ZM. Neural mechanisms underlying selectivity for the rate and direction of frequency-modulated sweeps in the auditory cortex of the pallid bat. J Neurophysiol. 2006;96:1303–1319. doi: 10.1152/jn.00020.2006. [DOI] [PubMed] [Google Scholar]
- Razak KA, Fuzessery ZM. GABA shapes selectivity for the rate and direction of frequency modulated sweeps in the auditory cortex. J Neurophysiol. 2010;104:517–528. doi: 10.1152/jn.00334.2009. [DOI] [PMC free article] [PubMed] [Google Scholar]
- Suga N. Feature extraction in the auditoy system of bats. In: Moller AR, editor. Basic mechanisms in hearing. New York: Academic; 1973. pp. 675–744. [Google Scholar]
- Suga N, Schlegel P. Coding and processing in the auditory systems of FM-signal-producing bats. J Acoust Soc Am. 1973;54:174–190. doi: 10.1121/1.1913561. [DOI] [PubMed] [Google Scholar]
- Vater M, Schlegel P, Zoller H. Comparative auditory neurophysiology of the inferior colliculus of two Molossid bats, Molossus ater and Molossus molossus. J Comp Physiol. 1979;131:137–145. [Google Scholar]
- Wang X, Merzenich MM, Beitel R, Schreiner CE. Representation of a species-specific vocalization in the primary auditory cortex of the common marmoset: temporal and spectral characteristics. J Neurophysiol. 1995;74:2685–2706. doi: 10.1152/jn.1995.74.6.2685. [DOI] [PubMed] [Google Scholar]
- Xie R, Gittelman JX, Pollak GD. Rethinking tuning: in vivo whole-cell recordings of the inferior colliculus in awake bats. J Neurosci. 2007;27:9469–9481. doi: 10.1523/JNEUROSCI.2865-07.2007. [DOI] [PMC free article] [PubMed] [Google Scholar]
- Ye CQ, Poo MM, Dan Y, Zhang XH. Synaptic mechanisms of direction selectivity in primary auditory cortex. J Neurosci. 2010;30:1861–1868. doi: 10.1523/JNEUROSCI.3088-09.2010. [DOI] [PMC free article] [PubMed] [Google Scholar]
- Yin TC, Chan JC. Interaural time sensitivity in medial superior olive of cat. J Neurophysiol. 1990;64:465–488. doi: 10.1152/jn.1990.64.2.465. [DOI] [PubMed] [Google Scholar]
- Yue Q, Casseday JH, Covey E. Response properties and location of neurons selective for sinusoidal frequency modulations in the inferior colliculus of the big brown bat. J Neurophysiol. 2007;98:1364–1373. doi: 10.1152/jn.00432.2007. [DOI] [PubMed] [Google Scholar]
- Zhang LI, Tan AY, Schreiner CE, Merzenich MM. Topography and synaptic shaping of direction selectivity in primary auditory cortex. Nature. 2003;424:201–205. doi: 10.1038/nature01796. [DOI] [PubMed] [Google Scholar]