Abstract
Background and Aims
To understand whether root responses to aerial rhythmic growth and contrasted defoliation treatments can be interpreted under the common frame of carbohydrate availability; root growth was studied in parallel with carbohydrate concentrations in different parts of the root system on oak tree seedlings.
Methods
Quercus pubescens seedlings were submitted to selective defoliation (removal of mature leaves, cotyledons or young developing leaves) at appearance of the second flush and collected 1, 5 or 10 d later for morphological and biochemical measurements. Soluble sugar and starch concentrations were measured in cotyledons and apical and basal root parts.
Key Results
Soluble sugar concentration in the root apices diminished during the expansion of the second aerial flush and increased after the end of aerial growth in control seedlings. Starch concentration in cotyledons regularly decreased. Continuous removal of young leaves did not alter either root growth or apical sugar concentration. Starch storage in basal root segments was increased. After removal of mature leaves (and cotyledons), root growth strongly decreased. Soluble sugar concentration in the root apices drastically decreased and starch reserves in the root basal segments were emptied 5 d after defoliation, illustrating a considerable shortage in carbohydrates. Soluble sugar concentrations recovered 10 d after defoliation, after the end of aerial growth, suggesting a recirculation of sugar. No supplementary recourse to starch in cotyledons was observed.
Conclusions
The parallel between apical sugar concentration and root growth patterns, and the correlations between hexose concentration in root apices and their growth rate, support the hypothesis that the response of root growth to aerial periodic growth and defoliation treatments is largely controlled by carbohydrate availability.
Keywords: Apex, carbohydrate, defoliation, hexose, organ removal, Quercus pubescens, rhythmic growth, root growth, starch
INTRODUCTION
Many forest tree species, including oak trees, are characterized by shoot rhythmic growth, manifested by a series of shoot flushes (Champagnat et al., 1986). Rapid stem and leaf expansion alternate with periods of terminal bud development and apparent rest (with no shoot elongation nor leaf emergence). Periodic physiological modifications in shoot growth intensity linked to flushing events have been described only in aerial organs and mainly for the Quercus pedonculata species. These studies suggest among other hypotheses the influence of temporal modifications in source/sink balance and carbon allocation in the aerial part of the young tree (Barnola et al., 1993; Le Hir et al., 2006). Physiological changes in the apical bud indicate that their sink strength evolves over a growth cycle (Alatou et al., 1989). During intense growth of a new flush, source leaves allocate most assimilates to the expanding leaves and stem rather than to the terminal apex (Dickson et al., 2000; Le Hir et al., 2006), and stem carbohydrate reserves are temporarily mobilized (Alaoui-Sossé, 1994). Mobilization of carbohydrate from the root during intense shoot growth has been described but considered as minor (Alatou et al., 1989).
Young trees are also usually subject to various damages to aerial parts. Leaves can be damaged or seedlings defoliated by invertebrates or cattle grazing (Andersson, 1996). Cotyledons are often eaten by predators such as jays or rodents (Sonesson, 1994; Kabeya, 2003). Damage and loss of leaves and stems (either sources or sinks or storage organs of photosynthate) can modify carbohydrate allocation patterns and plant development. Several studies have shown some global influences of the removal of aerial parts on root development. Repeated clippings of grasses affect root growth (Harradine and Whalley, 1981) and decrease below-ground biomass (Ferraro and Oesterheld, 2002). Defoliation of wheat to a single leaf reduces root growth rate and root respiration rate (Bingham and Stevenson, 1993, Bingham et al., 1996). Partial canopy removal of citrus trees leads to a transient reduction in root growth and a decrease in root starch reserves (Eissenstat and Duncan, 1992), but carbohydrate dynamics within the root system remain unknown.
A detailed and dynamic analysis of the morphological responses of the root system to aerial periodic growth patterns and to defoliation treatments (young leaves, mature leaves, cotyledons) has already been reported (Willaume and Pagès, 2006). During intense shoot growth, a transient decrease in taproot and lateral root elongation and a concomitant decrease in taproot apical diameter were observed. Root growth in young oak trees or in rubber trees is sensitive to the temporal variation in the source/sink balance (Thaler and Pagès, 1996b; Willaume and Pagès, 2006). Removals of source organs for carbohydrates (mature leaves, cotyledons) accentuate these root responses. On the other hand, continuous removal of sink organs (young leaves) initially maintains root elongation and branching characteristics, after which elongation slightly decreases.
To interpret these morphological responses, a direct influence of carbohydrate availability through modified allocations in plants was suggested. This hypothesis provided coherent explanations for all our morphological observations and was inspired by previous researches showing a strong relationship between root development and other artificial modifications in carbohydrate availability. Reduction of light availability reduces root growth in various species such as sunflower, rubber tree seedlings, maize or arabidopsis (Aguirrezabal et al., 1994; Thaler and Pagès, 1996a; Müller et al., 1998; Freixes et al., 2002). In wheat and arabidopsis, feeding roots with exogenous sugar can restore, to a certain extent, root growth reduced by shading or pruning (Bingham and Stevenson, 1993; Freixes et al., 2002). Variations in root growth have been linked to local changes in sugar concentrations of the corresponding roots (Farrar and Jones, 1986; Bingham and Stevenson, 1993; Müller et al., 1998; Freixes et al., 2002). Carbohydrates can influence root development acting as substrate for metabolism, but also as regulatory signals (Sheen et al., 1999; Koch et al., 2000), as inferred by studies on root respiratory activity (Bingham and Farrar, 1988; Bingham et al., 1996).
To understand better root response to rhythmic growth and defoliation treatments, two questions must be asked. (1) What are the modifications in carbohydrate distribution between the different parts of a root system, paying particular attention to the – the growing zones and the most distal root parts – and to the mobilization of stored carbohydrates? (2) Can a robust link be demonstrated between modifications in carbohydrate allocation and dynamic variations in root growth? This would support the hypothesis that in both cases of rhythmic growth and various defoliations, root response is mainly controlled by carbohydrate availability.
To answer these questions, we proposed studying growth response and detailed carbohydrate patterns in roots at the same time. Thus temporal variations in soluble sugar and starch concentrations in different parts of the plant were quantitatively studied, focusing on the root system, basal segments and cotyledons, known as storage sites, as well as apical and subapical segments, active elongation and branching sites, respectively. The time variations in carbohydrate concentrations were compared with the root growth response.
MATERIALS AND METHODS
Plant material
Acorns of Quercus pubescens were collected from a single tree to reduce genetic variation, on Mont Ventoux, in south-eastern France (44 °10′N 5 °17′E). Only acorns around the mean weight (3·7 ± 0·3g) were used. The shells were removed and the acorns were placed in a moist mixture of sieved peat and vermiculite (2 : 1) at 24 °C for 3 d to allow germination.
Growth conditions
Ninety plants with at least a 5-mm-long taproot were selected and placed in PVC pots (height 130 cm, diameter 10 cm), filled with a mixture of sieved peat and vermiculite (2 : 1).
The plants were placed in a growth chamber at 24 °C/20 °C (day/night), with 70 ± 5 % relative humidity and 16 h of daylight. Photosynthetically active radiation averaged 200 µmol m−2 s−1. The plants were watered every day until drainage with a half-strength modified Hoagland nutrient solution (Goutouly and Habib, 1996).
Treatments: selective defoliation
Although all seedlings had germinated on the same day, the day of appearance of visible leaves of the second flush varied between seedlings. This value was determined on an individual basis and is referred to as t0.
Four treatments were considered. (1) Control seedlings (24 seedlings) were left intact (control). In contrast, other seedlings were manually defoliated at t0 (when visible leaves of the second flush appeared) by removing: (2) mature leaves of the first flush (ML – 24 seedlings); (3) cotyledons and mature leaves of the first flush (CML – 18 seedlings); (4) young leaves (<5 mm long) of the second flush as soon as they appeared (YL – 24 seedlings). Treatment (4) was applied every day until the end of the experiment.
Seedlings reaching t0 on the same day were distributed in equal number between the different treatments. In this way, there were seedlings with various development rates in each treatment.
As a central feature of the experiments, t0 was chosen as a time reference to study later developmental and biochemical kinetics. Time is thereafter counted from this day on.
Sampling and measurements
Seedlings were sampled at three different stages (1, 5 or 10 d after t0). At each stage, six (CML) or eight (control, ML and YL) seedlings per treatment were collected. Seedlings were taken out of the growing medium at the beginning of the photoperiod, when total taproot length (Le) was recorded and the distal 25 cm of the taproot and associated lateral roots were scanned (resolution 600 dpi) for architectural measurements.
For each seedling, the cotyledons, the basal zone of the taproot (50 mm long) and the apical zone (10 mm long) of two white lateral roots were scanned and collected. Apical (10 mm long) and subapical (remaining unbranched apical zone) taproot zones were collected from half of the plants in each (stage × treatment) combination. In an independent experiment, it was shown that 10-mm apical segments encompass the meristem and the whole elongation zone. Twelve taproots were gently marked with black ink at regular intervals (1 mm) starting from the root apex. Pictures of the roots were taken four times at 5-h intervals. The displacement of marks from the apex showed that the length of the elongation zone of the taproot averaged 7 mm and never exceeded 10 mm (data not shown). Subapical segments encompass the region where developing primordia can be seen.
The different samples were scanned and immediately immersed in liquid nitrogen, temporarily stored at –18 °C, separately freeze-dried and ground to a fine powder for further analysis. Dried samples were weighed on an analytical balance (Sartorius Genius ME215P, Germany).
All pictures taken were further analysed using image analysis software (ImageJ, National Institutes of Health, USA; http://rsb.info.nih.gov/ij/).
Volume calculation and choice of units
Apical root segments were considered as a stack of ten cylinders of different lengths and diameters. Dimensions for volume calculation were measured using Image J on scanned pictures. For very small pieces (≤1 mg) such as apices, volume calculation is more accurate than weight measurement with the available equipment (repeatability error: 1 % and 10 %, respectively). Concentrations were thus calculated relative to volume (μg mm−3) in apical segments and relative to weight (μg 100 µg−1 d. wt) for other samples. Since volumetric mass in apical segments was 0·1 mg mm−3 (± 0·01), both units approximately correspond without supplementary conversion.
Morphological traits
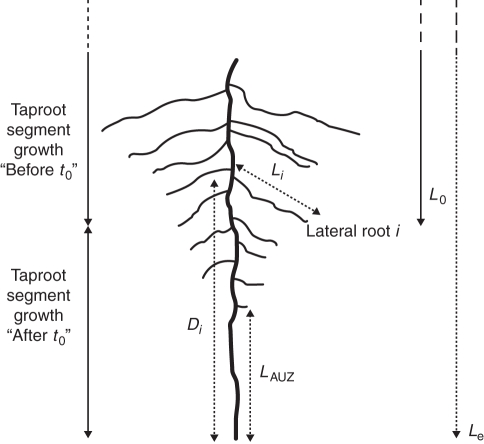
The length of the apical unbranched zone of the taproot (LAUZ), the distance between the taproot apex and the point of insertion of each lateral root i (Di), and the length of all laterals (Li) were measured on the pictures of the distal taproot samples of seedlings collected 10 d after t0 (Fig. 1).
Fig. 1.
Schematic representation of a distal taproot segment and associated laterals. Dotted arrows are lengths measured on scanned images; solid arrows are estimated lengths. LAUZ = Length of the apical unbranched zone of the taproot, Le = total taproot length at excavation, Li = length of the lateral root i, Di = distance between taproot apex and point of insertion of lateral root i (Di) and L0 = estimated taproot length at t0.
Taproot growth rates
Taproot growth rates were individually estimated from morphological measurements on seedlings collected 10 d after t0.
The length of the apical unbranched zone (LAUZ) is linearly linked to mean taproot growth rate during the preceding days (Aguirrezabal et al., 1994; Pagès and Serra, 1994; Lecompte et al., 2001) and especially over the last 24 h (Pagès et al., 2010). To interpret this correlation, the authors have established that the minimum time lag between the passage of a root apex at a given point and the emergence of a lateral root at this point is constant. This is referred to as the minimum time lag before branching (TBB). In an independent study, it was shown that TBB in young oak trees is around 4·5 d (see Willaume and Pagès, 2006; Materials and methods).
The taproot growth rate 10 d ‘after t0’ (GA) was thus calculated as
The mean taproot growth rate ‘before t0’ (GB) was deduced from the time elapsed between sowing of the seedling and t0 (A0) and the estimated taproot length at t0 (L0):
The taproot length at t0 (L0) was the difference between the total taproot length measured at excavation (Le) and an estimation of taproot growth between t0 and the time of excavation, i.e. 10 d.
These relationships were validated in an independent experiment in which young oak trees were grown under the same conditions and submitted to the same treatments, but were placed in root boxes so that the root system was visible. The measured taproot growth rate was compared with the taproot growth rate which was calculated by the method presented here. The estimation error was lower than 10 % on GA and lower than 5 % on GB.
Age and growth rate of lateral roots
The age from emergence Ai of each lateral root i located on the sampled taproot segment was estimated from the distance between the taproot apex and its point of insertion (Di), and the estimated taproot growth rate.
Only lateral roots that emerged after t0 (Ai < 10) were further considered. The mean growth rate of each lateral root (Gi) was estimated from its measured length (Li) and estimated age.
By comparison with measurements in root observation boxes, the estimation error was lower than 10 % for the age of lateral roots and never exceeded 0·1 cm d−1 for mean growth rate.
Soluble sugar and starch concentration
Soluble sugar and starch concentration measurements were performed by enzyme-coupled colorimetric assay on microplates (Gomez et al., 2007). Soluble sugar concentration was measured on whole samples for apical zones and on an aliquot (8 mg) for other organs. Starch concentration was measured on residual aliquot powders of basal root segments and cotyledons.
The soluble sugar extraction method was adapted from Gomez et al. (2002). Each sample was placed in 1 mL of methanol and 300 µL of chloroform for 20 min at +4 °C. After centrifugation (10 min, 12 000 g, +4 °C), 750 µL supernatant was dried under vacuum. The extracts were covered with 5 mg of polyvinylpolypyrrolidone for purification, and suspended in 750 µL of ultra-pure water. Supernatant collected after centrifugation (10 min, 12 000 g, +4 °C) was used for assays.
The starch extraction method was adapted from Gomez et al. (2003). Residual powder was washed successively with 1 mL of methanol and 200 µL of ethanol (used for storage), and then dried under vacuum. Powder was suspended in 500 µL of ultra-pure water, and starch was dispersed by autoclave (1 h, 2 bars, 110 °C). Starch was then hydrolysed with an amyloglucosidase solution (1 h 30 min in a water bath at 56 °C). Supernatant collected after centrifugation (10 min, 12 000 g, +4 °C) was used for assays.
Glucose, fructose and sucrose concentrations were quantified, one after the other, by spectrophotometric measurement of NADH production. Extracts were diluted to obtain a final sugar concentration appropriate for the calibration standard (0–0·2 g L−1 for glucose, fructose and sucrose). Correctly diluted extract (150 µL) and an ATP-NAD solution (100 µL) were loaded on ELISA microtitre plates with 96 wells. Twenty microlitres of a glucose-6-phosphate-dehydrogenase solution, 20 µL of a phospho-glucose isomerase solution and 20 µL of an invertase solution were successively added with a minimum 2-h time lag. Absorbance at 340 nm was measured between each addition (MP reader; Multiskan Ascent–Labsystems, Finland). The successive increases in absorbance were interpreted as the appearance of NADH+, directly proportional to the successive transformations of the soluble sugars in the extract. For starch extracts, only glucose concentration was measured and converted. It should be mentioned that sucrose concentrations in cotyledons were missing.
As expected, glucose and fructose concentrations were highly correlated (Freixes et al., 2002), regardless of the organ (r between 0·87 and 0·94). They were thus further pooled as hexose concentration.
Data analysis
All data analyses and statistical tests were performed using R software (R: A Language and Environment for Statistical Computing, R Foundation for Statistical Computing, Austria; http://www.r-project.org/). Student's t-tests (P < 0·05 or P < 0·01) or Kolmogorov–Smirnov tests (P < 0·01) were performed to compare means. Tests for correlation between paired samples used Pearson's product moment correlation coefficient (P < 0·05). Homogeneity of variances was checked using Bartlett's tests (P < 0·05).
RESULTS
Mean taproot growth rate
On control seedlings, the mean growth rate after t0 was not significantly different – although lower – from the growth rate before t0 (Table 1). Removal of mature leaves (ML) and removal of both cotyledons and mature leaves (CML) reduced the mean taproot growth rate by at least 50 %. Taproot growth rate was not altered by the removal of young leaves (YL).
Table 1.
Mean (± s.d.) estimated taproot growth rate before and 10 d after t0 (appearance of visible leaves of second flush, day of defoliation)
| GB taproot growth rate before t0 (cm d−1) | GA taproot growth rate 10 d after t0 (cm d−1) | |
|---|---|---|
| Control, no leaves removed | 1·90 ± 0·37a | 1·44 ± 0·62ab |
| CML, removal of cotyledons and mature leaves | 1·90 ± 0·37a | 0·78 ± 0·52b |
| ML, removal of mature leaves | 1·90 ± 0·37a | 0·97 ± 0·30b |
| YL, continuous removal of young leaves | 1·90 ± 0·37a | 2·03 ± 0·53a |
Values with the same letter indicate non-significant differences within both columns and lines (crossed Student's t-test, P < 0·01).
Lateral root growth rate
Distribution of growth rate of lateral roots (LR) was skewed (Fig. 2). In control seedlings, 75 % of LR had growth rates lower than 0·5 cm d−1, but some LR reached rates close to 1 cm d−1 (Fig. 2A). Median and distribution were not significantly altered by the removal of young leaves (Fig. 2D).
Fig. 2.
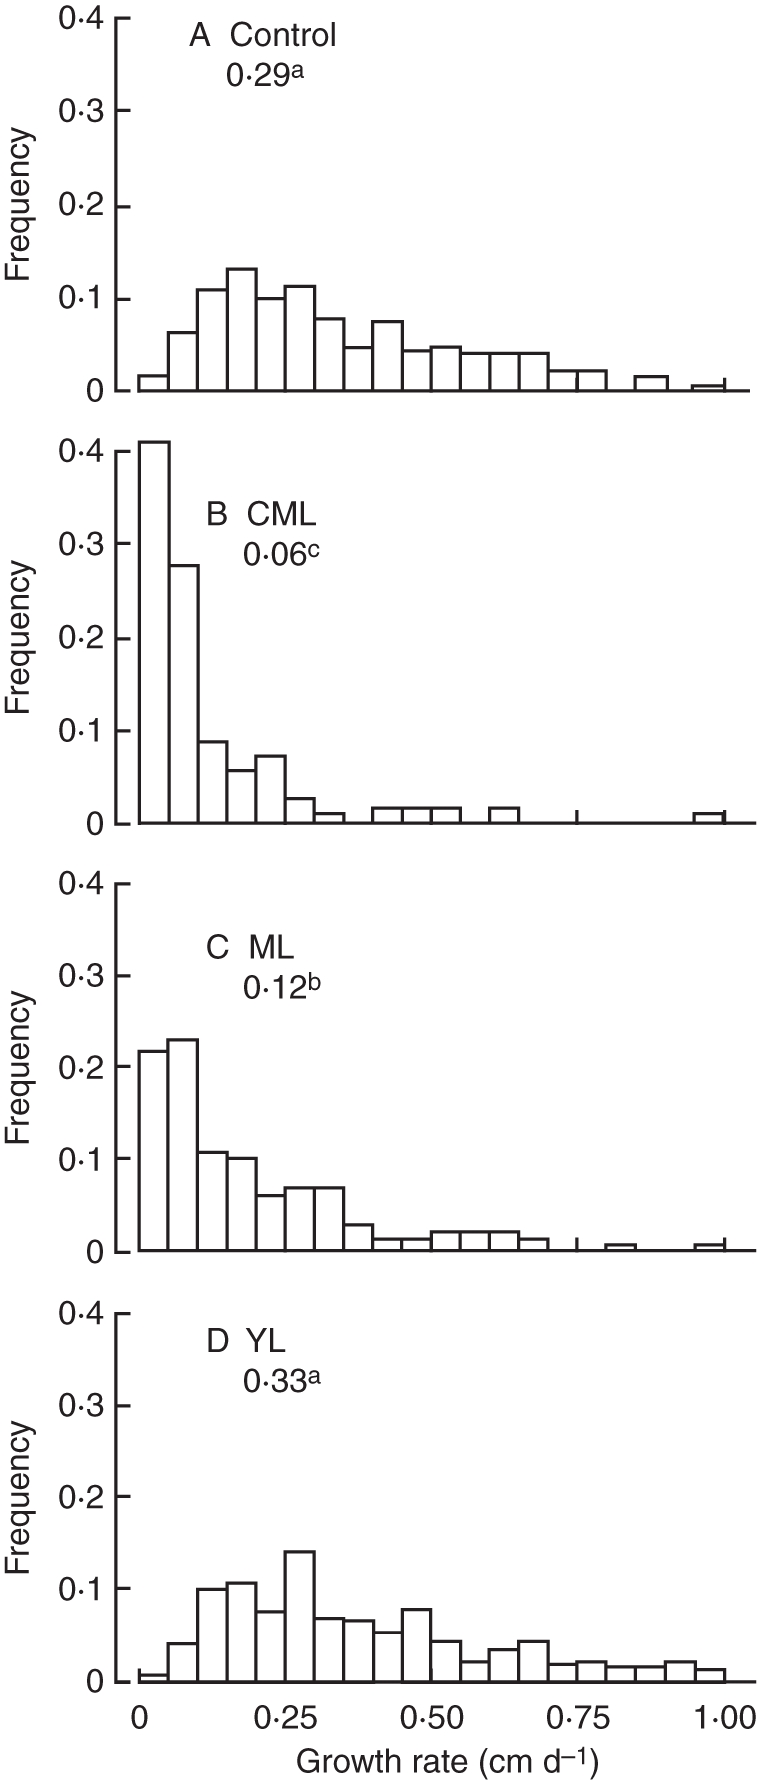
Histograms of estimated lateral root growth rate (cm d−1): (A) Control, no leaves removed; (B) CML, removal of cotyledons and mature leaves; (C) ML, removal of mature leaves; (D) YL, continuous removal of young leaves. Values on each histogram are the median growth rate for the corresponding treatment; values with the same letter indicate non-significant differences (crossed Kolmogorov–Smirnov test, P < 0·01).
Distribution of the LR growth rate significantly tended towards lower values when source organs were removed. Of ML seedlings, <5 % of LR grew faster than 0·5 cm d−1. The median growth rate of LR was 2·5 times lower than in control seedlings, and 70 % of LR had a mean growth rate lower than 0·2 cm d−1 (Fig. 2C). In CML seedlings, the median LR growth rate was <1/5 of the control and 80 % of LR had a mean growth rate lower than 0·2 cm d−1 (Fig. 2B).
Soluble sugar concentration of taproot and LR apices
In control seedlings, hexose concentrations 1 d after t0 averaged 10·4 µg mm−3 in taproot apices (Fig. 3A) and 16·3 µg mm−3 in LR apices (Fig. 3B). Hexose concentration decreased 5 d after t0 by around 30 %. Sucrose concentration 1 d after t0 averaged 4·6 µg mm−3 in taproot apices (Fig. 3C) and 4·4 µg mm−3 in LR apices (Fig. 3D). It significantly decreased by 55 % in taproot apices, but not significantly in LR apices. In taproot apices, hexose and sucrose concentrations recovered unequally: the variance of sugar concentrations was significantly increased 10 d after t0 (Fig. 3A–C).
Fig. 3.

Mean (± s.d.) hexose and sucrose concentrations in (A, C) taproot apices (n = 45), (B, D) lateral root (LR) apices (n = 180), collected at different times after t0 (1, 5, 10 d) for control, YL, ML and CML seedlings, as indicated. In each graph, values with the same letter indicate non-significant differences (crossed Student's t-test, P < 0·05).
In YL seedlings, neither hexose nor sucrose concentration varied significantly over time, regardless of the apices considered. Soluble sugar concentration was always equal to or higher than in other treatments (Fig. 3) and was often close to the concentration in control seedlings.
In CML seedlings, hexose and sucrose concentrations were lower than in control seedlings as soon as day 1 after t0, both in taproot (Fig. 3A and B) and LR apices (Fig. 3B and D). Early responses in ML seedlings were weaker than in CML seedlings and significant only for hexose concentration in LR apices (Fig. 3B). Both ML and CML seedlings had very low sugar concentrations in apices 5 d after t0 (maximum 1·2 µg mm−3 for hexose and 1·9 µg mm−3 for sucrose). The trend toward recovery on day 10 was incomplete and highly variable (Fig. 3).
Sucrose and hexose had comparable patterns. Their concentrations in apices were highly correlated (r2 = 0·67 and 0·77 for taproot and LR apices, respectively).
Soluble sugar concentration of subapical taproot segments
In control and YL seedlings, neither hexose nor sucrose concentration varied significantly over time and averaged 11·6 and 2 µg 100 µg−1 d. wt, respectively (Fig. 4). Soluble sugar concentrations were always equivalent or higher than in the other treatments.
Fig. 4.
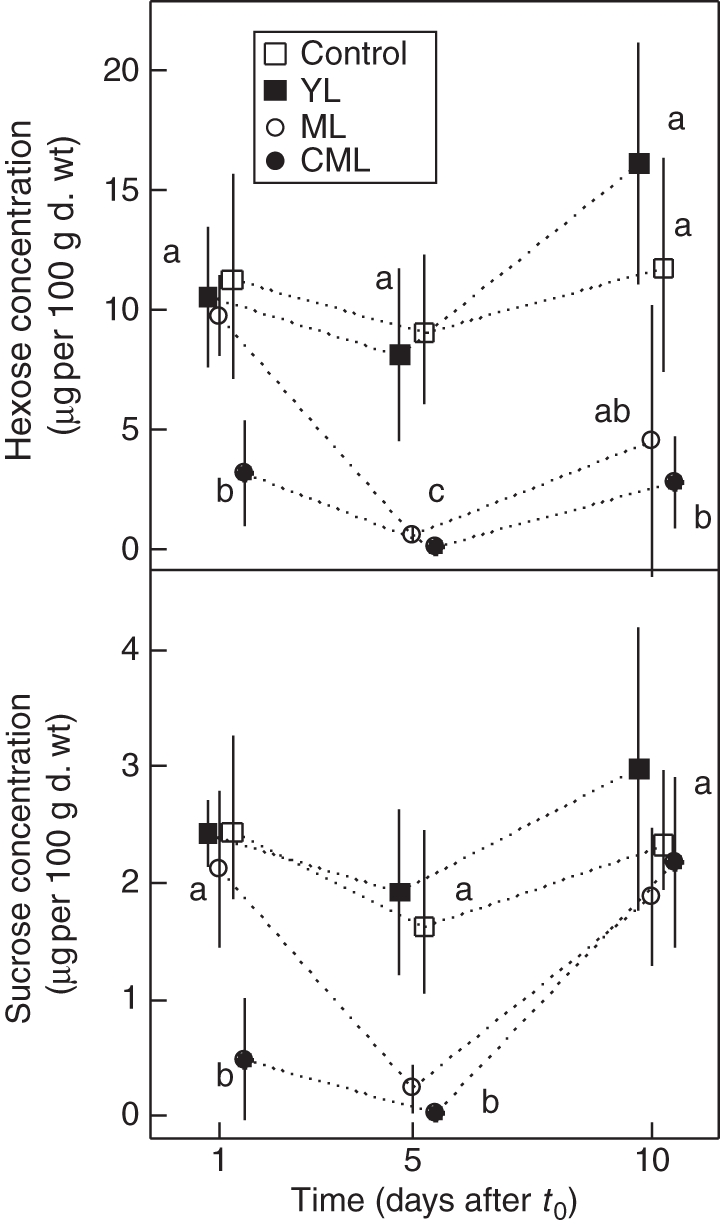
Mean (± s.d.) hexose and sucrose concentrations in taproot subapical segments (n = 45) collected at different times after t0 (1, 5, 10 d) for control, YL, ML and CML seedlings, as indicated. In each graph, values with the same letter indicate non-significant differences (crossed Student's t-test, P < 0·05).
In ML seedlings, hexose concentration on day 5 after t0 was <1/15 of the concentration at t0 + 1. Sucrose concentration also dramatically dropped by 90 %. Recovery in hexose concentration 10 d after t0 was highly variable between individuals (from 1·1 to 12 µg−1 d. wt). Sucrose concentration recovered more systematically and reached values equivalent to day 1.
Soluble sugar concentration decreased considerably from day 1 after t0 on CML seedlings (3·2 µg 100 µg−1 d. wt and 0·5 µg 100 µg−1 d. wt for hexose and sucrose, respectively) and was still lower 5 d after t0. Recovery 10 d after t0 was weak for hexose, whereas sucrose concentrations reached values equal to the control.
Hexose and starch concentration of cotyledons
Hexose concentration significantly decreased over time (ANOVA, P < 0·05) in equal proportion on ML and control seedlings (Fig. 5). Hexose concentration remained constant in YL seedlings. Starch concentration decreased over time (ANOVA, P < 0·05) in the same way in the control, ML and YL seedlings. Cotyledons collected at t0 on CML seedlings had hexose and starch concentrations equivalent to those of cotyledons of other treatments 1 d later (Fig. 5).
Fig. 5.
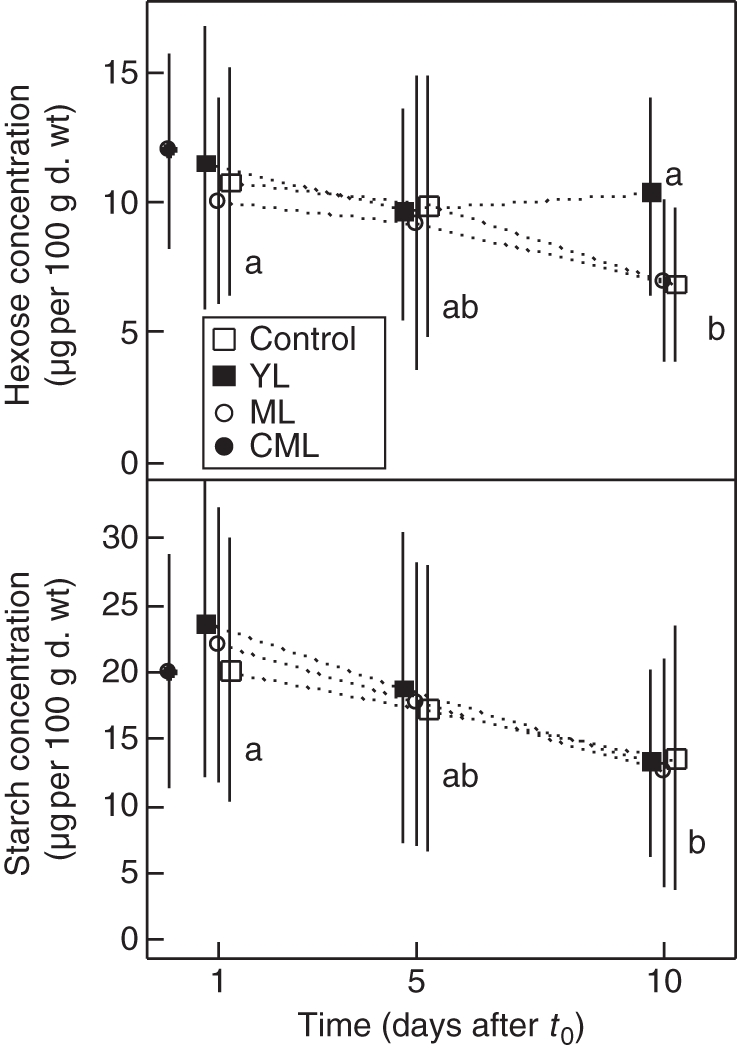
Mean (± s.d.) hexose and starch concentrations in cotyledons (n = 90) collected at different times after t0 (0, 1, 5, 10 d) for control, YL, ML and CML seedlings, as indicated. In each graph, values with the same letter indicate non-significant differences (crossed Student's t-test, P < 0·05).
Soluble sugar and starch concentration of basal taproot segments
Regardless of the treatment, basal segments had low hexose concentration on day 1 (1·4 µg 100 µg−1 d. wt on average; Fig. 6). It did not vary over time in YL seedlings and progressively increased in control seedlings until it reached 4·2 µg 100 µg−1 d. wt on day 10. In ML and CML seedlings, hexose concentration in basal root segments increased considerably but unequally between days 5 and 10.
Fig. 6.
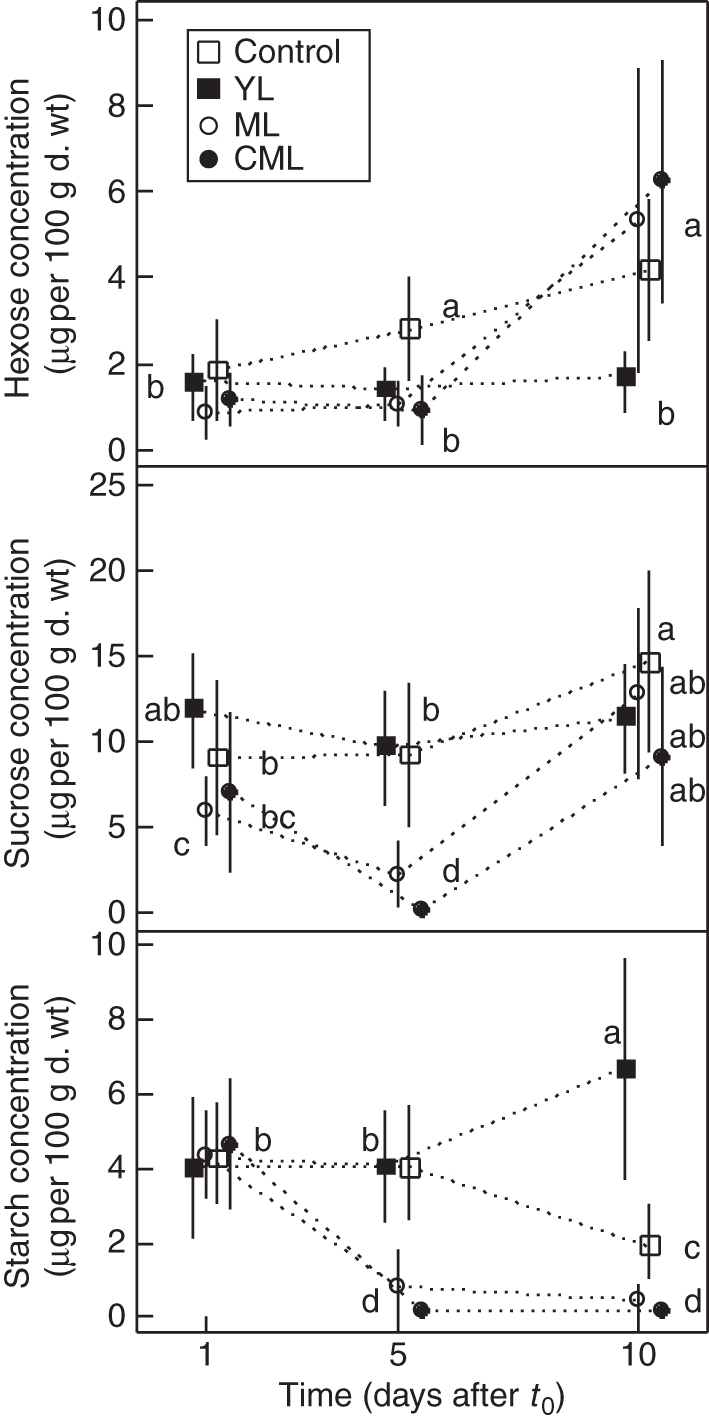
Mean (± s.d.) hexose, sucrose and starch concentrations in taproot basal segments (n = 90) collected at different times after t0 (0, 1, 5, 10 d) for control, YL, ML and CML seedlings, as indicated. In a graph, values with the same letter indicate non-significant differences (crossed Student's t-test, P < 0·05).
Sucrose concentration on day 1 after t0 averaged 8·5 µg 100 µg−1 d. wt, which was relatively high compared with more distal root segments but was quite variable between treatments, gradually decreasing from YL, control, CML and ML seedlings, respectively. For YL and control seedlings, sucrose concentration remained constant over time. On day 5, it was decreased by 2/3 for ML seedlings and even more drastically in CML seedlings (between 0·1 and 0·9 µg.100 µg−1 d. wt). On day 10, the sucrose concentration in defoliated seedlings recovered higher values equivalent to other treatments.
Mean starch concentration 1 d after t0 was 4·3 µg 100 µg−1 d. wt. It remained unchanged for control seedlings between days 1 and 5 after t0, and then decreased by 50 % on day 10. Starch concentration also remained constant for YL seedlings between days 1 and 5 after t0 but, in contrast, increased by 50 % on day 10. Starch concentration steeply decreased for ML and CML seedlings between days 1 and 5, reaching a mean value of 0·5 µg 100 µg−1 d. wt, and did not recover on day 10.
Relationship between hexose concentration and estimated growth rate
Figure 7 shows relationships between hexose concentration and estimated growth rate of the taproots (Fig. 7A) and sampled LR (Fig. 7B) only for seedlings collected 10 d after t0. As expected from previous observations, the highest sugar concentrations and highest growth rate were observed on YL seedlings, whereas the lowest sugar concentrations and lowest growth rate were found on CML seedlings. ML and control seedlings showed mixed and intermediate results. Hexose concentration in the apices was significantly correlated to estimated growth rate in taproot (r2 = 0·31, P = 0·02) and in LR (r2 = 0·40, P = 1·6·10−7). Since sucrose concentration was highly correlated to hexose in the apices, sucrose was also significantly correlated to taproot growth rate (r2 = 0·30, P = 0·03) and LR growth rate (r2 = 0·28, P = 2·3·10−5).
Fig. 7.
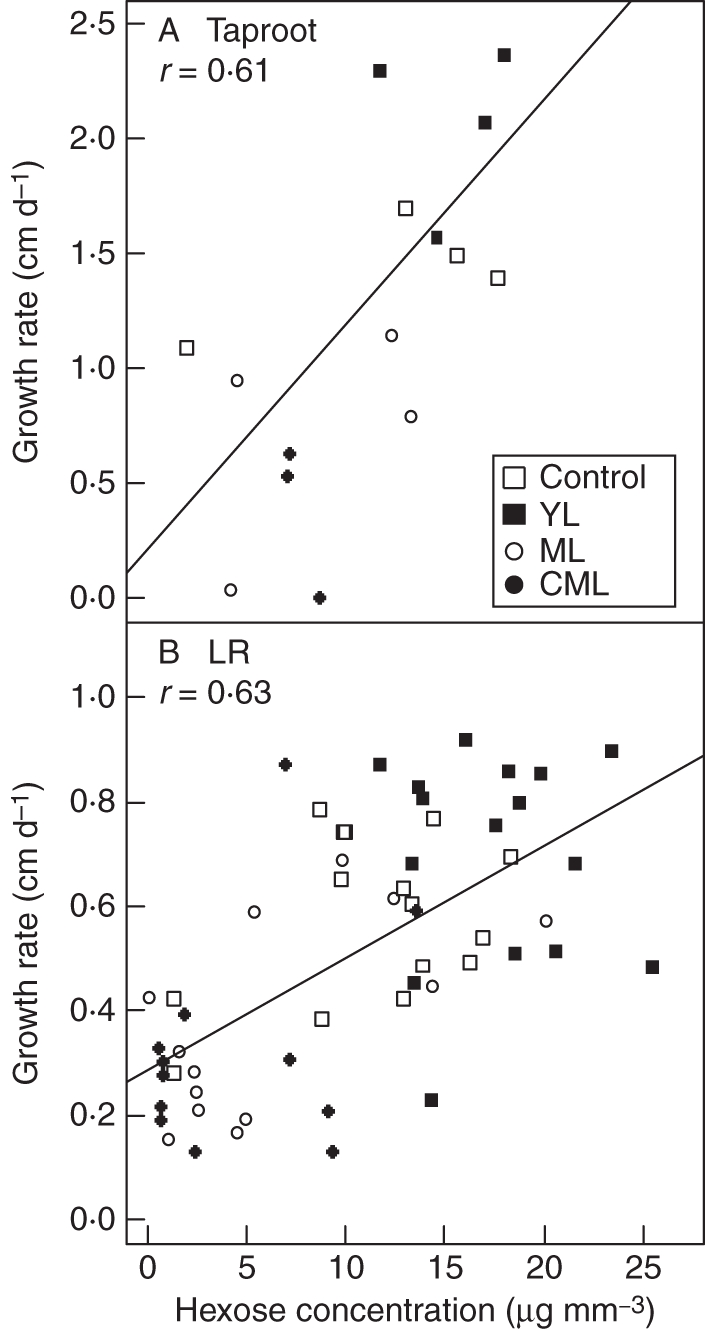
Relationship between hexose concentrations in the apex and estimated root growth rate of (A) taproots (n = 15) and (B) lateral roots (n = 60) collected 10 d after t0 for control, YL, ML and CML seedlings, as indicated.
Taproots exhibited a steeper regression slope than LR (respectively, 0·08 and 0·02). For a given soluble sugar concentration, taproots grew faster. One of the major differences between taproots and LR was their apical diameter, so influence of apical diameter was checked. Correlation between apical diameter and root growth rate was highly significant (r2 = 0·67, P < 2·2·10−16; Fig. 8) whereas hexose concentration and diameter were not correlated (r2 = 0·03, P = 0·14).
Fig. 8.
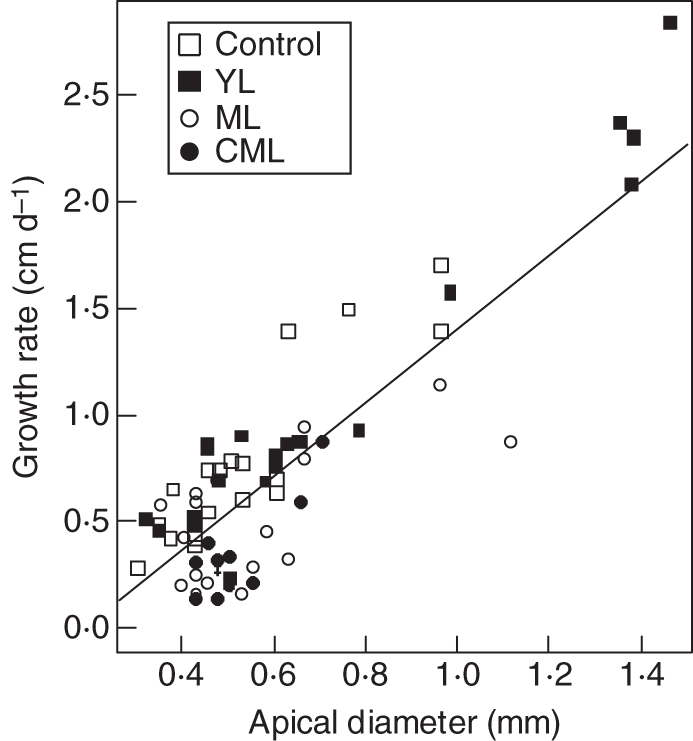
Relationship between apical diameter and estimated root growth rate of lateral roots and taproots (n = 75) collected 10 d after t0 for control, YL, ML and CML seedlings, as indicated.
Therefore, a unique explanatory model was fitted for all apices, accounting for the influence of hexose concentration (H), apical diameter (D) and their interaction (H.D) on root growth rate (G).
This model adequately explained the overall variability in growth rate (r2 = 0·92, P < 2·2·10−16; Fig. 9) and validated the different effects. The intercept value was excluded because it was not significant (P = 0·78).
Fig. 9.
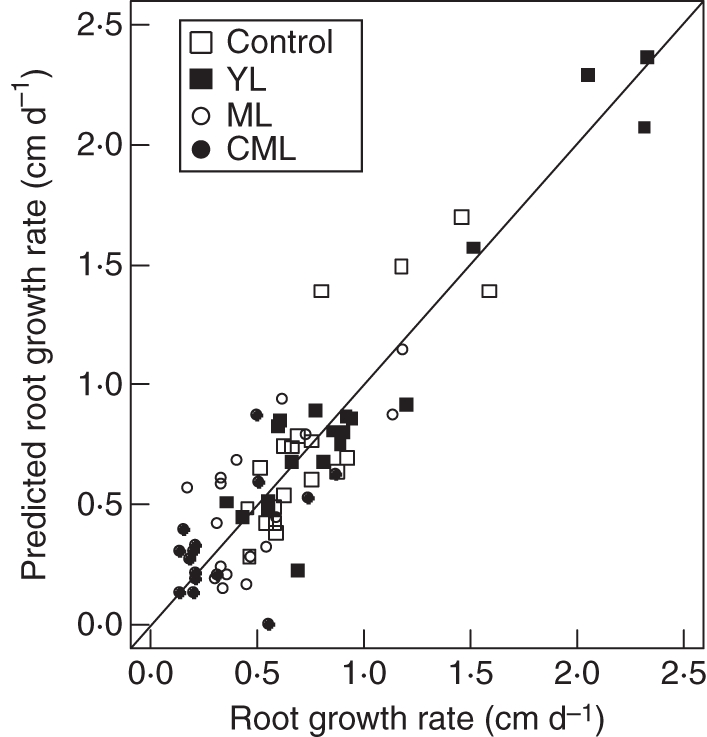
Relationship between values of root growth rate predicted by a model (accounting for the influence of hexose concentration and apical diameter and their interaction) and estimated values of root growth rate of lateral roots and taproots (n = 75) collected 10 d after t0 for control, YL, ML and CML seedlings, as indicated.
Introducing the treatment as a factor (δi) only slightly improved the global model (r2 = 0·94, P < 2·2·10−16) and factor effects were not significant (P > 0·1 whatever the treatment).
DISCUSSION
Variations in root growth in agreement with other experiments
Growth rate estimations in the present experiment were consistent, even in magnitude, with the conclusions of a similar experiment on Quercus pubescens at the same stage, but grown in root boxes (Willaume and Pagès, 2006). It substantiates the further comparison between current carbohydrate results and dynamic morphological results obtained in root observation boxes (Willaume and Pagès, 2006). Nevertheless, taproot growth rates before t0 were slightly but not significantly lower in observation boxes (1·5 cm d−1) than in pots (1·9 cm d−1). Growth conditions in observation boxes have already been reported to be more restrictive for root development than in pots (Neufeld et al., 1989) or in fields (Lecompte et al., 2001).
Relationships between growth rate and sugar concentrations in apical and subapical segments
Apical segments and subapical segments, as very active zones of growth and cellular division, had high soluble sugar concentration (up to 30 µg mm−3) comparable with concentrations in maize apices (Müller et al., 1998; Mollier, 1999), but higher than in wheat or arabidopsis apices (Bingham and Stevenson, 1993; Freixes et al., 2002).
Rhythmic growth alters carbohydrate distribution in the plant. During the development of the second flush, most photoassimilates exported from first-flush leaves are allocated upward to developing stems and leaves of the new flush (Dickson et al., 2000). This modification in carbohydrate allocation lowered sugar concentration even in very distal organs such as root apices (control seedlings). These decreases in sugar concentration in apices were approximately concomitant with the reductions in growth rate and apical diameter already observed (Willaume and Pagès, 2006).
Defoliation of the first flush (ML and CML seedlings) removed carbohydrate sources needed for the second-flush development (Dickson et al., 2000), lowering carbohydrate availability in the plant and amplifying variations in apical responses. By removing cotyledons in addition to mature leaves (CML) even fewer carbohydrates were available; the decrease in sugar concentration in the apices was greater and earlier than in ML seedlings. Nevertheless, growth was not yet significantly affected 1 d after defoliation (Willaume and Pagès, 2006), contrary to hexose concentration in apices. After reducing carbohydrate availability through shading, Müller et al. (1998) also observed on maize that decreases in local sugar concentration may precede the decrease in root elongation rate. They suggested that changes in carbon availability influence root elongation through a developmental process rather than an immediate stress effect. In the same way, when aerial growth ends (t0 + 10 d), soluble sugar concentration recovered higher and variable values, while root growth only started resuming (Willaume and Pagès, 2006). Recovery of sucrose was more complete. Differences between hexose and sucrose dynamics may be due to their different functions: since sucrose is mainly a transport form, it may be first to reach the root tips when availability recovers.
Unlike other treatments, YL seedlings showed a relatively steady state both in soluble sugar concentration and in taproot growth (Willaume and Pagès, 2006). Cutting the very young leaves (<5 mm long) removes sink organs and prevents radical shifts in photoassimilate allocation upward to the developing stem and leaves of the new flush (Dickson et al., 2000). Fewer organs compete for photoassimilate – only the remaining terminal aerial apex (Le Hir et al., 2006) and root apices. Supply from the first-flush leaves was then sufficient to maintain a high and constant carbohydrate concentration in roots.
Large mobilization of stored carbohydrates
The quantities of carbohydrates stored in oak seedlings are considerable for a few-weeks-old plant. Acorns at germination were heavy (on average 1·1 ± 0·2 g d. wt) compared with other large seeds (Kitajima, 2003). Cotyledons store large quantities of non-structural carbohydrates and particularly starch (Kabeya, 2003). It was also confirmed here that oak seedlings (like other large-seeded species) invest in a relatively large reserve in taproots, even at early growth stages during first-flush development (Kabeya, 2003; Kitajima, 2003). But both storage pools were not mobilized in the same way.
In cotyledons, starch and hexose slowly decreased between the three different stages. Cotyledons continue to supply carbohydrates to the young plant for the development of the second flush (Barnola et al., 1993), even if their export became minor after expansion of the first leaves (Kennedy et al, 2004; Myers and Kitajima, 2007).
Carbohydrates stored in basal segments were mobilized during second-flush development. In control seedlings, high sucrose concentrations on day 10 suggest an important flow of carbohydrates between aerial and root parts at the end of aerial growth. Mobilization of starch was partial and occurred relatively late (between days 5 and 10). The strong aerial sinks mainly used carbohydrates exported from leaves of the first flush and starch reserves from the first-flush stem (Alaoui-Sossé, 1994), whereas mobilization in the roots was moderate.
There was no supplementary depletion of starch from cotyledons in defoliated seedlings compared with control seedlings. Mobilization in basal roots was faster and more important after removal of mature leaves. In response to defoliation treatments, cotyledons had a limited role as a source of carbohydrate supply, whereas root storage was much more important and affected, despite smaller stored quantities. This has also been observed in Quercus crispula (Kabeya, 2003), Quercus robur (Andersson, 1996) and seven neotropical species (Myers and Kitajima, 2007). It highlights that non structural carbohydrates (starch and sugars) stored in cotyledons but more especially in roots are of critical importance for young seedlings stress tolerance and juvenile survival (Myers and Kitajima, 2007).
In spite of this important mobilization of root storage in ML and CML treatments, apical and subapical sugar concentration decreased; either the carbohydrates remobilized were allocated to aerial growing parts in priority, or the quantities were too small to supply all of the plant parts. In YL seedlings, carbohydrates produced by first-flush leaves were, on the contrary, totally available for root or supplementary storage (as noticed in basal roots).
Correlations between hexose concentration, apical diameter and growth rate
The concomitance in the dynamic patterns of root growth rate and apical sugar concentration support the hypothesis of the major influence of carbohydrates on these growth responses. Variations in sugar concentration are concordant with the hypothesis of competition between source and sink, in which priority in the allocation of resources is given to the developing aerial parts to the detriment of organs such as root apices. The role of carbohydrate availability in growth response may be directly nutritional but may also involve the signalling properties of sugars on root growth (Sheen et al., 1999; Koch et al., 2000; Freixes et al., 2002).
Furthermore, growth rate is very well described by a simple model matching apical diameter and local sugar concentration, i.e. a model including both the influence of sink size and its activity. Apical diameter indeed defines the size of the meristem and can be seen as an estimator of the number of cells able to divide; it thus indicates the potential maximum growth rate (Thaler and Pagès, 1999; Lecompte et al., 2001). Sugar concentrations act here as a supplementary limiting factor, thus defining the actual growth rate. Comparable relationships between local sugar concentration and root growth have been described for arabidopsis (Freixes et al., 2002) and wheat (Bingham and Stevenson, 1993) with other experimental ways of modifying carbohydrate availability (sugar-enriched media, shading, pruning to a single leaf). Sugar concentrations were instantaneous measures, whereas growth rates were estimations over the last few days. This difference could explain part of the remaining variability.
Contrasted defoliation treatments may induce antagonistic variations in other components (e.g. on hormones or water potential), that may also modify root growth. For instance, removal of young leaves or removal of cotyledons took out organs which produce auxin (Ljung et al., 2001; Bhalerao et al., 2002), a hormone acting on root growth control. But for these two treatments, morphological responses and modifications in sugar concentrations in apices are antagonistic. This statement corroborates that the role played by hormones is only secondary and that local sugar concentration is the most important driver of root growth control in response to periodic growth and defoliation treatments.
Conclusions
Correlation between the local hexose concentration in the growth zone and root elongation rate, and concomitance of variations in sugar concentration and variations in growth rate, support the hypothesis advanced in previous interpretations of a strong influence of carbohydrates in the morphological response of roots to rhythmic growth and aerial organ removals.
ACKNOWLEDGEMENTS
We thank Valérie Serra, Josiane Hostaléry and José Fabre for technical support, and Norbert Turion for providing acorns. This work was supported by the Conseil Régional Provence-Alpes-Côte d'Azur.
LITERATURE CITED
- Aguirrezabal LAN, Deleens E, Tardieu F. Root elongation rate is accounted for by intercepted PPFD and source-sink relations in field and laboratory-grown sunflower. Plant, Cell & Environment. 1994;17:443–450. [Google Scholar]
- Alaoui-Sossé B. Rhythmic growth and carbon allocation in Quercus robur. 1. Starch and sucrose. Plant Physiology and Biochemistry. 1994;32:331–339. [Google Scholar]
- Alatou D, Barnola P, Lavarenne S, Gendraud M. Rhythmic growth characteristics of pedunculate oak. Plant Physiology and Biochemistry. 1989;27:275–280. [Google Scholar]
- Andersson C. Growth of Quercus robur seedlings after experimental grazing and cotyledon removal. Acta Botanica Neerlandica. 1996;45:85–94. [Google Scholar]
- Barnola P, Alatou D, Parmentier C, Vallon C. Study of the determination of endogenous rhythmic growth of young pedunculate oak by modulating light intensity. Annales des Sciences Forestieres. 1993;50:257–272. [Google Scholar]
- Bhalerao RP, Eklof J, Ljung K, Marchant A, Bennett M, Sandberg G. Shoot-derived auxin is essential for early lateral root emergence in Arabidopsis seedlings. The Plant Journal. 2002;29:325–332. doi: 10.1046/j.0960-7412.2001.01217.x. [DOI] [PubMed] [Google Scholar]
- Bingham IJ, Farrar JF. Regulation of respiration in roots of barley. Physiologia Plantarum. 1988;73:278–285. [Google Scholar]
- Bingham IJ, Stevenson EA. Control of root growth: effects of carbohydrates on the extension, branching and rate of respiration of different fractions of wheat roots. Physiologia Plantarum. 1993;88:149–158. [Google Scholar]
- Bingham IJ, Panico A, Stevenson EA. Extension rate and respiratory activity in the growth zone of wheat roots: time-course for adjustments after defoliation. Physiologia Plantarum. 1996;98:201–209. [Google Scholar]
- Champagnat P, Payan E, Champagnat M, Barnola P, Lavarenne S, Bertholon C. La croissance rythmique de jeunes chênes pédonculés cultivés en conditions contrôlées et uniformes. Naturalia Monspielensia. 1986:303–337. H.S. [Google Scholar]
- Dickson RE, Tomlinson PT, Isebrands JG. Allocation of current photosynthate and changes in tissue dry weight within northern red oak seedlings: individual leaf and flush carbon contribution during episodic growth. Canadian Journal of Forest Research. 2000;30:1296–1307. [Google Scholar]
- Eissenstat DM, Duncan LW. Root growth and carbohydrate responses in bearing citrus trees following partial canopy removal. Tree Physiology. 1992;10:245–257. doi: 10.1093/treephys/10.3.245. [DOI] [PubMed] [Google Scholar]
- Farrar JF, Jones CL. Modification of respiration and carbohydrate status of barley roots by selective pruning. New Phytologist. 1986;102:513–521. [Google Scholar]
- Ferraro DO, Oesterheld M. Effect of defoliation on grass growth: a quantitative review. Oikos. 2002;98:125–133. [Google Scholar]
- Freixes S, Thibaud M, Tardieu F, Muller B. Root elongation and branching is related to local hexose concentration in Arabidopsis thaliana seedlings. Plant, Cell & Environment. 2002;25:1357–1366. [Google Scholar]
- Gomez L, Rubio E, Auge M. A new procedure for extraction and measurement of soluble sugars in ligneous plants. Journal of the Science of Food and Agriculture. 2002;82:360–369. [Google Scholar]
- Gomez L, Rubio E, Lescourret F. Critical study of a procedure for the assay of starch in ligneous plants. Journal of the Science of Food and Agriculture. 2003;83:1114–1123. [Google Scholar]
- Gomez L, Bancel D, Rubio E, Vercambre G. The microplate reader: an efficient tool for the separate enzymatic analysis of sugars in plant tissues: validation of a micro-method. Journal of the Science of Food and Agriculture. 2007;87:1893–1905. [Google Scholar]
- Goutouly JP, Habib R. Diurnal and spatial variations in NO3− uptake capacity in peach trees. Agronomie. 1996;16:337–345. [Google Scholar]
- Harradine AR, Whalley RDB. A comparison of the root growth, root morphology and root response to defoliation of Aristida ramosa R.Br. and Danthonia linkii Kunth. Australian Journal of Agricultural Research. 1981;32:565–574. [Google Scholar]
- Kabeya D. The role of roots and cotyledons as storage organs in early stages of establishment in Quercus crispula: a quantitative analysis of the nonstructural carbohydrate in cotyledons and roots. Annals of Botany. 2003;92:537–545. doi: 10.1093/aob/mcg165. [DOI] [PMC free article] [PubMed] [Google Scholar]
- Kennedy PG, Hausmann NJ, Wenk EH, Dawson TE. The importance of seed reserves for seedling performance: an integrated approach using morphological, physiological, and stable isotope techniques. Oecologia. 2004;141:547–554. doi: 10.1007/s00442-004-1686-0. [DOI] [PubMed] [Google Scholar]
- Kitajima K. Impact of cotyledon and leaf removal on seedling survival in three tree species with contrasting cotyledon functions. Biotropica. 2003;35:429–434. [Google Scholar]
- Koch EK, Ying Z, Wu Y, Avigne WT. Multiple paths of sugar-sensing and a sugar/oxygen overlap for genes of sucrose and ethanol metabolism. Journal of Experimental Botany. 2000;51:417–427. doi: 10.1093/jexbot/51.suppl_1.417. [DOI] [PubMed] [Google Scholar]
- Le Hir R, Leduc N, Jeannette E, Viemont JD, Pelleschi-Travier S. Variations in sucrose and ABA concentrations are concomitant with heteroblastic leaf shape changes in a rhythmically growing species (Quercus robur) Tree Physiology. 2006;26:229–238. doi: 10.1093/treephys/26.2.229. [DOI] [PubMed] [Google Scholar]
- Lecompte F, Ozier-Lafontaine H, Pagès L. The relationships between static and dynamic variables in the description of root growth: consequences for field interpretation of rooting variability. Plant & Soil. 2001;236:19–31. [Google Scholar]
- Ljung K, Bhalerao RP, Sandberg G. Sites and homeostatic control of auxin biosynthesis in Arabidopsis during vegetative growth. The Plant Journal. 2001;28:465–474. doi: 10.1046/j.1365-313x.2001.01173.x. [DOI] [PubMed] [Google Scholar]
- Mollier A. Croissance racinaire du maïs (Zea mays L.) sous déficience en phosphore. Etude expérimentale et modélisation. 1999 PhD Thesis, Université Paris XI-Orsay, Paris. [Google Scholar]
- Müller B, Stosser M, Tardieu F. Spatial distributions of tissue expansion and cell division rates are related to irradiance and to sugar content in the growing zone of maize roots. Plant, Cell & Environment. 1998;21:149–158. [Google Scholar]
- Myers JA, Kitajima K. Carbohydrate storage enhances seedling shade and stress tolerance in a neotropical forest. Journal of Ecology. 2007;95:383–395. [Google Scholar]
- Neufeld HS, Durall DM, Rich PM, Tingey DT. A rootbox for quantitative observations on intact entire root systems. Plant & Soil. 1989;117:295–298. [Google Scholar]
- Pagès L, Serra V. Growth and branching of the taproot of young oak trees – a dynamic study. Journal of Experimental Botany. 1994;45:1327–1334. [Google Scholar]
- Pagès L, Serra V, Draye X, Doussan C, Pierret A. Estimating root elongation rates from morphological measurements of the root tip. Plant & Soil. 2010;328:35–44. [Google Scholar]
- Sheen J, Zhou L, Jang J. Sugars as signaling molecules. Current Opinion in Plant Biology. 1999;2:410–418. doi: 10.1016/s1369-5266(99)00014-x. [DOI] [PubMed] [Google Scholar]
- Sonesson LK. Growth and survival after cotyledon removal in Quercus-robur seedlings, grown in different natural soil types. Oikos. 1994;69:65–70. [Google Scholar]
- Thaler P, Pagès L. Root apical diameter and root elongation rate of rubber seedlings (Hevea brasiliensis) show parallel responses to photoassimilate availability. Physiologia Plantarum. 1996a;97:365–371. [Google Scholar]
- Thaler P, Pagès L. Periodicity in the development of the root system of young rubber trees: relationship with shoot development. Plant, Cell & Environment. 1996b;19:56–64. [Google Scholar]
- Thaler P, Pagès L. Why are laterals less affected than main axes by homogeneous unfavourable physical conditions? A model-based hypothesis. Plant & Soil. 1999;217:151–157. [Google Scholar]
- Willaume M, Pagès L. How periodic growth pattern and source/sink relations affect root growth in oak tree seedlings ? Journal of Experimental Botany. 2006;57:815–826. doi: 10.1093/jxb/erj059. [DOI] [PubMed] [Google Scholar]


