

Abstract
Molecular imaging studies have recently found inter- and intratumoral heterogeneity in World Health Organization (WHO) grade II gliomas. A correlative analysis with tumor histology, however, is still lacking. For elucidation we conducted the current prospective study. Fifty-five adult patients with an MRI-based suspicion of a WHO grade II glioma were included. [F-18]Fluoroethyltyrosine (18FET) uptake kinetic studies were combined with frame-based stereotactic localization techniques and used as a guide for stepwise (1-mm steps) histopathological evaluation throughout the tumor space. In tumors with heterogeneous PET findings, the O6-methylguanine-DNA methyltransferase (MGMT) promoter methylation status and expression of mutated protein isocitrate dehydrogenase variant R132H (IDH1) were determined inside and outside of hot spot volumes. Metabolic imaging revealed 3 subgroups: the homogeneous WHO grade II glioma group (30 patients), the homogeneous malignant glioma group (10 patients), and the heterogeneous group exhibiting both low- and high-grade characteristics at different sites (15 patients). Stepwise evaluation of 373 biopsy samples indicated a strong correlation with analyses of uptake kinetics (p < 0.0001). A homogeneous pattern of uptake kinetics was linked to homogeneous histopathological findings, whereas a heterogeneous pattern was associated with histopathological heterogeneity; hot spots exhibiting malignant glioma characteristics covered 4–44% of the entire tumor volumes. Both MGMT and IDH1 status were identical at different tumor sites and not influenced by heterogeneity. Maps of 18FET uptake kinetics strongly correlated with histopathology in suspected grade II gliomas. Anaplastic foci can be accurately identified, and this finding has implications for prognostic evaluation and treatment planning.
Keywords: low-grade glioma, 18FET-PET, MGMT, IDH1, stereotactic biopsy, metabolic imaging
In conventional MRI, nonenhancing space-occupying lesions are often suspicious for a World Health Organization (WHO) grade II glioma. In reality, they constitute an extremely heterogeneous group of diseases, including also grade III and grade IV gliomas and nonneoplastic (i.e., inflammatory) processes.1–3 Accordingly, low sensitivity (in the range of 72–93%) and specificity values (in the range of 50–80%) have been reported for standard MRI protocols of suspected low-grade gliomas. Metabolic/molecular imaging studies might help to overcome some of these limitations. O-(2-[18F]fluoroethyl)-1-tyrosine (18FET) PET, for example, has already been systematically used for measurements of both intratumoral static and dynamic amino acid uptake in primary brain tumors4–7; particularly for the latter kinetic approach, favorable sensitivity (94%) and specificity (100%) values for noninvasive glioma grading have been achieved.7 The current study focuses not only on these overall measurements of diagnostic accuracy but also (and mainly) on the still unresolved question as to what extent heterogeneous or homogeneous intratumoral kinetic profiles can be translated into corresponding heterogeneous or homogeneous histopathological characteristics throughout the tumor space, and which histological and metabolic patterns are the predominant ones in patients with suspected low-grade gliomas. The elucidation of the distribution of kinetic and histopathological landscapes and their correlation with each other might help to define more clearly the potential role of dynamic 18FET-PET within the emerging field of molecular imaging. In the case of a strong correlation between metabolic imaging and histopathology, 18FET-PET maps might be used to target molecular-genetic analyses at tumor sites with different metabolic profiles.
The current prospective study provides a first step in this direction. In adult patients with an MRI-based suspicion of a supratentorial WHO grade II glioma, 18FET-PET images showing three-dimensional (3D) outlined areas of different kinetic profiles (if present) were colocalized with MRI data and used as a guide for stereotactic biopsy procedures throughout the tumor space, allowing stepwise histological evaluation in correlation with the PET data. Moreover, in patients with heterogeneously composed metabolic landscapes, the status of well-known prospective/predictive biomarkers (MGMT promoter methylation and expression of mutant protein isocitrate dehydrogenase [IDH1] variant R132H)8–13 was determined at multiple sites in spatial relation to the histological and metabolic maps.
Methods
Patients
Adult patients (ages 18 to 70 years) with an MRI-based suspicion of a so far untreated supratentorial WHO grade II glioma and with no prior history of radiotherapy or chemotherapy were eligible for this study. All enrolled patients gave informed consent. The study protocol was reviewed and approved by the institutional review board of the Ludwig-Maximilians University, Munich, Germany (AZ 216/14).
Magnetic Resonance Imaging
All patients received a standard MRI investigation (axial T2-weighted sequence with a slice thickness of 2 mm, and 3D T1-weighted sequences with a slice thickness of 1 mm) before and after administration of intravenous agent (0.1 mmol per kilogram of body weight of gadopentetate dimeglumine [Magnevist, Schering]) performed on 1.5 or 3.0 Tesla scanners (Magnetom Symphony, Siemens; or Signa HDxt, GE Healthcare) prior to enrollment. The scans were evaluated by 2 experienced neuroradiologists (J.L., J.L.) who were blinded to the results of the 18FET-PET investigation and the histopathological diagnosis obtained. MRI-based criteria for WHO grade II gliomas were (1) no contrast enhancement, (2) hyperintense signal on T2-weighted sequences, (3) hypointense signal on T1-weighted sequences, and (4) no evidence of hemorrhage or necrosis. For 3D tumor delineation and volume calculation, T2-weighted imaging sequences were used: tumor volume was calculated from summed two-dimensional (2D) tumor areas delineated as being on contiguous axial planes (2-mm slice thickness) covering entire tumor expansions, using a 3D calculation tool on a PACS Workstation (Magic VIEW 1000®, Sienet, Siemens).
18FET-PET Investigation
18FET-PET scans were performed within 1 week after MRI investigation with an ECAT EXACT HR+ scanner (Siemens/CTI). To allow us to obtain standardized metabolic conditions, patients fasted for a minimum of 6 h before scanning. Following a 15-min transmission scan for attenuation correction (68Ge sources), approximately 180 MBq of 18FET was injected intravenously. The emission recording consisted of 16 time frames covering the period up to 40 min post-injection according to our established protocol.7 Images were reconstructed as 128 × 128 matrices of 2 × 2-mm voxels by filtered back projection using a Hann filter with a cut-off frequency of 0.5 Nyquist and corrected for random, dead time, scatter, and attenuation. For further analysis, data were transferred to a Hermes workstation (Hermes Medical Solution).
To obtain accurate information about the individual time course of 18FET uptake within the whole tumor, we used a standardized protocol for axial PET images covering the area of the MRI-based suspected tumor.
Because dynamic evaluation of 18FET-PET in high-grade tumors was shown to have an early peak with decreasing values afterward, we used the summation of 18FET image covering the time interval between 5 and 15 min post-injection to assess the area with the highest activity. Therefore, a 90% isocontour threshold region of interest (ROI) was defined for each individual transversal slice within this area of suspicious 18FET uptake. In patients without elevated FET uptake in the early phase, ROI was defined covering the tumor area delineated in the MRI. This procedure resulted in a set of several individual ROIs for each patient and tumor. Afterward, these ROIs were applied to the corresponding slices at later time points, and the time activity curves (TACs) within the ROIs were evaluated for the entire dynamic data set (Fig. 1).7,14 Constantly increasing TACs were determined to be characteristic for low-grade glioma (“low-grade kinetics”), whereas TACs with an early peak followed by decreasing values were determined to be characteristic for high-grade glioma (“high-grade kinetics”).
Fig. 1.

Individual maps of 18FET-PET kinetic analysis for each tumor reveal 3 subgroups. Example of a group A tumor: constantly increasing SUV90 values throughout the tumor volume (indicative of WHO grade II gliomas). Example of a group B tumor: early peak followed by a constant decline of SUV90 values (indicative of homogeneous high-grade gliomas). Example of a group C tumor: areas with constantly increasing SUV90 values coexisting with hot spots exhibiting an early peak and a constant decline thereafter (indicative of heterogeneously composed high-grade gliomas). Tissue samples were stepwise collected from inside and outside of the hot spots.
In those patients for whom the TACs suggested high-grade kinetics, a 3D volume of interest (VOI) was defined on the early summed images, which served as a hot spot for the further stereotactic procedures. Areas without high-grade characteristics but T2 hyperintensities in MRI were suggested to be low-grade parts of the tumor.
Finally 3D-VOI (if determined)/18FET-PET data were transferred to a stereotactic workstation, which was used for coregistration with anatomical MRI as well as for trajectory planning.
18FET-PET–Guided Stereotactic Biopsy Procedures
All patients underwent stereotactic biopsy within 10 days of study enrollment. The technique of multimodal imaging–guided stereotactic serial biopsies has been described previously in detail.15,16 Coregistration of CT, MRI (including T1- and T2-weighted sequences), and 18FET-PET investigation served for 3D visualization (i-plan stereotaxy, BrainLAB) of the tumor and simulation of the “best” trajectory including metabolic active areas. A serial biopsy was taken along a trajectory representative of the solid tumor tissue inside and outside of hot spots, if present. The topographical assignment of collected tumor probes with regard to the hot spot was performed after consideration of the spatial resolution of the PET scanner (4–5 mm). Only tumor probes clearly inside or outside of hot spots were used for histopathological and molecular-genetic evaluation. Using microforceps, the maximum amount of tissue per biopsy specimen was 1 mm3. Each biopsy specimen was scored with regard to its position within the stereotactically defined tumor space. Each of the collected tissue samples was assigned to the corresponding imaging data (Fig. 2). The number of specimens taken in 1-mm steps along the chosen trajectory was in the range of 4 to 16 (median 7) per tumor. The tissue sampling procedure was performed using intraoperative smear preparations, as routinely done by the attending neuropathologist (R.E.) to ensure diagnostically suitable specimens. A corresponding sample (level +1 mm) was taken either for paraffin embedding and histopathological examination or for snap-freezing for subsequent molecular-genetic analyses.
Fig. 2.

Histological and molecular-genetic analysis of a heterogeneously composed WHO grade III glioma. 1a, merged transversal T2-weighted MR and concordant 18FET-PET images exhibiting heterogeneous tumor composition. 1b, dynamic 18FET uptake kinetics inside (A) and outside (B) the hot spot. Histopathological tumor grading revealed a WHO grade III phenotype inside (2a) and grade II characteristics outside (2b) the hot spot. Mutant protein IDH1 variant R132H expression was found in both inside (3a) and outside (3b) the hot spot. Methylation-specific PCR also revealed an identical MGMT methylation status irrespective of intratumoral origin (4a, inside and 4b, outside the hot spot; 4c, no template control (NTC)).
Histopathology
Stepwise histopathological evaluation of each single tumor specimen was independently made by 3 neuropathologists (R.E., J.H., H.A.K.), who were blinded to the MRI and 18FET-PET findings. This evaluation included determination of cell density, nuclear pleomorphism, mitotic activity, microvascular proliferation, and the Ki-67 labeling index. Classification and grading of each tissue sample was performed according to the criteria of the WHO classification of brain tumors.17 Definitive histopathological diagnosis of each tumor was guided by the respective specimens exhibiting the most malignant phenotype. In case of discordant findings, a conference for reevaluation was initiated to achieve a consensus concerning the diagnosis.
Determination of MGMT Promoter Methylation and Mutant Protein IDH1 Variant R132H Expression
All patients with heterogeneous intratumoral 18FET uptake kinetics and corresponding heterogeneous histopathology were chosen for additional molecular-genetic analyses, to elucidate whether histological heterogeneity corresponds to intratumoral heterogeneous findings with regard to the MGMT promoter methylation status and/or IDH1 expression. Only solid viable tumor tissue was used for MGMT and IDH1 analyses. The described biopsy technique was applied to minimize the risk of tissue contamination (e.g., by nonneoplastic tissue). At least 2 tissue samples were collected from different sites throughout each tumor (including the hot spot). Tumor specimens were stored at –20°C immediately after the biopsy procedure and subsequently used for MGMT analysis. Small sample size–adjusted determination of MGMT promoter methylation was performed using both methylation-specific PCR (MSP) and sequencing analysis as described previously.10,16 Briefly, DNA from tumor specimens was isolated using commercially available isolation kits followed by purification and bisulfite modification of DNA.8 For MSP, two pairs of primers (each specific for either the methylated or the unmethylated MGMT promoter region) were used as originally described by Esteller and colleagues.18 MSP was performed according to standard protocols followed by gel electrophoresis and amplicon visualization. Evaluation of the MGMT promoter methylation status was performed in a blinded fashion (S.E.) according to previously published definitions.16 Expression of mutant protein IDH1 variant R132H was determined by the mIDH1R132H antibody (clone H14) using unstained slides from formalin-fixed, paraffin-embedded tissue.19 Slides of 4 µm were dried at 80°C for 1 h and stained with mIDH1R132H (clone H14) on a Ventana BenchMark XT immunostainer (Ventana Medical Systems). The Ventana staining procedure included pretreatment with Cell Conditioner 2 (pH 6) for 60 min, followed by incubation with undiluted mIDH1R132H hybridoma supernatant at 37°C for 32 min. Antibody incubation was followed by Ventana standard signal amplification, ultraWash, and counterstaining with 1 drop of hematoxylin for 4 min and 1 drop of bluing reagent for 4 min. For chromogenic detection, we used the ultraView Universal DAB Detection Kit (Ventana Medical Systems). The immunoreaction was scored as positive when tumor cells showed strong cytoplasmic staining for mIDH1R132H. IDH analysis was performed by two neuropathologists (C.H., A.v.D.) blinded to both PET data and histopathology.
Statistical Analysis
The distribution of patient- and tumor-related variables between subgroups was analyzed by chi-squared statistics (for dichotomized variables) and the Wilcoxon test (for continuously scaled variables); p ≤ 0.05 was considered significant. All calculations were performed using the SAS software package (version 9.1).
Results
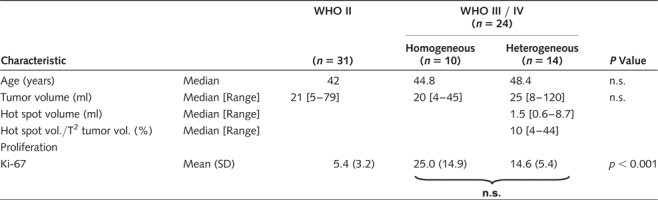
A total of 55 consecutive patients (33 men, 22 women; mean age 43.9 years) were enrolled between September 2006 and July 2009. Patient characteristics are shown in Table 1. MRI-based tumor volume calculations (mean overall tumor volume 31.5 ml), 18FET-PET investigations, and molecular stereotactic biopsy procedures were feasible in all patients. Overall, 373 tumor samples were collected (median number of specimens per tumor: 7), with a perioperative transient morbidity of 1.8% (one patient with transient hemiparesis) and no permanent morbidity.
Table 1.
Characteristics of patients with WHO grade II and WHO grade III/IV gliomas
 |
Overall Tumor Classification
WHO grade II, grade III, and grade IV gliomas were seen in 31 patients (astrocytomas 24, oligodendroglial tumors 7), 22 patients (astrocytomas 13, oligodendroglial tumors 9), and 2 patients (glioblastoma 2), respectively. The overall percentage of malignant gliomas was 44% (24/55). The maximum Ki-67 labeling index per tumor (Ki-67max) was significantly higher in malignant gliomas grade III/IV (Ki-67max 18.9% [±11.4] versus 5.4% [±3.2]; p < 0.0001) but did not differ in astroglial versus oligodendroglial tumors. The positive predictive value of conventional MRI was 56%.
Overall, 18FET-PET kinetic analysis indicated a low-grade glioma in 30 patients and a malignant glioma in 25 patients. The low-grade suspicion was histopathologically confirmed in 29 patients (1/30 patient with an anaplastic astrocytoma) and the high-grade suspicion in 23 patients (2/25 patients with low-grade gliomas). Sensitivity, specificity, and positive predictive value of 18FET-PET were 96%, 94%, and 92%, respectively.
Treatment of verified WHO grade II gliomas (31 patients) consisted of open tumor resection alone or in combination with stereotactic iodine-125 brachytherapy (14 patients), chemotherapy (11 patients), or conservative management (6 patients); all WHO grade III gliomas (22 patients) were treated with chemotherapy (temozolomide)20; in 11/22 patients, however, chemotherapy was preceded by open tumor resection (because of significant space-occupying effects of the tumor). WHO grade IV gliomas (2 patients) were treated according to the protocol of the European Organization for Research on Treatment of Cancer.21
18FET Hot Spots Determine Malignant Tumor Parts
Metabolic analysis revealed 3 subgroups (Fig. 1). In 30 patients (54.5%) (group A), constantly increasing standardized uptake value within a 90% isocontour threshold (SUV90) was observed throughout the entire tumor volume (indicative of a grade II glioma),7 which was histopathologically verified in 29 patients. The mean number of collected tissue samples per tumor was 6.6 [±1.7]. Stepwise histopathological evaluation of all 197 biopsy samples revealed WHO grade II characteristics in 195 samples (98.9%). Two specimens, however, were classified as WHO grade III glioma. The mean Ki-67 labeling index from all 197 tumor probes was 3.2% [±3.1] (Table 2). Sensitivity, specificity, and positive predictive values of 18FET-PET to determine a tumor with homogeneous low-grade characteristics were 95%, 96%, and 99%, respectively.
Table 2.
Correlation of sample-wise (n = 373) histopathology including Ki-67 proliferation index with metabolic maps of homogeneous and heterogeneous kinetics
| WHO II | WHO III/IV | p-Value | Ki-67 | p-Value | ||
|---|---|---|---|---|---|---|
|
Metabolic homogeneous kinetics “Groups A + B” |
Group A (197 specimens) LG-kinetic |
195 | 2 | 0.001 | 3.2 | <0.001 |
|
Group B (58 specimens) HG-kinetic |
10 | 48 | 22.7 | |||
|
Metabolic heterogeneous kinetics “Group C” |
Outside hot spot (51 specimens) |
46 | 5 | <0.001 | 3.6 | 0.005 |
|
Inside hot spot (67 specimens) |
10 | 57 | 8.1 |
In 10 patients (18.2%) (group B), SUV90 values throughout the entire tumor volume peaked early followed by a constant decline (indicative of a malignant glioma),7 which was histopathologically verified in 9 patients, including 2 patients with glioblastoma multiforme. The mean number of collected tissue samples per tumor was 5.8 [±1.4]. Stepwise histopathological evaluation of all 58 biopsy samples revealed WHO grade III/IV characteristics in 48 samples (82.8%) and WHO grade II characteristics in 10 specimens (17.2%). The mean Ki-67 labeling index from all 58 tumor probes was 22.7% [±15.1] (Table 2). Patients of groups A and B did not differ in terms of age and tumor volume (Table 1). Sensitivity, specificity, and positive predictive values of 18FET-PET to determine a tumor with homogeneous high-grade characteristics were 96%, 95%, and 83%, respectively.
In 15 patients (27.3%) (group C), a heterogeneous imaging pattern was found. Areas with constantly increasing SUV90 values coexisted with those exhibiting an early peak and a constant decline thereafter; these hot spots covered 4–44% (median 10%) of the calculated tumor volume (median 25 ml [8–120]) (Table 1). Overall, these tumors were classified as WHO grade III gliomas in 14 patients (93%) and as WHO grade II glioma in 1 patient. The mean numbers of tissue samples per tumor collected from inside and outside of the hot spot were 4.5 [±2.3] and 3.4 [±2.1], respectively. Stepwise histopathological evaluation of samples clearly harvested from inside (N = 67) and outside of hot spots (N = 51) revealed WHO grade III characteristics in 57/67 samples (85.1%) and WHO grade II characteristics in 46/51 samples (90.2%). Discordant findings with WHO grade II characteristics (inside of hot spots) and WHO grade III characteristics (outside of hot spots) were seen in 10 and 5 samples, respectively. The mean of the Ki-67 labeling index was significantly higher in hot spots (8.1 [±6.7] compared with 3.6 [±5.1]; p = 0.005) (Table 2). Patients in group C were older and had larger tumor volumes than those in groups A and B, although the difference was not statistically significant (Table 1). Sensitivity, specificity, and positive predictive values of dynamic 18FET-PET analysis in determination of an intratumoral anaplastic focus were 92%, 82%, and 85%, respectively. The frequency of concordant and discordant findings was comparable in all 3 subgroups (p > 0.05).
Taken together, homogeneous uptake kinetics (for groups A and B) were significantly linked to similar histopathological findings throughout the tumor volume under investigation, whereas a heterogeneous pattern of uptake kinetics (group C) was topographically precisely associated with histopathological heterogeneity. This correlation was statistically significant (p < 0.001).
MGMT Promoter Methylation and Expression of Mutant Protein IDH1 Variant R132H in Heterogeneously Composed Gliomas
Molecular-genetic analysis and immunohistochemistry were performed using at least 2 biopsy samples clearly harvested from inside and outside the hot spot of heterogeneously composed anaplastic gliomas (N = 14). MGMT promoter methylation and mutant protein IDH1 variant R132H expression were seen in 11 and 9 tumors, respectively. An IDH1 mutation was frequently found in MGMT methylated tumors (8/11 patients), while IDH1 mutated tumors were often MGMT methylated (8/9 patients). A homogeneous distribution of these 2 biomarkers was detected inside and outside the hot spot of all 14 tumors; in particular, a qualitative and quantitative homogeneous expression of the mutant protein IDH1 was noted (Fig. 2).
Discussion
The majority of suspected diffuse low-grade gliomas present rather uniformly as homogeneous nonenhancing lesions on T2-weighted or fluid-attenuated inversion recovery MRI sequences, whereas inter- and intratumoral heterogeneity have been uncovered in recently published molecular/metabolic imaging studies.22,23 However, a systematic and accurate correlative analysis of these imaging data with tumor histology and molecular-genetic profiles has not been performed to date. The exact meaning of the term “inter- and intratumoral heterogeneity” regarding tumor grading, molecular-genetics, and prognostic evaluation in patients with suspected low-grade gliomas still needs clarification. The current report addresses some aspects of this unresolved topic.
18FET uptake kinetic studies adapted from the method of weighted frame differences as described by Pöpperl et al.7 were combined with frame-based stereotactic localization techniques. The dynamic approach was preferred, as the analysis of 18FET uptake kinetics has been shown to be superior to static 18FET uptake measurements for noninvasive tumor grading.6,7,14 The 18FET-PET images showing 3D outlined areas of different kinetic profiles (if existing) were colocalized with MRI data and used as a guide for stereotactic biopsy to perform correlative analyses of dynamic imaging data, histopathology, and molecular-genetic findings in adult patients with suspected supratentorial WHO grade II gliomas.
The distinct uptake kinetic profiles detected in the nonenhancing tumors of this series indicate no or only limited influence of the blood–tumor barrier. Other mechanisms such as increased amino acid transporter expression in tumor vessels and/or higher regional microvessel density were judged to be much more important for the determination of the tracer uptake kinetics than effects of increased permeability with passive diffusion of the tracer.7,14,24
MRI-Suspected Low-Grade Gliomas Exhibit Three Distinct Patterns of Corresponding 18FET Metabolism and Histopathology
Here we showed that suspected WHO grade II gliomas (according to conventional MRI criteria) frequently exhibited a more malignant phenotype, with nearly 50% of the investigated tumors proving to be grade III or even grade IV gliomas in this study. It is noteworthy that this was shown by the stereotactic biopsy technique, which is often considered a suboptimal technique for accurate glioma characterization and notoriously prone to undergrading (and subsequent undertreatment) if it is based on conventional imaging such as CT and/or MRI.25 Here we showed that stereotactic biopsy procedures guided by dynamic metabolic data and high-resolution MRI allow a precise topographical correlation analysis of metabolic and morphological landscapes. The low complication rate was in accordance with previously published data.26 Stepwise histopathological classification of 373 tissue specimens (collected from 55 tumors) was strongly correlated to the corresponding uptake kinetics throughout the tumor space. The prospectively estimated diagnostic sensitivity, specificity, and positive predictive values of dynamic FET-PET were always higher than 80% for both overall diagnostic classification and the stepwise classification of single specimens throughout the tumor space. Accordingly it can be expected that both biopsy- and microsurgery-related planning can be greatly improved by the implementation of molecular/metabolic imaging data.
The correlative analysis revealed 3 distinct groups among those with nonenhancing intrinsic tumors: homogeneous low-grade gliomas, homogeneous malignant gliomas, and tumors exhibiting both low- and high-grade characteristics. The patients with the heterogeneously composed tumors were older and had larger tumor volumes than those with homogeneous low-grade or high-grade gliomas; the hot spot was interindividually highly different and covered 4–44% of the entire tumor volume. Even though the Ki-67 labeling index was significantly higher in areas associated with WHO grade III characteristics, it was not as high as in tumors with homogeneous high-grade characteristics. Given the fact that both increased patient age and a larger tumor volume are considered risk factors for malignant transformation,27–31 one may speculate that the heterogeneously composed group of tumors consisted mainly of secondary malignant gliomas and might therefore differ biologically from those tumors in this study with homogeneous high-grade characteristics, which were found in younger patients, had smaller tumor volumes, and had a higher proliferation index. The high frequency of MGMT promoter methylation and IDH1 mutation detected in these heterogeneously composed tumors would be in line with this speculation.16,32 More data are necessary to support this hypothesis.
It is noteworthy that a new finding is that a tumor with homogeneous malignant (benign) uptake kinetics indeed lacks low-grade (high-grade) parts throughout the tumor space in the vast majority of tissue samples analyzed. The described concordance between uptake kinetics and corresponding stepwise histological evaluation in homogeneously and heterogeneously composed tumors supports the view of 18FET-PET as a powerful technique within the emerging field of molecular imaging and provides an important basis for additional molecular-genetic analyses at tumor sites exhibiting different uptake kinetic profiles. In the current series, we determined both the intratumoral distribution of MGMT promoter methylation and the expression of mutation protein IDH1 variant R132 inside and outside of hot spots of all 14 heterogeneously composed tumors. A homogeneous distribution of these biomarkers was seen throughout each of these tumors, suggesting that both MGMT promoter methylation and accumulation of mutant protein IDH1 variant R132H are probably early events in glioma genesis.
Risk of Undergrading and Undertreatment
Diagnosis and treatment are particularly challenged in both the homogeneously and the heterogeneously composed malignant glioma groups (18.2% and 25%, respectively, of the tumors of this series). In the former group, the necessity of obtaining a tissue diagnosis is underscored. Anaplastic foci of the latter group were as small as 0.6 ml and as large as 8.7 ml and covered 4% to 44% of the entire visible tumor volume. Overlooking these foci might easily lead to undergrading and undertreatment of a considerable number of patients. An anaplastic focus could either be easily missed by conventional biopsy procedures or be removed by suction or ultrasound aspirator during open tumor resection, resulting in a histopathological evaluation of tissue specimens that is no longer representative for the tumor under investigation. The exclusion or the proof of an intratumoral hot spot, its precise intraoperative identification, and sufficient sampling of tissue specimens from this most important tumor part must be considered essential for both stereotactic biopsy and microsurgery in suspected low-grade gliomas. Thus, the necessity for implementation of molecular/metabolic imaging data in biopsy and navigation planning systems is urgent. It is not currently clear to what extent these heterogeneously composed (and probably in former times undergraded) tumors have contributed to the unfavorable outcome measurements in historical studies of low-grade tumors.27,28,33 Moreover, significant interactions with classical clinical prognostic parameters such as age, tumor size, and extent of resection cannot be excluded, and any of these might have led to an overestimation or underestimation of their prognostic effects in these historical studies. In summary, optimal tumor characterization by molecular/metabolic imaging, representative histopathology, and hopefully more extensive molecular-genetic analysis in the future seems necessary for the development of sufficient and personalized treatment concepts.
Although the integration of 18FET-PET in treatment planning and treatment performance has gained increasing relevance, we are aware that limitations exist, particularly due to limited availabilities of PET-performing facilities. One of the strengths of 18FET, however, is the long half-life (110 min), enabling its use in PET centers without an adjacent cyclotron.24 It can be expected that 18FET-PET also will be increasingly used in the United States. Further comparative studies will help to define the place of PET and potentially alternative tools such as MRI-based echoplanar diffusion, perfusion analysis, and proton spectroscopy.2,34–38
Conflict of interest. There is no conflict of interest to be disclosed.
Funding
The study was funded in part by the German Glioma Network, supported by German Cancer Aid (Deutsche Krebshilfe 70-3163-Wi 3).
References
- 1.Barker FG, Chang SM, Huhn SL, et al. Age and the risk of anaplasia in magnetic resonance-nonenhancing supratentorial cerebral tumors. Cancer. 1997;80:936–941. [PubMed] [Google Scholar]
- 2.Law M, Yang S, Wang H, et al. Glioma grading: sensitivity, specificity, and predictive values of perfusion MR imaging and proton MR spectroscopic imaging compared with conventional MR imaging. AJNR Am J Neuroradiol. 2003;24:1989–1998. [PMC free article] [PubMed] [Google Scholar]
- 3.Scott JN, Brasher PM, Sevick RJ, Rewcastle NB, Forsyth PA. How often are nonenhancing supratentorial gliomas malignant? A population study. Neurology. 2002;59:947–949. doi: 10.1212/wnl.59.6.947. [DOI] [PubMed] [Google Scholar]
- 4.Pauleit D, Floeth F, Hamacher K, et al. O-(2-[18F]fluoroethyl)-L-tyrosine PET combined with MRI improves the diagnostic assessment of cerebral gliomas. Brain. 2005;128:678–687. doi: 10.1093/brain/awh399. [DOI] [PubMed] [Google Scholar]
- 5.Floeth FW, Pauleit D, Sabel M, et al. Prognostic value of O-(2-18F-fluoroethyl)-L-tyrosine PET and MRI in low-grade glioma. J Nucl Med. 2007;48:519–527. doi: 10.2967/jnumed.106.037895. [DOI] [PubMed] [Google Scholar]
- 6.Weckesser M, Langen KJ, Rickert CH, et al. O-(2-[18F]fluorethyl)-l-tyrosine PET in the clinical evaluation of primary brain tumours. Eur J Nucl Med Mol Imaging. 2005;32:422–429. doi: 10.1007/s00259-004-1705-8. [DOI] [PubMed] [Google Scholar]
- 7.Pöpperl G, Kreth FW, Mehrkens JH, et al. FET PET for the evaluation of untreated gliomas: correlation of FET uptake and uptake kinetics with tumour grading. Eur J Nucl Med Mol Imaging. 2007;34:1933–1942. doi: 10.1007/s00259-007-0534-y. [DOI] [PubMed] [Google Scholar]
- 8.Mollemann M, Wolter M, Felsberg J, Collins VP, Reifenberger G. Frequent promoter hypermethylation and low expression of the MGMT gene in oligodendroglial tumors. Int J Cancer. 2005;113:379–385. doi: 10.1002/ijc.20575. [DOI] [PubMed] [Google Scholar]
- 9.Hegi ME, Diserens AC, Gorlia T, et al. MGMT gene silencing and benefit from temozolomide in glioblastoma. N Engl J Med. 2005;352:997–1003. doi: 10.1056/NEJMoa043331. [DOI] [PubMed] [Google Scholar]
- 10.Thon N, Eigenbrod S, Grasbon-Frodl EM, et al. Predominant influence of MGMT methylation in non-resectable GBM after radiotherapy plus temozolomide. J Neurol Neurosurg Psychiatry. doi: 10.1136/jnnp.2010.214593. in press 2010. (Sept 2010, Epub ahead of print) [DOI] [PubMed] [Google Scholar]
- 11.Balss J, Meyer J, Mueller W, Korshunov A, Hartmann C, von DA. Analysis of the IDH1 codon 132 mutation in brain tumors. Acta Neuropathol. 2008;116:597–602. doi: 10.1007/s00401-008-0455-2. [DOI] [PubMed] [Google Scholar]
- 12.Sanson M, Marie Y, Paris S, et al. Isocitrate dehydrogenase 1 codon 132 mutation is an important prognostic biomarker in gliomas. J Clin Oncol. 2009;27:4150–4154. doi: 10.1200/JCO.2009.21.9832. [DOI] [PubMed] [Google Scholar]
- 13.Yan H, Parsons DW, Jin G, et al. IDH1 and IDH2 mutations in gliomas. N Engl J Med. 2009;360:765–773. doi: 10.1056/NEJMoa0808710. [DOI] [PMC free article] [PubMed] [Google Scholar]
- 14.Pöpperl G, Kreth FW, Herms J, et al. Analysis of 18F-FET PET for grading of recurrent gliomas: is evaluation of uptake kinetics superior to standard methods? J Nucl Med. 2006;47:393–403. [PubMed] [Google Scholar]
- 15.Thon N, Eigenbrod S, Grasbon-Frodl EM, et al. Novel molecular stereotactic biopsy procedures reveal intratumoral homogeneity of loss of heterozygosity of 1p/19q and TP53 mutations in World Health Organization grade II gliomas. J Neuropathol Exp Neurol. 2009;68:1219–1228. doi: 10.1097/NEN.0b013e3181bee1f1. [DOI] [PubMed] [Google Scholar]
- 16.Grasbon-Frodl EM, Kreth FW, Ruiter M, et al. Intratumoral homogeneity of MGMT promoter hypermethylation as demonstrated in serial stereotactic specimens from anaplastic astrocytomas and glioblastomas. Int J Cancer. 2007;121:2458–2464. doi: 10.1002/ijc.23020. [DOI] [PubMed] [Google Scholar]
- 17.Louis DN, Ohgaki H, Wiestler OD, et al. The 2007 WHO classification of tumours of the central nervous system. Acta Neuropathol. 2007;114:97–109. doi: 10.1007/s00401-007-0243-4. [DOI] [PMC free article] [PubMed] [Google Scholar]
- 18.Esteller M, Garcia-Foncillas J, Andion E, et al. Inactivation of the DNA-repair gene MGMT and the clinical response of gliomas to alkylating agents. N Engl J Med. 2000;343:1350–1354. doi: 10.1056/NEJM200011093431901. [DOI] [PubMed] [Google Scholar]
- 19.Capper D, Weissert S, Balss J, et al. Characterization of R132H mutation-specific IDH1 antibody binding in brain tumors. Brain Pathol. 2010;20:245–254. doi: 10.1111/j.1750-3639.2009.00352.x. [DOI] [PMC free article] [PubMed] [Google Scholar]
- 20.Wick W, Hartmann C, Engel C, et al. NOA-04 randomized phase III trial of sequential radiochemotherapy of anaplastic glioma with procarbazine, lomustine, and vincristine or temozolomide. J Clin Oncol. 2009;27:5874–5880. doi: 10.1200/JCO.2009.23.6497. [DOI] [PubMed] [Google Scholar]
- 21.Stupp R, Mason WP, van den Bent MJ, et al. Radiotherapy plus concomitant and adjuvant temozolomide for glioblastoma. N Engl J Med. 2005;352:987–996. doi: 10.1056/NEJMoa043330. [DOI] [PubMed] [Google Scholar]
- 22.Wyss MT, Hofer S, Hefti M, et al. Spatial heterogeneity of low-grade gliomas at the capillary level: a PET study on tumor blood flow and amino acid uptake. J Nucl Med. 2007;48:1047–1052. doi: 10.2967/jnumed.106.038489. [DOI] [PubMed] [Google Scholar]
- 23.Okita Y, Kinoshita M, Goto T, et al. 11C-methionine uptake correlates with tumor cell density rather than with microvessel density in glioma: a stereotactic image-histology comparison. Neuroimage. 2010;49:2977–2982. doi: 10.1016/j.neuroimage.2009.11.024. [DOI] [PubMed] [Google Scholar]
- 24.Heiss P, Mayer S, Herz M, Wester HJ, Schwaiger M, Senekowitsch-Schmidtke R. Investigation of transport mechanism and uptake kinetics of O-(2-[18F]fluoroethyl)-l-tyrosine in vitro and in vivo. J Nucl Med. 1999;40:1367–1373. [PubMed] [Google Scholar]
- 25.Jackson RJ, Fuller GN, Abi-Said D, et al. Limitations of stereotactic biopsy in the initial management of gliomas. Neuro-oncology. 2001;3:193–200. doi: 10.1093/neuonc/3.3.193. [DOI] [PMC free article] [PubMed] [Google Scholar]
- 26.Kreth FW, Muacevic A, Medele RJ, Bise K, Meyer T, Reulen HJ. The risk of haemorrhage after image guided stereotactic biopsy of intra-axial brain tumours—a prospective study. Acta Neurochir. 2001;143:539–546. doi: 10.1007/s007010170058. [DOI] [PubMed] [Google Scholar]
- 27.Kreth FW, Faist M, Grau S, Ostertag CB. Interstitial 125I radiosurgery of supratentorial de novo WHO Grade 2 astrocytoma and oligoastrocytoma in adults: long-term results and prognostic factors. Cancer. 2006;106:1372–1381. doi: 10.1002/cncr.21750. [DOI] [PubMed] [Google Scholar]
- 28.Bauman G, Lote K, Larson D, et al. Pretreatment factors predict overall survival for patients with low-grade glioma: a recursive partitioning analysis. Int J Radiat Oncol Biol Phys. 1999;45:923–929. doi: 10.1016/s0360-3016(99)00284-9. [DOI] [PubMed] [Google Scholar]
- 29.Berger MS, Deliganis AV, Dobbins J, Keles GE. The effect of extent of resection on recurrence in patients with low grade cerebral hemisphere gliomas. Cancer. 1994;74:1784–1791. doi: 10.1002/1097-0142(19940915)74:6<1784::aid-cncr2820740622>3.0.co;2-d. [DOI] [PubMed] [Google Scholar]
- 30.Shafqat S, Hedley-Whyte ET, Henson JW. Age-dependent rate of anaplastic transformation in low-grade astrocytoma. Neurology. 1999;52:867–869. doi: 10.1212/wnl.52.4.867. [DOI] [PubMed] [Google Scholar]
- 31.Wessels PH, Weber WE, Raven G, Ramaekers FC, Hopman AH, Twijnstra A. Supratentorial grade II astrocytoma: biological features and clinical course. Lancet Neurol. 2003;2:395–403. doi: 10.1016/s1474-4422(03)00434-4. [DOI] [PubMed] [Google Scholar]
- 32.Weller M, Stupp R, Reifenberger G, et al. MGMT promoter methylation in malignant gliomas: ready for personalized medicine? Nat Rev Neurol. 2010;6:39–51. doi: 10.1038/nrneurol.2009.197. [DOI] [PubMed] [Google Scholar]
- 33.Pignatti F, van den Bent M, Curran D, et al. Prognostic factors for survival in adult patients with cerebral low-grade glioma. J Clin Oncol. 2002;20:2076–2084. doi: 10.1200/JCO.2002.08.121. [DOI] [PubMed] [Google Scholar]
- 34.Fan GG, Deng QL, Wu ZH, Guo QY. Usefulness of diffusion/perfusion-weighted MRI in patients with non-enhancing supratentorial brain gliomas: a valuable tool to predict tumour grading? Br J Radiol. 2006;79:652–658. doi: 10.1259/bjr/25349497. [DOI] [PubMed] [Google Scholar]
- 35.Zonari P, Baraldi P, Crisi G. Multimodal MRI in the characterization of glial neoplasms: the combined role of single-voxel MR spectroscopy, diffusion imaging and echo-planar perfusion imaging. Neuroradiology. 2007;49:795–803. doi: 10.1007/s00234-007-0253-x. [DOI] [PubMed] [Google Scholar]
- 36.Nelson SJ, McKnight TR, Henry RG. Characterization of untreated gliomas by magnetic resonance spectroscopic imaging. Neuroimaging Clin N Am. 2002;12:599–613. doi: 10.1016/s1052-5149(02)00037-0. [DOI] [PubMed] [Google Scholar]
- 37.Catalaa I, Henry R, Dillon WP, et al. Perfusion, diffusion and spectroscopy values in newly diagnosed cerebral gliomas. NMR Biomed. 2006;19:463–475. doi: 10.1002/nbm.1059. [DOI] [PubMed] [Google Scholar]
- 38.Sadeghi N, D'Haene N, Decaestecker C, et al. Apparent diffusion coefficient and cerebral blood volume in brain gliomas: relation to tumor cell density and tumor microvessel density based on stereotactic biopsies. AJNR Am J Neuroradiol. 2008;29:476–482 doi: 10.3174/ajnr.A0851. [DOI] [PMC free article] [PubMed] [Google Scholar]