Abstract
We evaluate the value of MR diffusion tensor imaging (DTI) and dynamic susceptibility-weighted contrast material-enhanced perfusion-weighted imaging (PWI) in preoperative grading of supratentorial nonenhancing gliomas. This institutional review board–approved, Health Insurance Portability and Accountability Act–compliant retrospective study involved 52 patients: 37 with low-grade gliomas (LGGs) and 15 with high-grade gliomas (HGGs). The mean trace apparent diffusion coefficient (ADC), minimal ADC, mean fractional anisotropy (FA), maximal FA, and maximal relative cerebral blood volume (rCBV) ratio of the lesions were measured and compared between LGG and HGG. The efficacy of the above parameters in grading supratentorial nonenhancing gliomas was evaluated. There was no significant difference in rCBV ratio, minimal ADC, and mean ADC between LGG and HGG (p > 0.05). The mean and maximal FA values of LGG were significantly lower than the values of HGG (p < 0.001). The receiver operating characteristic analysis showed that the mean FA with a cutoff value of 0.129 and the maximal FA with a cutoff value of 0.219 could differentiate between LGG and HGG with specificity of 69.2% and 76.9%, respectively, and sensitivity of 93.3% and 100.0%, respectively. The combination of mean FA and maximal FA based on the linear discriminant analysis improved the diagnostic accuracy with specificity of 92.3% and sensitivity of 86.7%. These findings were better than maximal rCBV ratio, mean ADC, and minimum ADC. The mean FA and maximal FA, used individually or combined, may be useful in preoperative grading of supratentorial nonenhancing gliomas.
Keywords: brain, nonenhancing glioma, diffusion tensor imaging, perfusion-weighted imaging
A supratentorial nonenhancing high-grade glioma (HGG) could be misdiagnosed as a low-grade glioma (LGG) if lack of enhancement is regarded as a sign of a benign neoplasm.1–3 Several studies have demonstrated that absence of enhancement does not necessarily imply LGG status.1–10 As many as 14–45% of supratentorial nonenhancing gliomas were found to be malignant,1,2,5–8 and up to 25% of HGGs may show only faint or no detectable enhancement.2,8,9 Thus, it is a diagnostic challenge to preoperatively grade supratentorial nonenhancing gliomas based on conventional MR imaging alone.
Dynamic susceptibility-weighted contrast-enhanced perfusion-weighted imaging (DSC-PWI) is a well-established technique in grading cerebral gliomas and predicting prognosis.9–13 Law et al. proposed a relative cerebral blood volume (rCBV) ratio cutoff value of 1.75 to distinguish LGG from HGG.11 MR PWI has also been described as being useful in the assessment of nonenhancing gliomas. Fan et al. and Maia et al. demonstrated that the rCBV ratio of the nonenhancing HGG was significantly higher when compared with the nonenhancing LGG,2,4 but there was no quantitative threshold recommended to differentiate LGG from HGG. The utility of the rCBV cutoff value of 1.75 in grading supratentorial nonenhancing gliomas has not been verified.
Apparent diffusion coefficient (ADC) is another advanced MR imaging parameter used in the evaluation of brain tumors.14–18 Although Fan et al. did not find significant difference of mean ADC comparing the nonenhancing LGG and HGG, they reported that the minimal ADC was a valuable tool in preoperative grading of astrocytomas.2 Diffusion tensor imaging (DTI), besides providing ADC information, uniquely provides information on anisotropy, including fractional anisotropy (FA). Goebell et al. found no significant difference of FA ratio comparing 11 LGG and 12 anaplastic astrocytomas,19 and Lee et al. showed that the FA ratios of nonenhancing regions in 16 enhancing HGGs were not significantly different from the FA ratios of 8 nonenhancing LGGs.20 Studies from the groups of Inoue et al. and Beppu et al. demonstrated that FA values could distinguish between LGG and HGG21–24 and showed a positive correlation between high FA value and the cell density in gliomas, which was consistent with the finding of Kinoshita et al.25 These indicate the possible association between the higher FA value and the malignant gliomas. However, Stadlbauer et al. found that the mean FA values in 7 patients with World Health Organization (WHO) grade II gliomas were significantly higher than in 13 patients with WHO grade III gliomas; furthermore, the FA values had a negative correlation with cell number.26 The value of FA in preoperative grading of gliomas is still controversial. We hypothesize that mean FA and maximal FA may be useful parameters in differentiating nonenhancing LGG from HGG.
The purpose of this study is to evaluate various imaging parameters, including maximal rCBV, mean ADC, minimum ADC, mean FA, and maximal FA with regard to preoperative grading of supratentorial nonenhancing gliomas and to investigate the optimal thresholds of these imaging parameters, which may aid in differentiation of supratentorial nonenhancing LGG from HGG.
Materials and Methods
We retrospectively analyzed data acquired as part of an institutional review board–approved study compliant with the Health Insurance Portability and Accountability Act. The need to obtain informed consent was waived.
MR examinations of 52 patients (mean age 40 ± 13), including 30 patients with LGG (8 astrocytomas, 11 oligodendrogliomas, and 11 oligoastrocytomas) and 22 patients with HGG (10 anaplastic astrocytomas, 8 anaplastic oligoastrocytomas, and 4 glioblastomas), were reviewed. None of the tumors presented any significant enhancement on T1-weighted image (1.5 Tesla, resolution time [TR]/echo time [TE] 550/9 ms, field of vision [FOV] = 24 ×24 cm2. Matrix = 256 ×192, thickness = 5 mm and gap =1 mm) or T1 fluid attenuated inversion recovery (FLAIR) images (3 Tesla, TR/TE 2962/8.6 ms, inversion time [TI] = 920 ms, FOV = 24 ×24 cm2. Matrix = 320 ×224, thickness = 5 mm and gap = 1 mm) after contrast administration. Of these, 49 patients had PWI examinations (29 with LGG and 20 with HGG) and 28 patients had DTI examinations (13 with LGG and 15 with HGG). The pediatric patients that were excluded as having juvenile pilocytic astrocytomas (WHO grade I) have been reported to show elevated rCBV, which may confound the evaluation of rCBV in the grading of gliomas.27
MR examinations were performed either on a 1.5T or a 3T MR imaging system (GE Medical Systems). None of these patients had been given any treatment, including steroids, prior to the MR examinations treatment. The precontrast DTI protocol included TR/TE = 12000/101.7 ms, FOV = 24 ×24 cm2. Matrix = 128 ×128, thickness = 3 mm and gap = 0 mm using 25 noncollinear gradient directions and a b value of 1000 s/mm2. Another 3 images were acquired without the use of a diffusion gradient (b = 0 s/mm2). The DSC-PWI images were acquired with a single-shot gradient-echo echo-planar imaging sequence (TR/TE =1500/50 milliseconds; flip angle, 80°; FOV = 24 ×24 cm2; matrix = 96 ×128; thickness = 5 mm and gap = 0 mm) during the first pass of bolus of gadoversetamide (body weight–based dose, the maximal is 0.05 mmol per kilogram of body weight at 4 ml/s in 3T and 20 ml at 5 ml/s in 1.5T) through a 20- to 22-gauge intravenous catheter, immediately followed by a bolus injection of saline (20 ml).
MR PWI and DTI data were processed on the GE workstation with Functool 5.2 software. The coregistration of T2*-weighted images (transverse gradient-echo dynamic susceptibility-weighted perfusion contrast-enhanced MR image) in MR PWI was firstly performed to correct the motion artifact with Brainstat software. The rCBV map (approximated by using the negative enhancement integral) was then overlaid on the T2*-weighted image. The rCBV measurements were calculated from regions of interest (ROIs) that were placed in regions of the highest perfusion as seen on the rCBV color overlay maps.10–12 Four to six ROIs, ranging in size from 38 to 45 mm2 each, were placed in the tumor to record the maximal rCBV value. The placement of ROIs was carefully performed to avoid cystic or necrotic parts and large vessels based on the combined information from T1-weighted image, T2 FLAIR image, and T2*-weighted image. One additional ROI of the same size was placed in normal, unaffected contralateral white matter as reference. The maximal rCBV ratio was calculated by dividing the maximal rCBV value in the tumor with the rCBV value in the reference ROI.
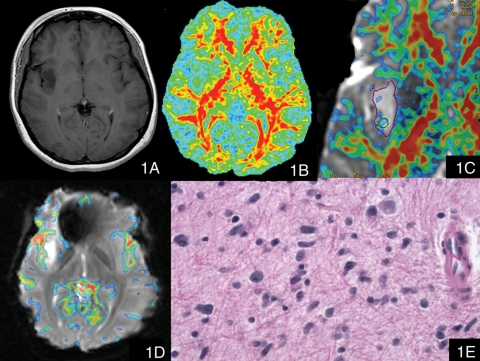
After the coregistration of diffusion-weighted images with the corresponding b = 0 images to remove distortions, conventional ADC and dimensionless FA images were generated. The minimal visualization threshold of the dimensionless FA was elevated to 0.215 (based on findings in a prior preliminary study28), and the dimensionless FA map was overlaid on the T2*-weighted (b = 0) image (Fig. 1). First, a large ROI was outlined on the dimensionless FA color overlay map covering the gross tumor, avoiding cystic or necrotic parts. Four to six ROIs, ranging in size from 27 to 38 mm2 each, were subsequently placed in the solid tumor part. The mean ADC, minimal ADC, mean FA, and maximal FA values of the tumors were recorded. The placement of ROIs in PWI and DTI data analysis was decided by consensus of 2 of the authors (X.L. and W.T., who have 9 and 6 years of experience in MR PWI and DTI data analysis, respectively), who were blinded to the histopathological and clinical information.
Fig. 1.
A patient with anaplastic astrocytoma (WHO grade III). (1A) Postcontrast T1-weighted image showed a nonenhancing lesion in the right insular lobe. (1B) The contours and margins of the tumor could not be adequately visualized on the conventional dimensionless color FA image (FA scale range 0 to 0.6). (1C) The zoomed dimensionless FA color map was overlaid on the T2*-weighted (b = 0) image with the minimal FA value elevated to 0.215; this overlaid color image clearly showed the nodules with FA values larger than 0.215 within the tumor. (1D) The color maximal rCBV image overlaid on the T2*-weighted image (transverse gradient-echo dynamic susceptibility-weighted perfusion contrast-enhanced MR image) showed that there was no significant increased rCBV within the tumor (the maximal rCBV ratio value was 0.87). (1E) Hematoxylin and eosin, 400×, Infiltrating neoplastic cells have angulated elongated hyperchromatic nuclei.
In addition, the tumor size was measured based on the Macdonald criteria29 using the T2-weighted image (1.5T, TR/TE 6000/94.9 ms, FOV = 22 ×22 cm2. Matrix = 380 ×380, thickness = 5 mm and gap = 1 mm; 3T, TR/TE 6600/107.1 ms, FOV = 24 ×24 cm2. Matrix = 480 ×480, thickness = 5 mm and gap = 1 mm). The difference in age, tumor size, mean ADC, minimal ADC, mean FA, and maximal FA values between supratentorial nonenhancing LGG and HGG were assessed by the Mann–Whitney U test. A linear discriminant analysis (LDA) was performed to build the optimal discriminant function in grading supratentorial nonenhancing gliomas. The area under the curve (AUC) for receiver operating characteristic (ROC) was computed for the above imaging parameters and the LDA output. Statistical analysis was performed with SPSS for Windows software, version 15, and the R programming language,30,31 version 2.9.2, with p-values of less than 0.05 recognized as the criteria for significance.
Histopathological Review
All tumors were confirmed by means of a histopathological examination after either biopsy or surgical resection. Histopathological diagnosis was reviewed with specimens of each tumor according to the WHO criteria and by consensus between two authors (G.Y. and M.J., with 3 and 22 years of experience, respectively, in neuropathology), who were blinded to the histopathological and clinical information.
Results
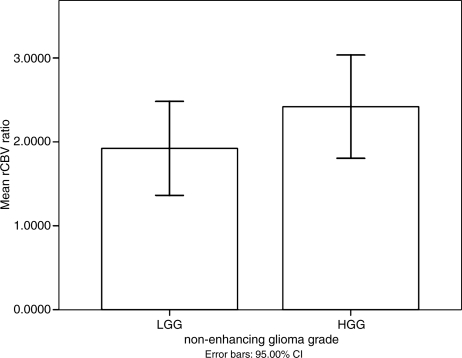
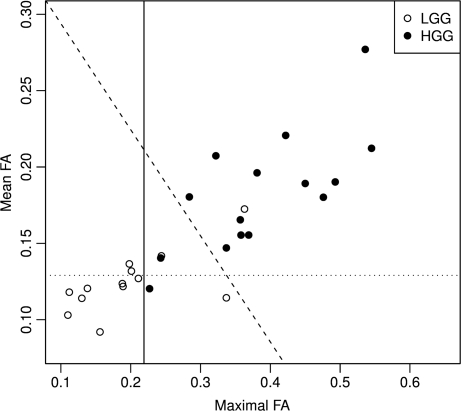
In the present study, 42.3% (22/52) of supratentorial nonenhancing gliomas were high grade. The mean values of parameters in these nonenhancing LGGs and HGGs are shown in Table 1. There was no significant difference in age, sex, or tumor size between nonenhancing LGGs and HGGs (p > 0.05). Although the mean value of maximal rCBV ratio in the LGG was lower than that of the HGG (Fig. 2), and the mean and minimal ADC values of the LGG were higher than in the HGG, there was no significant difference for any of these parameters (p > 0.05). However, the mean FA and maximal FA values of LGG were significantly lower than those of HGG (p < 0.001) (Fig. 3). The lowest value for maximal FA in the nonenhancing HGG group was 0.227. There were 3 cases in the LGG group, with maximal FA values of 0.244, 0.337, and 0.363. The maximal FA values for all other LGG gliomas were less than 0.215. Representative images are shown in Figure 1, Figure 4. and Figure 5.
Table 1.
Mean Values (mean ± SD) of Various Imaging Parameters in Nonenhancing LGG and HGG
| Imaging Parameters | LGG | HGG | p-Value |
|---|---|---|---|
| Age | 42 ± 14 | 38 ± 12 | 0.612 |
| Tumor size (mm2) | 2017.6 ± 1268.78 | 1645.97 ± 630.74 | 0.491 |
| Mean FA | 0.124 ± 0.02 (range 0.09–0.17) | 0.182 ± 0.039 (range 0.12–0.28) | p < 0.001* |
| Maximal FA | 0.198 ± 0.079 (range 0.11–0.36) | 0.386 ± 0.099 (range 0.23–0.55) | p < 0.001* |
| Mean ADC (×10−3mm2/s) | 1.407 ± 0.466 (range 0.17–2.15) | 1.322 ± 0.312 (range 0.94–2.19) | 0.57 |
| Minimal ADC (×10−3mm2/s) | 1.184 ± 0.511 (range 0.12–1.96) | 0.994 ± 0.399 (range 0.31–1.65) | 0.279 |
| Maximal rCBV ratio | 1.922 ± 1.469 (range 0.49–6.7) | 2.419 ± 1.315 (range 0.87–5.44) | 0.222 |
* Indicates statistical significance.
Fig. 2.
The mean value plot of maximal rCBV ratio in nonenhancing LGG and HGG. There was no significant difference of mean values of maximal rCBV ratio between nonenhancing LGG and HGG. The error bars represent a 95% confidence interval.
Fig. 3.
Scatter plot of maximal FA and mean FA in nonenhancing LGG and HGG with discriminant lines. The vertical line represents cutoff value = 0.219 for maximal FA. The horizontal line represents cutoff value = 0.129 for mean FA. The oblique line represents cutoff value = 0.0 for the linear discriminant score (bivariate(mean FA + maximal FA)), which separates LGG from HGG better than either maximal FA or mean FA alone.
Fig. 4.
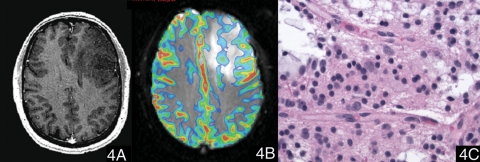
A case of oligodendroglioma (WHO grade II). (4A) Postcontrast T1-weighted image showed a nonenhancing lesion in the left frontal lobe. (4B) The color maximal rCBV image overlaid on the T2*-weighted image (transverse gradient-echo dynamic susceptibility-weighted perfusion contrast-enhanced MR image) showed that the maximal rCBV ratio of the tumor was 2.02. (4C) Hematoxylin and eosin, 400×, neoplastic cells show round nuclei and a network of thin capillaries.
Fig. 5.
A case of astrocytoma (WHO grade II). (5A) Postcontrast T1-weighted image showed a nonenhancing lesion in right frontal lobe. (5B) The color maximal rCBV image overlaid on the T2*-weighted image (transverse gradient-echo dynamic susceptibility-weighted perfusion contrast-enhanced MR image) showed that there was no significant increased rCBV ratio within the tumor (the maximal rCBV ratio value was 0.88). (5C) The color FA map overlaid on the T2*-weighted (b = 0) image with the minimal FA of 0.215 showed that there was no evident voxels with FA values higher than 0.215. (5D) Hematoxylin and eosin, 400×, neoplastic cells have round nuclei without perinuclear clearing.
As the mean FA value and maximal FA value were significantly different between LGG and HGG groups, the Wilk's lambda test in the multivariate analysis of variance showed significantly different joint distribution of the mean FA value and maximal FA value between LGG and HGG groups (p < 0.0001). Thus, LDA was performed with both mean FA value and maximal FA value as predictors. The resulting discriminant score, expressed as bivariate(mean FA + maximal FA), is:
bivariate(mean FA + maximal FA) = 7.943 (maximal FA) + 11.431 (mean FA) − 4.154. A patient with bivariate(mean FA + maximal FA) < 0 is diagnosed as LGG, otherwise HGG.
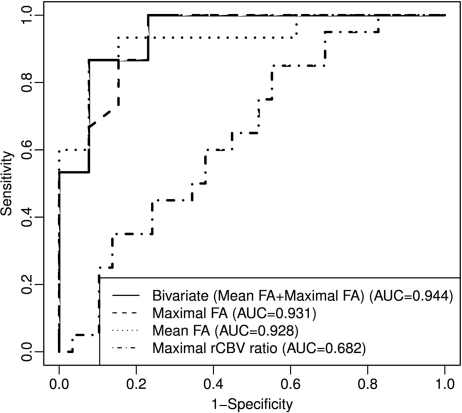
The result of the ROC analysis of the above parameters is recorded in Table 2, Figure 6. The prediction analysis with univariate showed that mean FA (AUC of 0.928) and maximal FA (AUC of 0.931) were better than other imaging parameters. The mean FA cutoff value of 0.129 and a maximal FA cutoff value of 0.219 could differentiate LGG from HGG with a specificity of 69.2% and 76.9%, respectively, and sensitivity of 93.3% and 100.0%, respectively. The bivariate(mean FA + maximal FA) on LDA method had a higher AUC of 0.944, with specificity of 92.3% and sensitivity of 86.7%, respectively. In contrast, the sensitivity and specificity, based on an rCBV ratio threshold value of 1.75, were 60% and 58.6%, respectively, with AUC of 0.682.
Table 2.
Sensitivity and Specificity of Imaging Parameters in Grading Nonenhancing Glioma Using Receiver Operating Characteristic Analysis
| Parameters | Cutoff Value | Sensitivity | Specificity | AUC |
|---|---|---|---|---|
| Mean FA | 0.129 | 0.933 | 0.692 | 0.928 |
| Maximal FA | 0.219 | 1 | 0.769 | 0.931 |
| Mean ADC (×10−3mm2/s) | 1.22 | 0.667 | 0.308 | 0.367 |
| Minimal ADC (×10−3mm2/s) | 0.912 | 0.6 | 0. 308 | 0.692 |
| Maximal rCBV ratio | 1.84 | 0.6 | 0.621 | 0.682 |
AUC, area under curve.
Fig. 6.
ROC curve for differentiation of LGG from HGG. Predictors: the linear discriminant score (bivariate(mean FA + maximal FA) on LDA method), maximal rCBV ratio, maximum FA value, and mean FA value.
There were 24 patients who had both PWI and DTI examinations. The Spearman correlation analysis was conducted to assess the correlation between the rCBV ratio and FA values in these cases. However, there was no significant correlation between the rCBV ratio and the mean FA value (correlation coefficient was 0.117, and p-value =0.588) or the maximal FA value (correlation coefficient was 0.3, and p-value =0.155).
Discussion
The present study could not detect any significant difference between the supratentorial nonenhancing LGG and HGG with regard to age, sex, tumor size, maximal rCBV ratio, mean ADC, or minimal ADC. The values of mean FA and maximal FA, however, were significantly higher in HGG than in LGG, with a higher sensitivity and specificity in the grading of nonenhancing gliomas than the other imaging parameters.
The mean ADC and minimal ADC values have been reported to correlate with tumor cell density and have been used to grade astrocytomas.14–18 The present study showed no significant difference for these two parameters, which is consistent with the study by Fan et al.2 This may relate to the larger population in our study, which included not only astrocytomas, but also oligodendrogliomas and oligoastrocytomas.
FA has been used to grade gliomas, with consensus in a majority of studies showing a trend toward higher FA values in HGG relative to LGG.19–20,22,24,25 Comparison of mean FA values in the nonenhancing part of gliomas also revealed a higher FA value in high-grade gliomas (0.220 ± 0.087) compared with low-grade gliomas (0.169 ± 0.085).20 Stadlbauer et al.,26 however, found that the mean FA value in grade III gliomas (0.170 ± 0.051) was lower than that of grade II gliomas (0.196 ± 0.032). This apparent contradiction in theories was hypothesized to be due to a difference in placement of ROIs for measurement of FA.25 ROIs were placed not only within the center of the tumor but also at the junction of the tumor with adjacent white matter in the study by Stadlbauer et al.26 The relatively less destroyed adjacent white matter fibers in grade II gliomas may have contributed to the higher FA values in the low-grade gliomas in that study.25
Mean and maximal FA values within nonenhancing gliomas of our study were also significantly higher in HGG when compared with LGG. These findings are consistent with the results in studies by Inoue et al., Beppu et al., and Kinoshita et al.21–25 The mechanisms underlying the higher FA values in HGG are complex but can be attributed to the following factors as hypothesized by various authors:
Higher tumor cellularity in HGG may positively correlate with higher FA values.21–25,32
Increase in the degree of directionality of water diffusion due to decrease in extracellular volume (increased cellularity) may also induce increased FA values.32
The pseudopalisading structure in glioblastomas may contribute to the higher FA values similar to the high FA values in meningiomas.33,34
There was no maximal FA value in the nonenhancing HGG lower than 0.215, but there were 3 cases in the LGG group whose maximal FA values were higher (0.244, 0.337, and 0.363). The first case was an astrocytoma with a Ki-67 index of 5% and increased tumor cellularity; the second case was a diffuse astrocytoma with a Ki-67 index of 8%, a focal oligodendroglial component, and features suggestive of early anaplasia; and the third case was a diffuse astrocytoma with infiltration of the corpus callosum. The first two cases may suggest a positive correlation between FA value and increased tumor cellularity. The high FA value of the third case may be due to a measurement contamination with residual fibers in the corpus callosum.25 This may limit the utility of maximal FA in grading nonenhancing gliomas, when the tumors infiltrate predominantly large fiber structures with high FA values, such as corpus callosum. In those instances, careful interpretation should be performed comprehensively with other advanced imaging modalities, including PWI and MR spectroscopy.25
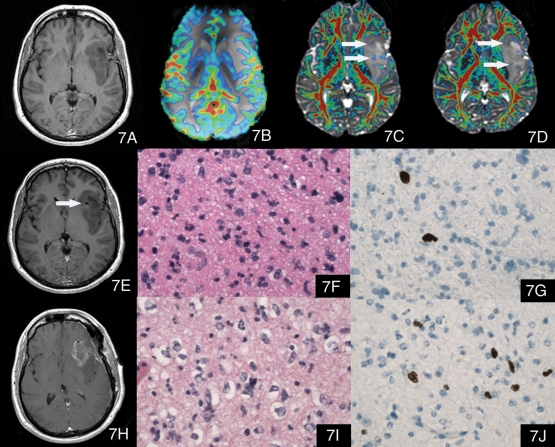
Accurate preoperative grading of supratentorial nonenhancing gliomas may require more than conventional MR imaging, a technique that cannot always distinguish nonenhancing HGG from LGG. Such misdiagnosis could lead to conservative treatment of an aggressive neoplasm.10,35 Our preliminary study not only indicated that the mean FA and maximal FA could differentiate grade in nonenhancing gliomas, but also provided the maximal FA color overlay map, which could easily visualize the tumor content with high FA value. This might be useful in guiding stereotactic biopsy of nonenhancing gliomas (Fig. 7) in future prospective studies.
Fig. 7.
A case with large mass involving the left insular, temporal, and frontal lobes. (7A) is a postcontrast T1-weighted image, which shows the nonenhancing lesion. (7B) The color maximal rCBV image overlaid on the T2*-weighted image (transverse gradient-echo dynamic susceptibility-weighted perfusion contrast-enhanced MR image) showed the maximal rCBV ratio of the tumor was 1.51, which might suggest an LGG. (7C) and (7D) The color FA maps overlaid on the T2*-weighted (b = 0) image with the minimal FA of 0.215 showed that there were multiple nodules with increased FA values higher than 0.215 (arrows) and the maximal FA was 0.357, which suggested HGG. (7E) The postcontrast T1-weighted image after biopsy, indicating that the biopsy area was posterior to the area with high FA values revealed on (7D). (7F) Hematoxylin and eosin, 400× of the specimen of the biopsy. The pathology diagnosis of the biopsy specimen was astrocytoma, WHO grade II, with atypical elongated nuclei but no mitotic activity. (7G) Immunohistochemical stain (400×) of the biopsy specimen showed a Ki-67 proliferation index of 5%. The patient was suggested conservative therapy because of the histopathological diagnosis of LGG; however, as the review of advanced MR images, including maximal FA information, suggested a higher grade of this tumor, the patient insisted on partial resection 1 month later without aggressive treatment. (7H) Postcontrast T1-weighted image showed the partial resection cavity. (7I) Hematoxylin and eosin, 400× of the specimen of the partial resection. The pathology diagnosis of the resection specimen was anaplastic astrocytoma, WHO grade III, with pleomorphic nuclei and a mitotic figure. This pathologic diagnosis was consistent with our preoperative evaluation. (7J) Immunohistochemical stain (400×) of the partial resection specimen showed a Ki-67 proliferation index of 7% in the resected neoplasm.
The maximal FA had the highest sensitivity (100%) in grading supratentorial nonenhancing gliomas. However, the bivariate(mean FA + maximal FA) on LDA method improved the diagnostic accuracy with better AUC of 0.944, specificity of 92.3%, and sensitivity of 86.7%. These indicated that a combination of univariate and bivariate(mean FA + maximal FA) on the LDA method could supply useful information for more accurate grading prediction of supratentorial nonenhancing gliomas.
Previous studies have demonstrated that the maximal rCBV ratio of HGG was significantly higher than the rCBV ratio of LGG,9,11 which was attributed to angiogenesis in the HGG. However, increased tumor vascularity can also be found in LGG, which will result in an elevated rCBV ratio. The pilocytic astrocytomas (WHO grade I), although biologically benign, have been described to exhibit histological evidence of angiogenesis and elevated rCBV ratio.27 The low-grade oligodendrogliomas have also been reported to show elevated rCBV ratio due to their inherent dense network of branching capillaries resembling a “chicken wire” pattern.9–13,36,37 Xu et al. found no significant difference in rCBV ratio between low- and high-grade oligodendrogliomas.36 Lev et al. reported that 50% of low-grade oligodendrogliomas presented elevated rCBV ratio.9 Cha et al. examined 14 low-grade oligodendrogliomas and found a range of rCBV ratio values from 1.29 to 9.24.37
In this study we could not find any significant difference in maximal rCBV ratio comparing supratentorial nonenhancing LGG and HGG. This is in conflict with the findings by Fan et al. and Maia et al.2,4 We suspect that this may be related to the higher number of oligodendroglioma cases with higher rCBV ratio in our study. On the other hand, our study revealed that low rCBV ratio values were also present in nonenhancing HGG. There were 7/19 HGGs with rCBV ratio values lower than 1.75, the lowest value being 0.87. This may indicate the changes in vascularity as gliomas’ dedifferentiation into HGG is probably a continuum and highly variable. Consequently, we cannot exclude that some HGGs may not have yet exhibited significant angiogenesis at the time of biopsy or areas of neovascularity were not biopsied.13 The ROC analysis of maximal rCBV ratio showed a sensitivity of 60% and specificity of 62.1% with a cutoff value of 1.84 in discriminating between the nonenhancing LGGs and HGGs, which may indicate that maximal rCBV ratio alone may have a limited value in this respect.
One major limitation in the present study is that there were no biopsies guided by maximal FA information. Thus, the correlation of maximal FA with histopathological change could not be assessed. Another limitation is the use of ROI measurement to detect maximal FA and minimum ADC values. Computer-aided voxel-based semi-automated segmentation techniques may reduce the subjective bias inherent in manual ROI placement. The third limitation relates to the relatively small population, with only 28 DTI examinations. Future prospective studies with larger populations will be necessary to verify our findings of optimal parameters for accurate preoperative grading of nonenhancing gliomas. Studies combing information from dynamic contrast enhancement may be useful in determining the permeability of tumor vessels in such nonenhancing gliomas to assess the extent of possible minor leakage of contrast material into the interstitium, which may not necessarily be visible on T1-weighted imaging.
In summary, our study did not demonstrate significant difference in maximal rCBV ratio between the supratentorial nonenhancing LGG and HGG. The univariate analysis showed that the mean FA and maximal FA were better imaging parameters, with regard to grading of supratentorial nonenhancing gliomas, than mean ADC, minimum ADC, and maximal rCBV ratio. The bivariate(mean FA + maximal FA) on LDA method improved the diagnostic accuracy with a specificity of 92.3%, sensitivity of 86.7%, and AUC of 0.944, which was better than any of other imaging parameters evaluated alone. The mean FA and maximal FA, used individually or combined, may be useful in preoperative grading of supratentorial nonenhancing gliomas.
Conflict of interest: None of the authors declare any conflict of interest.
References
- 1.Ginsberg LE, Fuller GN, Hashmi M, Leeds NE, Schomer DF. The significance of lack of MR contrast enhancement of supratentorial brain tumors in adults: Histopathological evaluation of a series. Surg Neurol. 1998;49:436–440. doi: 10.1016/s0090-3019(97)00360-1. [DOI] [PubMed] [Google Scholar]
- 2.Fan GG, Deng QL, Wu ZH, Guo QY. Usefulness of diffusion/perfusion-weighted MRI in patients with non-enhancing supratentorial brain gliomas: A valuable tool to predict tumour grading? Br J Radiol. 2006;79:652–658. doi: 10.1259/bjr/25349497. [DOI] [PubMed] [Google Scholar]
- 3.White ML, Zhang Y, Kirby P, Ryken TC. Can tumor contrast enhancement be used as a criterion for differentiating tumor grades of oligodendrogliomas? AJNR Am J Neuroradiol. 2005;26:784–790. [PMC free article] [PubMed] [Google Scholar]
- 4.Maia AC, Jr, Malheiros SM, da Rocha AJ, et al. MR cerebral blood volume maps correlated with vascular endothelial growth factor expression and tumor grade in nonenhancing gliomas. AJNR Am J Neuroradiol. 2005;26:777–783. [PMC free article] [PubMed] [Google Scholar]
- 5.Mihara F, Numaguchi Y, Rothman M, Kristt D, Fiandaca M, Swallow L. Non-enhancing supratentorial malignant astrocytomas: MR features and possible mechanisms. Radiat Med. 1995;13:11–17. [PubMed] [Google Scholar]
- 6.Scott JN, Brasher PM, Sevick RJ, Rewcastle NB, Forsyth PA. How often are nonenhancing supratentorial gliomas malignant? A population study. Neurology. 2002;59:947–949. doi: 10.1212/wnl.59.6.947. [DOI] [PubMed] [Google Scholar]
- 7.Barker FG, 2nd, Chang SM, Huhn SL, et al. Age and the risk of anaplasia in magnetic resonance-nonenhancing supratentorial cerebral tumors. Cancer. 1997;80:936–941. [PubMed] [Google Scholar]
- 8.Batra A, Tripathi RP, Singh AK. Perfusion magnetic resonance imaging and magnetic resonance spectroscopy of cerebral gliomas showing imperceptible contrast enhancement on conventional magnetic resonance imaging. Australas Radiol. 2004;48:324–332. doi: 10.1111/j.0004-8461.2004.01315.x. [DOI] [PubMed] [Google Scholar]
- 9.Lev MH, Ozsunar Y, Henson JW, et al. Glial tumor grading and outcome prediction using dynamic spin-echo MR susceptibility mapping compared with conventional contrast-enhanced MR: Confounding effect of elevated rCBV of oligodendrogliomas. AJNR Am J Neuroradiol. 2004;25:214–221. [PMC free article] [PubMed] [Google Scholar]
- 10.Law M, Oh S, Babb JS, et al. Low-grade gliomas: Dynamic susceptibility-weighted contrast-enhanced perfusion MR imaging—prediction of patient clinical response. Radiology. 2006;238:658–667. doi: 10.1148/radiol.2382042180. [DOI] [PubMed] [Google Scholar]
- 11.Law M, Yang S, Wang H, et al. Glioma grading: Sensitivity, specificity, and predictive values of perfusion MR imaging and proton MR spectroscopic imaging compared with conventional MR imaging. AJNR Am J Neuroradiol. 2003;24:1989–1998. [PMC free article] [PubMed] [Google Scholar]
- 12.Law M, Young RJ, Babb JS, et al. Gliomas: Predicting time to progression or survival with cerebral blood volume measurements at dynamic susceptibility-weighted contrast-enhanced perfusion MR imaging. Radiology. 2008;247:490–498. doi: 10.1148/radiol.2472070898. [DOI] [PMC free article] [PubMed] [Google Scholar]
- 13.Cha S, Knopp EA, Johnson G, Wetzel SG, Litt AW, Zagzag D. Intracranial mass lesions: Dynamic contrast-enhanced susceptibility-weighted echo-planar perfusion MR imaging. Radiology. 2002;223:11–29. doi: 10.1148/radiol.2231010594. [DOI] [PubMed] [Google Scholar]
- 14.Lee EJ, Lee SK, Agid R, Bae JM, Keller A, Terbrugge K. Preoperative grading of presumptive low-grade astrocytomas on MR imaging: Diagnostic value of minimum apparent diffusion coefficient. AJNR Am J Neuroradiol. 2008;29:1872–1877. doi: 10.3174/ajnr.A1254. [DOI] [PMC free article] [PubMed] [Google Scholar]
- 15.Higano S, Yun X, Kumabe T, et al. Malignant astrocytic tumors: Clinical importance of apparent diffusion coefficient in prediction of grade and prognosis. Radiology. 2006;241:839–846. doi: 10.1148/radiol.2413051276. [DOI] [PubMed] [Google Scholar]
- 16.Kikuchi T, Kumabe T, Higano S, Watanabe M, Tominaga T. Minimum apparent diffusion coefficient for the differential diagnosis of ganglioglioma. Neurol Res. 2009;31:1102–1107. doi: 10.1179/174313209X382539. [DOI] [PubMed] [Google Scholar]
- 17.Murakami R, Hirai T, Sugahara T, et al. Grading astrocytic tumors by using apparent diffusion coefficient parameters: superiority of a one-versus two-parameter pilot method. Radiology. 2009;251:838–845. doi: 10.1148/radiol.2513080899. [DOI] [PubMed] [Google Scholar]
- 18.Murakami R, Sugahara T, Nakamura H, et al. Malignant supratentorial astrocytoma treated with postoperative radiation therapy: Prognostic value of pretreatment quantitative diffusion-weighted MR imaging. Radiology. 2007;243:493–499. doi: 10.1148/radiol.2432060450. [DOI] [PubMed] [Google Scholar]
- 19.Goebell E, Paustenbach S, Vaeterlein O, et al. Low-grade and anaplastic gliomas: Differences in architecture evaluated with diffusion-tensor MR imaging. Radiology. 2006;239:217–222. doi: 10.1148/radiol.2383050059. [DOI] [PubMed] [Google Scholar]
- 20.Lee HY, Na DG, Song IC, et al. Diffusion-tensor imaging for glioma grading at 3-T magnetic resonance imaging: Analysis of fractional anisotropy and mean diffusivity. J Comput Assist Tomogr. 2008;32:298–303. doi: 10.1097/RCT.0b013e318076b44d. [DOI] [PubMed] [Google Scholar]
- 21.Misaki T, Beppu T, Inoue T, Ogasawara K, Ogawa A, Kabasawa H. Use of fractional anisotropy value by diffusion tensor MRI for preoperative diagnosis of astrocytic tumors: Case report. J Neurooncol. 2004;70:343–348. doi: 10.1007/s11060-004-6594-y. [DOI] [PubMed] [Google Scholar]
- 22.Inoue T, Ogasawara K, Beppu T, Ogawa A, Kabasawa H. Diffusion tensor imaging for preoperative evaluation of tumor grade in gliomas. Clin Neurol Neurosurg. 2005;107:174–180. doi: 10.1016/j.clineuro.2004.06.011. [DOI] [PubMed] [Google Scholar]
- 23.Beppu T, Inoue T, Shibata Y, et al. Fractional anisotropy value by diffusion tensor magnetic resonance imaging as a predictor of cell density and proliferation activity of glioblastomas. Surg Neurol. 2005;63:56–61. doi: 10.1016/j.surneu.2004.02.034. [DOI] [PubMed] [Google Scholar]
- 24.Beppu T, Inoue T, Shibata Y, et al. Measurement of fractional anisotropy using diffusion tensor MRI in supratentorial astrocytic tumors. J Neurooncol. 2003;63:109–116. doi: 10.1023/a:1023977520909. [DOI] [PubMed] [Google Scholar]
- 25.Kinoshita M, Hashimoto N, Goto T, et al. Fractional anisotropy and tumor cell density of the tumor core show positive correlation in diffusion tensor magnetic resonance imaging of malignant brain tumors. Neuroimage. 2008;43:29–35. doi: 10.1016/j.neuroimage.2008.06.041. [DOI] [PubMed] [Google Scholar]
- 26.Stadlbauer A, Ganslandt O, Buslei R, et al. Gliomas: Histopathologic evaluation of changes in directionality and magnitude of water diffusion at diffusion-tensor MR imaging. Radiology. 2006;240:803–810. doi: 10.1148/radiol.2403050937. [DOI] [PubMed] [Google Scholar]
- 27.Cha S. Dynamic susceptibility-weighted contrast-enhanced perfusion MR imaging in pediatric patients. Neuroimaging Clin N Am. 2006;16:137–147. doi: 10.1016/j.nic.2005.11.006. [DOI] [PubMed] [Google Scholar]
- 28.Liu X, Ekholm S, Westesson P. MR perfusion imaging and diffusion tensor imaging in the evaluation of high grade and low grade non-enhancing cerebral gliomas. Paper presented at: scientific assembly and program of the 94th annual meeting of Radiological Society of North America, 2008, Chicago. P143. [Google Scholar]
- 29.Macdonald DR, Cascino TL, Schold SC, Jr, Cairncross JG. Response criteria for phase II studies of supratentorial malignant glioma. J Clin Oncol. 1990;8:1277–1280. doi: 10.1200/JCO.1990.8.7.1277. [DOI] [PubMed] [Google Scholar]
- 30.Venables WN, Ripley BD. Modern Applied Statistics with s. 4th. New York: Springer; 2002. [Google Scholar]
- 31.R Development Core Team. R: A Language and Environment for Statistical Computing. Vienna, Austria: R Foundation for Statistical Computing; 2006. [Google Scholar]
- 32.Wang S, Kim S, Chawla S, et al. Differentiation between glioblastomas and solitary brain metastases using diffusion tensor imaging. Neuroimage. 2009;44:653–660. doi: 10.1016/j.neuroimage.2008.09.027. [DOI] [PMC free article] [PubMed] [Google Scholar]
- 33.Wippold FJ, 2nd, Lämmle M, Anatelli F, Lennerz J, Perry A. Neuropathology for the neuroradiologist: Palisades and pseudopalisades. AJNR Am J Neuroradiol. 2006;27:2037–2041. [PMC free article] [PubMed] [Google Scholar]
- 34.Toh CH, Castillo M, Wong AM, et al. Differentiation between classic and atypical meningiomas with use of diffusion tensor imaging. AJNR Am J Neuroradiol. 2008;29:1630–1635. doi: 10.3174/ajnr.A1170. [DOI] [PMC free article] [PubMed] [Google Scholar]
- 35.Danchaivijitr N, Waldman AD, Tozer DJ, et al. Low-grade gliomas: Do changes in rCBV measurements at longitudinal perfusion-weighted MR imaging predict malignant transformation? Radiology. 2008;247:170–178. doi: 10.1148/radiol.2471062089. [DOI] [PubMed] [Google Scholar]
- 36.Xu M, See SJ, Ng WH, et al. Comparison of magnetic resonance spectroscopy and perfusion-weighted imaging in presurgical grading of oligodendroglial tumors. Neurosurgery. 2005;56:919–926. [PubMed] [Google Scholar]
- 37.Cha S, Tihan T, Crawford F, et al. Differentiation of low-grade oligodendrogliomas from low-grade astrocytomas by using quantitative blood-volume measurements derived from dynamic susceptibility contrast-enhanced MR imaging. AJNR Am J Neuroradiol. 2005;26:266–273. [PMC free article] [PubMed] [Google Scholar]


