Abstract
We report MRI findings from 2 pediatric clinical trials of diffuse intrinsic brainstem glioma (BSG) incorporating concurrent radiation therapy (RT) with molecularly targeted agents (gefitinib and tipifarnib). We determined associations of MRI variables with progression-free survival and overall survival and investigated effects of treatment on these variables.
MRI (including diffusion and perfusion) was done before treatment, every 8 weeks (first year), every 12 weeks (thereafter), and at the end of treatment or disease progression. Reduced tumor volume (P < .0001) and tumor diffusion values (P <.0001) were apparent on the first post-RT/drug studies. Decreases in tumor volume correlated with pre-RT volume (P < .0001) and pre-RT diffusion values (P < .0001); larger decreases were noted for tumors with higher volumes and diffusion values. Patients with larger pre-RT tumors had longer progression-free survival (P < .0001). Patients with ≥25% decrease in tumor volume and diffusion values after RT had longer progression-free survival (P = .028) and overall survival (P = .0009). Enhancement at baseline and over time was significantly associated with shorter survival. Tumor diffusion values with baseline enhancement were significantly lower than those without (P = .0002).
RT of BSG is associated with decreased tumor volume and intralesional diffusion values; patients with ≥25% decrease in values post-RT had relatively longer survival intervals, apparently providing an early imaging-based surrogate for relative outcomes. Patients with larger tumors and greater decreases in tumor volume and diffusion values had longer survival intervals. Tumor enhancement was associated with shorter survival, lower tumor diffusion values (increased cellularity), and a smaller drop in diffusion values after RT (P = .006). These associations justify continued investigation in other large clinical trials of brainstem glioma patients.
Keywords: Pediatric; brain tumor; brainstem glioma; MRI, radiation
Newly diagnosed diffuse intrinsic brainstem gliomas (BSG) represent approximately 80% of all brainstem gliomas with 1-year and 5-year progression-free survival (PFS) rates of 25% and ≤10%, respectively, despite multiple treatment approaches.1 Brainstem tumors constitute 12% of all primary brain tumors in children aged 0-19 years.2 These lesions typically occur in the pons, with a characteristic appearance on MRI of a T2 hyperintense diffuse tumor, which expands and infiltrates the pons. This classic appearance in children with the appropriate clinical history usually precludes the need for biopsy to establish the diagnosis.3 Although radiation therapy (RT) may transiently improve neurologic function in these children,4 durable disease control has been elusive. To date, no conventional chemotherapeutic agent is known to affect outcome in children with diffuse BSG. Recently, novel targeted therapies such as gefitinib (Iressa, AstraZeneca) and tipifarnib (Zarnestra, Johnson & Johnson Pharmaceutical Research and Development) have been investigated concurrently with RT in phase I/II trials of children with BSG in the Pediatric Brain Tumor Consortium (PBTC).
Using standard MRI, quantitative MR diffusion, and MR perfusion, we assessed the potential associations among MRI findings and distributions of PFS and overall survival (OS) in the PBTC gefitinib and tipifarnib trials. First, we investigated the effects of concurrent radiation treatment and drug therapy on neuroimaging variables; and second, the association of neuroimaging variables with time-to-progression and time-to-death.
Materials and Methods
Study design
The institutional review boards of each PBTC institution approved these 2 studies in advance of initial patient enrollment; continuing approval was maintained throughout. Patients or legal guardians gave written, informed consent; assent was obtained (as appropriate) at the time of enrollment. The effects of RT combined with molecular targeting agents—gefitinib and tipifarnib—were analyzed in patients enrolled and treated on PBTC-007 phase I/II and PBTC-014 phase I/II. Patients treated in PBTC-007 phase 1 received gefitinib at doses of 100-375 mg/m2, and those in the phase 2 trial received a dose of 250 mg/m2 (once daily for both groups) with concurrent RT. Patients in PBTC-014 phase 1 received tipifarnib at doses of 100-150 mg/m2 and those on PBTC-014 phase 2 received tipifarnib with concurrent RT at 125 mg/m2/dose (twice daily for both groups). The clinical results will be reported separately. Progression was defined by the treating institutions using standard clinical criteria, including imaging interpretation based on identified metrics.
Imaging evaluation
Each course in both PBTC-007 and PBTC-014 was defined as 4 weeks. MRI was done before treatment, every other course throughout the first year, once every 3 courses thereafter, at the end of treatment (maximum, 2 years), and at the time of disease progression.
MRIs were obtained on 1.5T MR scanners; each site participated in quarterly MR quality assurance.5 Standard MRI consisted of the following required sequences: (1) axial T2-weighted fast spin echo; (2) axial T2 FLAIR; (3) single-shot echoplanar diffusion imaging to assess tumor cellularity at baseline and during therapy; (4) T2* axial echoplanar perfusion imaging to assess the relative cerebral blood volume in the tumor at baseline and over time; and (5) post-gadolinium axial T1-weighted SE images of the whole brain to assess intratumoral enhancement. The goal was to determine whether these MR sequences could be used as surrogate markers of tumor response and if imaging findings correlated with progression free or OS.
The following parameters were used for the imaging sequences at each site. FLAIR images were obtained with 4-mm contiguous slice thickness using the sequence TR/time of inversion/TE = 10,000/2200/162 ms, matrix= 256 x 192, FOV= 18-24 cm, and NEX = 1. Axial T2-weighted fast spin echo images were obtained with TR/ETE = (4000-6000)/80-100, ETL = 10-16, RB =± 16 kHz, FOV = 18-24 cm, slice thickness/gap = 4/0 interleaved, NEX = 2, matrix = 256 ×192, flow compensation option, and frequency direction A/P. Diffusion images were single-shot echoplanar spin echo images with a TR/TE = 2000/80 ms, 128 ×128 matrix, b-factor of 5/1000 s/mm2, 3 directions (x,y,z) for trace imaging, receiver bandwidth of ± 64 kHz, and frequency direction was R/L with a slice thickness/gap of 4/0. Perfusion imaging consisted of axial T2* 2D gradient echoplanar imaging, gradient echo mode, single shot, matrix =128 ×128, TR/TE = 1500/45-60 ms), FOV = 18-24 cm, NEX = 1, slice thickness 4/0, frequency direction R/L, 45–60 phases, and 10 phases prior to bolus injection of gadolinium diethylenetriamine penta-acetic acid at a dose of 0.1 mmol/kg at an average rate of 2-3 cc/second. Post-gadolinium axial T1-weighted spin-echo images were 4-mm contiguous slices through the whole head using repetition time (TR)/echo time (TE) = (500–700 ms)/minimum full; NEX = 2, matrix= 256 ×192.
Image analysis
Using the Vitrea workstation (Vital Images) and a perimeter technique, we performed volumetric tumor analyses on axial FLAIR sequences and post-gadolinium axial T1 images with user-assisted semi-automated software;6 and then recorded tumor volumes on FLAIR, enhancement on T1 gadolinium images, and cyst/necrosis on T1 gadolinium images.
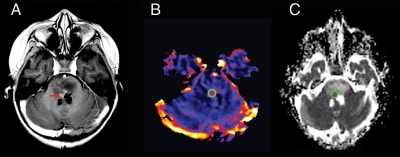
Perfusion images were transferred to an UltraSPARC II workstation (Sun Microsystems) and relative cerebral blood volume (rCBV) maps generated from the dynamic susceptibility-weighted perfusion MRI data using standard, previously described techniques.7 Regions of interest (ROI) 3-5 mm in diameter were obtained in the highest regions of perfusion in the tumor from the generated rCBV map (Figure 1). Regions of cyst/necrosis were avoided. The mean rCBV of the tumor ROI was divided by the mean rCBV from a ROI obtained from frontal white matter in the same study to normalize the data and allow comparison between serial studies as well as between patients. The resultant perfusion ratio was used for the statistical analyses.
Fig. 1.
Region of interest (ROI) measurements for diffusion and perfusion MR images in brainstem glioma. (A), Axial T1-weighted post-contrast image of a child with brainstem glioma demonstrates expansion of the pons and a region of tumoral enhancement (red arrow) anterior to the fourth ventricle. (B), Cerebral blood volume perfusion map demonstrates a ROI (green circle) chosen on the basis of the highest perfusion value within the tumor. (C), Apparent diffusion coefficient map with the ROI (green circle) placed in an anatomical location closest to that used for perfusion, while avoiding the ventricle.
Diffusion image and ROI analyses were performed using ImageJ (US National Institutes of Health). From the apparent diffusion coefficient (ADC) map, we obtained a ROI 3-5 mm in diameter in the same region of the tumor that was chosen for the perfusion analysis (Figure 1). In tumors without increased perfusion, a large 2-D ROI encompassing the whole solid portion of the tumor on a representative slice was chosen. Standard MRI images, such as T2 FLAIR, T2, and post-gadolinium T1, were used to ensure that the ROI was placed in a solid portion of the tumor, as in the case of the perfusion ROI avoiding regions of cyst/necrosis. The mean ADC from the tumor ROI was normalized using the same method used for the perfusion analysis—that is, the tumor ADC was divided by the mean ADC of a ROI placed in the normal frontal white matter from the same study, and the resultant diffusion ratio used for statistical analysis. In addition to allowing comparison between subjects, this method also accounts for changes in ADC in normal brain tissue with age.
Statistical considerations
The statistical methods utilized included Wilcoxon signed test, a nonparametric counterpart of the paired t test, to investigate the pre-RT versus post-RT changes in the neuroimaging variables of interest. In addition, Cox proportional hazards models were used to investigate the associations of imaging variables with PFS and OS. Progression was determined by the respective institutions directly by progressive neurologic or worsening neurologic status or a >25% increase in the bidimensional or volumetric measurement on MR or the appearance of a new lesion. Time to progression was calculated from the treatment start date to the progression date or to the date of death; similarly, time to death was also calculated from the treatment start date. Patients who did not experience an event for PFS or OS were censored at the last follow-up date. Because Cox proportional hazards models are known to produce spurious results if <10 events per covariate are available, associations with PFS and OS were only explored when at least 9 events were available for a given neuroimaging variable for the univariate Cox models. For multivariate Cox models, this approach was relaxed to 8 events per covariate in a given model. In all Cox models and when the log-rank test was used, the treatment protocol was treated as a stratification variable.
Because the P values were not adjusted for multiplicity, and a large number of tests were performed, the usual .05 significance level could not be applied in determining statistical significance; thus, each reported P value must be evaluated against the multiplicity adjusted significance level of .00057.
Results
Patients
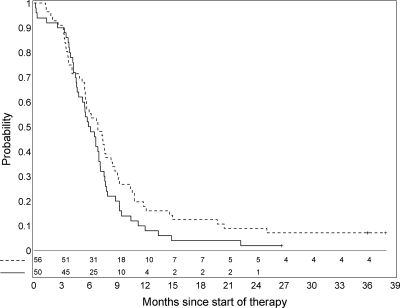
Fifty-six patients were enrolled in the PBTC-007 phase I/II trials, and 50 patients were enrolled in the PBTC-014 phase I/II trials. The median age for the 106 patients was 6.3 years (range, 3.3-18.7 years). There were 66 females (62.2%) (Table 1). Symptoms at presentation experienced by at least 5% of patients are summarized in Table 2. The PFS for this cohort is presented in Figure 2. Five patients remained “alive with disease” absent progression for ≥3 years at last report. Patterns of tumor progression are listed in Table 3 for 80 patients. In the remaining 21 patients, progressive disease location was unavailable; 12 were coded as clinical progression without documenting site, and 9 were listed as death due to tumor (n = 8) or unknown (n = 1) without specific anatomic information.
Table 1.
Patient characteristics in the brainstem glioma cohort
| Protocol |
|||||||
|---|---|---|---|---|---|---|---|
| Sex | Ethnicity | Dose | PBTC-007 |
PBTC-014 |
All patients | ||
| Phase I | Phase II | Phase I | Phase II | ||||
| Female | 14 | 22 | 10 | 20 | 66 | ||
| Male | 6 | 14 | 6 | 14 | 40 | ||
| Hispanic or Latino | 5 | 2 | 2 | 4 | 13 | ||
| Non-Hispanic | 15 | 34 | 14 | 30 | 93 | ||
| Gefinitib, 100 mg/m2 orally, QD | 6 | 6 | |||||
| Gefinitib, 250 mg/m2 orally, QD | 7 | 36 | 43 | ||||
| Gefinitib, 375 mg/m2 orally, QD | 7 | 7 | |||||
| Tipifarnib, 100 mg/m2 orally, BID | 5 | 5 | |||||
| Tipifarnib, 125 mg/m2 orally, BID | 6 | 34 | 40 | ||||
| Tipifarnib, 150 mg/m2 orally, BID | 5 | 5 | |||||
| Age at diagnosis, median (range) | 7.4 (3.4-15.1) |
7.1 (3.4-18.7) |
6.2 (3.6-13.7) |
5.5 (3.3-16.5) |
6.3 (3.3-18.7) |
||
| All patients | 20 | 36 | 16 | 34 | 106 | ||
BID, twice daily; QD, every day.
Table 2.
Clinical symptoms at diagnosis experienced by ≥5% of patients with brainstem glioma
| Category | Symptom | Grade 1 | Grade 2 | Grade 3 | Grade 4 | All patients |
|---|---|---|---|---|---|---|
| Neurological | Ataxia (incoordination) | 11 | 31 | 6 | 1 | 49 |
| Dizziness | 4 | 2 | . | . | 6 | |
| Mood alteration (agitation ) | 7 | . | . | . | 7 | |
| Neuropathy - cranial | 13 | 48 | 6 | . | 67 | |
| Neuropathy - motor | 2 | 10 | 6 | . | 18 | |
| Pyramidal tract dysfunction (eg, increased tone, hyperreflexia, positive Babinski, decreased fine motor coordination) | 4 | 2 | . | . | 6 | |
| Speech impairment (eg, dysphasia or aphasia) | . | 10 | 3 | . | 13 | |
| Ocular/visual | Nystagmus | 10 | 2 | . | . | 12 |
| Ophthalmoplegia/diplopia (ie, double vision) | 10 | 12 | . | . | 22 | |
| Pain | Head/headache | 12 | 2 | . | . | 14 |
Grade refers to the Common Terminology Criteria for Adverse Events version 2-3 from the Cancer Therapy Evaluation Program
Fig. 2.
Progression-free survival for PBTC-007 (dashed line) and PBTC-014 (solid line).
Table 3.
Patterns of tumor progression in patients with brainstem glioma
| PD location | PD size, by area or volume |
All patients | ||
|---|---|---|---|---|
| PD (NOS) | PD 25%–49% | PD ≥50% | ||
| Brain: leptomeningeal | 3 | . | . | 3 |
| Brain: local | 44 | 20 | 7 | 71 |
| Brain local or new infratentorial site | 1 | . | . | 1 |
| Brain: local or new supratentorial site | 1 | 1 | . | 2 |
| Brain: local; spine: leptomeningeal | 1 | . | 1 | 2 |
| Spine: leptomeningeal | 1 | . | . | 1 |
| All patients | 51 | 21 | 8 | 80 |
PD, progressive disease; NOS, not otherwise specified.
Imaging evaluation
We obtained 490 brain MRI scans from the 106 patients enrolled, each of whom had at least 1 neuroimaging variable measured. Most of the brainstem gliomas were T1 hypointense and T2 hyperintense at presentation. The median tumor volume was 31.73 cc based on FLAIR images (n = 99; range, 7.3-80.2 cc). Of 97 patients with baseline T1 gadolinium imaging, 37 (38%) had no enhancement at diagnosis. The remaining 60 patients had a median enhancing volume of 1.28 cc (range, 0.02-30.88 cc). Twenty-four patients presented with cystic necrosis at diagnosis, ranging from 0.06 to 9.46 cc (median, 1.37 cc). The median tumor diffusion ratio was 1.57 (n = 97; range, 0.9-1.89), and the median perfusion ratio value was 3.07 (n = 66; range, 0.77-4.61).
1. RT and drug effect on newly diagnosed BSG
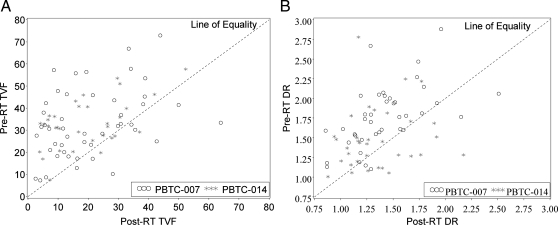
All patients received concurrent RT and molecularly targeted drug. Scans were obtained before RT within 2 weeks of therapy initiation and after RT at a median of 55 days from the treatment start date (range, 28-69 days, with 85% of the patients having post-RT scans between days 48 and 60 from the treatment start date). We analyzed neuroimaging variables, including tumor volume on FLAIR and enhancing tumor volume on T1 gadolinium images. In 68 (85%) of 80 study subjects with pre-RT and immediate post-RT imaging, post-RT tumor volumes were lower than pre-RT tumor volumes (P = .0001), as demonstrated on FLAIR images (Figure 3A). Larger decreases in tumor volume were noted for tumors with higher pre-RT volumes (P < .0001). There was no association with steroid use.
Fig. 3.
Decline in tumor volume (A) and diffusion values (B) after radiation therapy (RT). DR, diffusion ratio; TVF, tumor volume flair.
In 58 (77.3%) of 75 patients with pre-RT and immediate post-RT diffusion studies, MR diffusion values decreased statistically on average within the tumor with irradiation (P < .0001) (Figure 3B). Pre-RT diffusion ratios were significantly correlated with the change during RT (P < .0001), with larger decreases observed in tumors with higher pre-RT diffusion values. The pre-RT diffusion ratio at diagnosis was not associated with PFS (P = .19) or OS (P = .72).
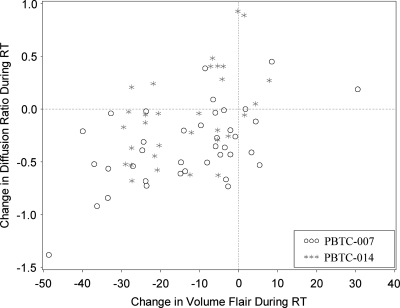
There was evidence of an association between the change in tumor volume and the change in diffusion following RT (Spearman's rank correlation, 0.39; P = .001). On average, when pre-RT and post-RT values are compared, patients with a larger drop in tumor volume likewise evidenced a larger drop in diffusion (Figure 4).
Fig. 4.
Radiation effect on tumor volume and diffusion values. Patients with a larger decrease in tumor volume also had larger drops in diffusion values after radiation and drug (Spearman's rank correlation, 0.39, P = .001). RT, radiation therapy.
2. Associations of MRI variables with PFS and OS
Baseline tumor volume flair (TVF) and TVF as a time-dependent covariate were associated with PFS in a multivariable Cox model. Among patients with a similar rate of change during RT and longitudinal TVF, patients with larger tumors before RT had longer PFS (nevents = 65; P < .0001). Among patients with similar pre-RT TVF and rate-of-change during RT, those with a greater increase in TVF over time had shorter PFS (P < .0001) and OS (nevents = 64; P = .0008).
Tumor enhancement was associated with PFS and OS as a time-dependent covariate. Patients with increasing enhancement over time had shorter PFS and OS (nevents = 67; P < .0001). Baseline enhancement was associated with poorer PFS and OS (nevents = 76 [P = .003] and 75 [P = .0006], respectively). The baseline diffusion tumor values in tumors with enhancement (median, 1.45) had significantly lower values than tumors without enhancement (median, 1.78; P = .0002)
MR perfusion values at baseline were not associated with either PFS (nevents = 34; P= .078) or OS (nevents = 34; P = .80); there was also no evidence of association with survival when perfusion values were used as a time-dependent covariate (P = .43 and P = .91, respectively, for PFS and OS).
Longitudinal MR diffusion values following RT were not associated with PFS or OS (P = .89 and P = .39, respectively).
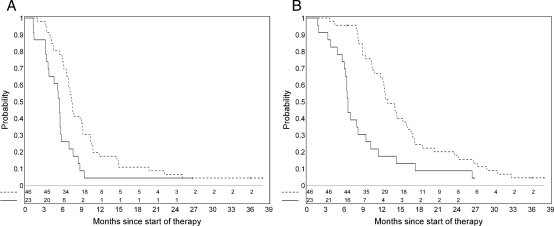
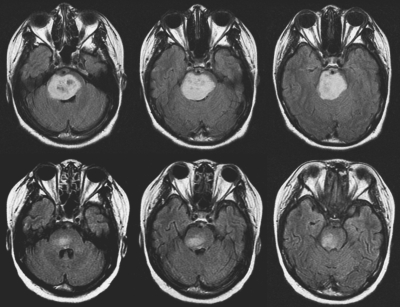
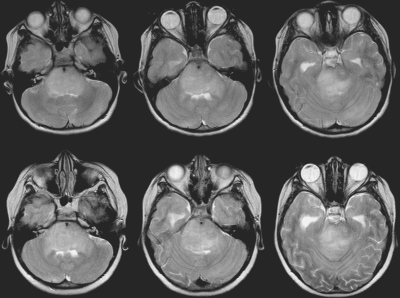
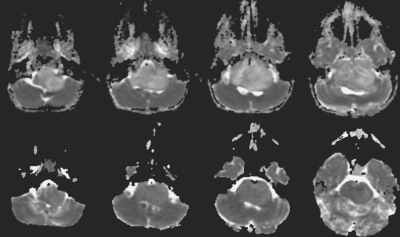
We hypothesized that a 25% decrease in tumor volume during drug and RT would translate into a clinically meaningful benefit based on preliminary analyses done in a previous PBTC trial of imatinib in children with newly diagnosed BSG. Patients who had both pre-RT and post-RT tumor volume and tumor diffusion measurements were categorized into 2 groups: (1) those with a ≥25% decrease in either tumor volume or diffusion during RT, and (2) those with <25% decrease. There was evidence that this categorization may be associated with PFS (nevents = 66; P = .028) (Figure 5A) and with OS (nevents = 65; P = .0009) (Figure 5B) in a multivariable model. Examples of patients in the 2 categories are shown in Figures 6–9. In 48 of 75 patients with both intratumoral enhancement and diffusion values, there was less of a decrease in diffusion values between pre-RT to post-RT periods (median actual change, -0.16), compared with 27 patients who did not have intratumoral enhancement, who showed a greater decrease in diffusion values (median actual change, -0.44; P = .006). The percent change (before RT to after RT) in the diffusion values in patients with intratumoral enhancement, on average, was 13%, compared with in patients without enhancement, who on average had a 24% decrease (P = .011)
Fig. 5.
Kaplan-Meier estimate of progression-free survival (A) and overall survival (B) by percentage decrease in tumor volume or diffusion ratio values during radiation therapy for the 2 subgroups of patients with brainstem glioma: one group with a ≥25% decrease in tumor volume or in diffusion ratio (dashed line) versus those without this change (solid line). The progression-free survival is better for patients with a ≥25% decrease in tumor volume after radiation.
Fig. 6.
Axial FLAIR images from a 17-year-old girl with diffuse intrinsic brainstem glioma obtained before (top) and after (bottom) radiation therapy, demonstrating an 86% decrease in tumor volume from 37.96 cc to 5.22 cc, with progression-free survival duration of 317 days.
Fig. 7.
Axial T2 images from an 8-year-old girl with diffuse intrinsic brainstem glioma before (top) and after (bottom) radiation therapy, demonstrating a 5% increase in tumor volume, with a short progression-free survival duration of 38 days.
Fig. 8.
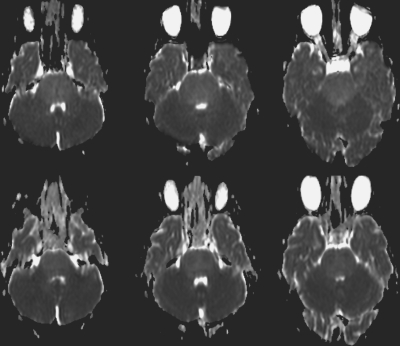
Apparent diffusion coefficient maps before (top) and after (bottom) radiation therapy for a 4-year-old girl with brainstem glioma. The ratio of the diffusion value within the tumor normalized with frontal white matter demonstrates a 41% decrease in values, with a longer progression-free survival duration of 602 days.
Fig. 9.
Apparent diffusion coefficient maps before (top) and after (bottom) radiation therapy for a 6-year-old girl with brainstem glioma. The ratio of the diffusion value within the tumor normalized with frontal white matter demonstrates a 0.8% decrease in values, with a short progression-free survival duration of 104 days.
Discussion
As children with BSG are evaluated and new treatments developed, the role of imaging in disease assessment is crucial. In this study, we sought to define the imaging characteristics associated with PFS.
This study of children with newly diagnosed BSG used MRI to evaluate response to concurrent RT and molecularly targeted agents. Gefitinib is a selective inhibitor of epidermal growth factor receptor—a protein overexpressed in certain neoplastic processes that may cause activation of the Ras signal transduction cascade and uncontrolled cell proliferation. Tipifarnib is a farnesyltransferase inhibitor, and like gefitinib, it may ultimately affect the Ras protein and, therefore, cell proliferation. Clinical studies systematically demonstrate poor outcomes in children with BSG. Nevertheless, we sought to investigate whether MRI features could be correlated with survival.
Our series demonstrated the classic MRI appearance of BSG on standard MRI with T1 hypointensity and T2 hyperintensity within the tumor, with necrosis present in 22% of cases. Sixty-two percent of patients showed evidence of enhancement at baseline; however, the median volume of enhancement was small, which concurs with previous reports of minimal enhancement in these tumors.8
RT and drug effect
Diffuse BSGs constitute 80% of all cases of BSG and are almost uniformly fatal.9 RT often improves neurologic symptoms and signs and is often associated with transient radiological response.4,10 We have documented the apparent tumor volume-reducing effects of RT and molecular targeting agents based on FLAIR imaging.
Diffusion imaging sequences use strong magnetic field gradients that create images dependent on the diffusion of water in tissue—a technique that serves as an important imaging marker for tissue characterization, tumor cellularity, tumor grading, and tumor response.11,12 In BSG, baseline ADC values are increased. In the study by Chen et al,13 it was confirmed that the ADC values were higher in untreated BSGs than normal brainstems but were lower than in tumors, such as pilocytic astrocytoma. Increased ADC values were thought to be secondary to a larger extracellular volume, possibly arising from a combination of vasogenic edema and a lower number of tumor cells.13 This finding is in stark contrast to tumors such as medulloblastoma or lymphoma, which have lower ADC values due to a decrease in extracellular volume and increased cellularity.13,14 There is likely heterogeneity in cell density and extracellular edema in patients with BSG, an area of study that will require further investigation.
BSG diffusion characteristics differed appreciably when comparing pre-RT with post-RT imaging findings, with serial decreases in ADC values consistent with a decrease in extracellular volume. Serial imaging showed a significant reduction in tumor size as well as a decrease in diffusion within the tumor during and immediately following initial RT and drug treatment, as has been seen in other studies.13,15-17 However, pretreatment diffusion values at baseline had no association with survival in our large prospective study, differing from the report of Chen et al.13 in which lower ADC values at baseline correlated with worse outcome.13
The effects of irradiation on the brain are well described in the literature.18 Initial radiation effects are mediated through direct vascular effects on the endothelium and through cytokine activation, with attendant edema and disruption of the blood-brain barrier. Doses delivered within the therapeutic range result in progressive, diffuse changes in white matter as part of a continuous, dynamic series of events, including direct and indirect effects on glial and neuronal elements as well as on small vessels.18,19
Increasing ADC values are usually noted with successful treatment of adult brain tumors.11,20,21,22 The findings in this study differ from those in reports involving adults with supratentorial high-grade gliomas, for whom intratumoral ADC values were significantly higher in patients immediately after irradiation than at the time of tumor recurrence.23 Early decreases in ADC have been described after therapy in adults—possibly secondary to cellular swelling, decreased blood flow, and early apoptosis,14 which may explain the initial findings after RT and drug therapy in this cohort. A better understanding of the tumor milieu in pediatric BSG is needed, however, to understand these ADC changes over time and to understand the role of edema in these tumors.
Associations of MRI variables with survival
In our study, patients with larger tumors before irradiation had longer durations of PFS. Although this is not intuitive, it is conceivable (given the infiltrating nature of brainstem gliomas demonstrated on autopsy studies) that these tumors grew more slowly to their larger size before clinical detection, suggesting a lower grade or less aggressive neoplasm. It is unknown in our study whether the group of patients with larger tumors had a longer duration of symptoms, because this information was not prospectively collected. In one recent study, Ueoka et al.24 found that patients with a shorter duration of symptoms had a worse prognosis, implying a more aggressive tumor. It is unclear whether there are differences in tumor biology between the larger tumors and those with smaller, apparently more aggressive lesions. Limitations regarding the histology and biology of these tumors without biopsy material preclude further knowledge in this regard.
Patients who had a ≥ 25% decrease in tumor volume and diffusion after RT did better than patients without this decrease. For example, those with a ≥25% decline had a 6-month survival rate of 70%; in contrast, those who experienced a decrease of <25% had a 6-month survival of a mere 20%. This is an observation which has also been noted in a smaller series of 9 children with BSG; Chen et al.13 observed that there was a tendency toward longer durations of survival in patients with a more substantial decrease in tumor ADC values after RT.
In our study, tumor enhancement at baseline and over time was associated with poor PFS and OS. Other BSG studies have suggested that enhancement is not associated with survival.24,25 However, in our study, analysis of this subgroup of patients revealed lower diffusion values in the tumors, reflecting increased tumor cellularity in this subgroup. Baseline enhancement and increased enhancement over time in these lesions may be a marker of more aggressive biologic behavior. In this subgroup, the patients with enhancement had a smaller decrease in actual median diffusion values and a smaller percentage decrease in diffusion values after RT, likely reflecting decreased responsiveness to radiochemotherapy.
The current series shows no association between perfusion tumor values and survival; the presence or absence of enhancement was not associated with tumor perfusion values in BSG. On the other hand, T2* perfusion has been used to evaluate supratentorial high-grade astrocytomas in children,26,27 typically showing increased perfusion in solid portions of the tumor. Higher tumor MR perfusion values have also been associated with progressive disease in children with brain tumors.28 There have been few reports in the literature evaluating perfusion in pediatric BSG. Turner et al.29 reported that perfusion values increased in a patient with progressive BSG from a baseline value of 1.19 to 2.81 at the time of progressive disease. In adults, increased tumor perfusion values have been associated with tumor grade;30,31 such associations could not be made in this study, because the pathologic grade could not known without biopsy. The discrepancy between enhancement and perfusion values in this sizable prospective series was not anticipated. Given the size of the series and the data acquired after processing, we do not believe the data represent a technical artifact. The data do rely, however, on T2* perfusion techniques in the brainstem adjacent to the skull base and may be associated with susceptibility effects and lower spatial resolution. Additional study of patients with BSG using dynamic contrast-enhanced T1 permeability techniques may be of interest in future BSG trials.
Conclusions
The data from this study support the following hypotheses: (1) treatment of BSG is associated with decreased tumor volume and ADC values, which may hypothetically be secondary to decreased extracellular volume, cellular swelling, and early cell death; (2) larger tumors correlate with relatively “better” PFS and OS and greater decreases in tumor volume and ADC values after RT; (3) tumor enhancement at baseline and over time is associated with decreased survival, and in the subgroup with enhancement, tumors have increased cellularity, lower diffusion values, and lower decreases in ADC values after RT; and (4) the more substantial response to therapy (as measured by a decrease in tumor volume and diffusion values), the more likely the patient is to have relatively longer PFS and OS—a significant observation that may represent a valid imaging-based surrogate for outcome or change in intervention if confirmed in future prospective trials.
Incorporation of advanced imaging in subsequent BSG trials is important to further our understanding of imaging-biology-histology correlations as additional information from selected series provides histologic and biologic data from biopsies and autopsies.32,33
Conflict of interest statement. None declared.
Funding
National Institute of Health (U01 CA81457); The Pediatric Brain Tumor Consortium Foundation; The Pediatric Brain Tumor Foundation of the United States; and American Lebanese Syrian Associated Charities.
Acknowledgments
We acknowledge Sarah Ng for helping with volumetric analyses in this study. We acknowledge the PBTC site neuroradiologists including Dr. Charles Fitz and Dr. Ashok Panigrahy (Children's Hospital of Pittsburgh); Dr. Jill Hunter (Texas Children's Hospital); Dr. James Provenzale (Duke University); Dr. Dennis Shaw (Seattle Children's Hospital); Dr. Francine Kim (Children's Memorial); and Dr. Nicholas Patronas (NIH). We acknowledge Nancy Drinan for editorial assistance and Cynthia Dubé for manuscript preparation.
References
- 1.Jennings MT, Freeman ML, Murray MJ. Strategies in the treatment of diffuse pontine gliomas: the therapeutic role of hyperfractionated radiotherapy and chemotherapy. J Neurooncol. 1996;28:207–222. doi: 10.1007/BF00250200. [DOI] [PubMed] [Google Scholar]
- 2.Central Brain Tumor Registry of the United States. Statistical Report: Primary Brain Tumors in the United States, 2000–2004. Central Brain Tumor Registry of the United States, Hinsdale, IL 2008. [Google Scholar]
- 3.Albright AL, Packer RJ, Zimmerman R, Rorke LB, Boyett J, Hammond GD. Magnetic resonance scans should replace biopsies for the diagnosis of diffuse brain stem gliomas: a report from the Children's Cancer Group. Neurosurgery. 1993;33:1026–1029. doi: 10.1227/00006123-199312000-00010. discussion 1029–1030. [DOI] [PubMed] [Google Scholar]
- 4.Packer RJ, Boyett JM, Zimmerman RA, et al. Hyperfractionated radiation therapy (72 Gy) for children with brain stem gliomas. A Childrens Cancer Group Phase I/II Trial. Cancer. 1993;72:1414–1421. doi: 10.1002/1097-0142(19930815)72:4<1414::aid-cncr2820720442>3.0.co;2-c. [DOI] [PubMed] [Google Scholar]
- 5.Poussaint TY, Phillips PC, Vajapeyam S, et al. The Neuroimaging Center of the Pediatric Brain Tumor Consortium-collaborative neuroimaging in pediatric brain tumor research: a work in progress. AJNR Am J Neuroradiol. 2007;28:603–607. [PMC free article] [PubMed] [Google Scholar]
- 6.Sorensen AG, Patel S, Harmath C, et al. Comparison of diameter and perimeter methods for tumor volume calculation. J Clin Oncol. 2001;19:551–557. doi: 10.1200/JCO.2001.19.2.551. [DOI] [PubMed] [Google Scholar]
- 7.Ostergaard L, Sorensen AG, Chesler DA, et al. Combined diffusion-weighted and perfusion-weighted flow heterogeneity magnetic resonance imaging in acute stroke. Stroke. 2000;31:1097–1103. doi: 10.1161/01.str.31.5.1097. [DOI] [PubMed] [Google Scholar]
- 8.Fischbein N, Prados M, Wara W, Russo C, Edwards M, Barkovich A. Radiologic classification of brain stem tumors: correlation of magnetic resonance imaging appearance with clinical outcome. Pediatr Neurosurg. 1996;24:9–23. doi: 10.1159/000121010. [DOI] [PubMed] [Google Scholar]
- 9.Hargrave D, Bartels U, Bouffet E. Diffuse brainstem glioma in children: critical review of clinical trials. Lancet Oncol. 2006;7:241–248. doi: 10.1016/S1470-2045(06)70615-5. [DOI] [PubMed] [Google Scholar]
- 10.Packer RJ, Littman PA, Sposto RM, et al. Results of a pilot study of hyperfractionated radiation therapy for children with brain stem gliomas. Int J Radiat Oncol Biol Phys. 1987;13:1647–1651. doi: 10.1016/0360-3016(87)90160-x. [DOI] [PubMed] [Google Scholar]
- 11.Chenevert TL, Ross BD. Diffusion imaging for therapy response assessment of brain tumor. Neuroimaging Clin N Am. 2009;19:559–571. doi: 10.1016/j.nic.2009.08.009. [DOI] [PMC free article] [PubMed] [Google Scholar]
- 12.Hamstra DA, Rehemtulla A, Ross BD. Diffusion magnetic resonance imaging: a biomarker for treatment response in oncology. J Clin Oncol. 2007;25:4104–4109. doi: 10.1200/JCO.2007.11.9610. [DOI] [PubMed] [Google Scholar]
- 13.Chen HJ, Panigrahy A, Dhali G, et al. Apparent diffusion and fractional anisotropy of diffuse intrinsic brain stem gliomas. AJNR Am J Neuroradiol. 2010;31:1879–1885. doi: 10.3174/ajnr.A2179. [DOI] [PMC free article] [PubMed] [Google Scholar]
- 14.Padhani AR, Liu G, Koh DM, et al. Diffusion-weighted magnetic resonance imaging as a cancer biomarker: consensus and recommendations. Neoplasia. 2009;11:102–125. doi: 10.1593/neo.81328. [DOI] [PMC free article] [PubMed] [Google Scholar]
- 15.Kaplan AM, Albright AL, Zimmerman RA, et al. Brainstem gliomas in children: a Children's Cancer Group review of 119 cases. Pediatr Neurosurg. 1996;24:185–192. doi: 10.1159/000121036. [DOI] [PubMed] [Google Scholar]
- 16.Packer RJ, Zimmerman RA, Kaplan A, et al. Early cystic/necrotic changes after hyperfractionated radiation therapy in children with brain stem gliomas: data from the Childrens Cancer Group. Cancer. 1993;71:2666–2674. doi: 10.1002/1097-0142(19930415)71:8<2666::aid-cncr2820710836>3.0.co;2-k. [DOI] [PubMed] [Google Scholar]
- 17.Smith RR, Zimmerman RA, Packer RJ, et al. Pediatric brainstem glioma: post-radiation clinical and MR follow-up. Neuroradiology. 1990;32:265–271. doi: 10.1007/BF00593044. [DOI] [PubMed] [Google Scholar]
- 18.Tofilon PJ, Fike JR. The radioresponse of the central nervous system: a dynamic process. Radiat Res. 2000;153:357–370. doi: 10.1667/0033-7587(2000)153[0357:trotcn]2.0.co;2. [DOI] [PubMed] [Google Scholar]
- 19.Coderre JA, Morris GM, Micca PL, et al. Late effects of radiation on the central nervous system: role of vascular endothelial damage and glial stem cell survival. Radiat Res. 2006;166:495–503. doi: 10.1667/RR3597.1. [DOI] [PubMed] [Google Scholar]
- 20.Chenevert TL, Meyer CR, Moffat BA, et al. Diffusion MRI: a new strategy for assessment of cancer therapeutic efficacy. Mol Imaging. 2002;1:336–343. doi: 10.1162/15353500200221482. [DOI] [PubMed] [Google Scholar]
- 21.Chenevert TL, Stegman LD, Taylor JM, et al. Diffusion magnetic resonance imaging: an early surrogate marker of therapeutic efficacy in brain tumors. J Natl Cancer Inst. 2000;92:2029–2036. doi: 10.1093/jnci/92.24.2029. [DOI] [PubMed] [Google Scholar]
- 22.Hamstra DA, Galban CJ, Meyer CR, et al. Functional diffusion map as an early imaging biomarker for high-grade glioma: correlation with conventional radiologic response and overall survival. J Clin Oncol. 2008;26:3387–3394. doi: 10.1200/JCO.2007.15.2363. [DOI] [PMC free article] [PubMed] [Google Scholar]
- 23.Asao C, Korogi Y, Kitajima M, et al. Diffusion-weighted imaging of radiation-induced brain injury for differentiation from tumor recurrence. AJNR Am J Neuroradiol. 2005;26:1455–1460. [PMC free article] [PubMed] [Google Scholar]
- 24.Ueoka DI, Nogueira J, Campos JC, Maranhao-Filho P, Ferman S, Lima MA. Brainstem gliomas—retrospective analysis of 86 patients. J Neurol Sci. 2009;281:20–23. doi: 10.1016/j.jns.2009.03.009. [DOI] [PubMed] [Google Scholar]
- 25.Hargrave D, Chuang N, Bouffet E. Conventional MRI cannot predict survival in childhood diffuse intrinsic pontine glioma. J Neurooncol. 2008;86:313–319. doi: 10.1007/s11060-007-9473-5. [DOI] [PubMed] [Google Scholar]
- 26.Cha S. Dynamic susceptibility-weighted contrast-enhanced perfusion MR imaging in pediatric patients. Neuroimaging Clin N Am. 2006;16:137–147. doi: 10.1016/j.nic.2005.11.006. ix. [DOI] [PubMed] [Google Scholar]
- 27.Chang YW, Yoon HK, Shin HJ, Roh HG, Cho JM. MR imaging of glioblastoma in children: usefulness of diffusion/perfusion-weighted MRI and MR spectroscopy. Pediatr Radiol. 2003;33:836–842. doi: 10.1007/s00247-003-0968-8. [DOI] [PubMed] [Google Scholar]
- 28.Tzika AA, Astrakas LG, Zarifi MK, et al. Spectroscopic and perfusion magnetic resonance imaging predictors of progression in pediatric brain tumors. Cancer. 2004;100:1246–1256. doi: 10.1002/cncr.20096. [DOI] [PubMed] [Google Scholar]
- 29.Turner CD, Chi S, Marcus KJ, et al. Phase II study of thalidomide and radiation in children with newly diagnosed brain stem gliomas and glioblastoma multiforme. J Neurooncol. 2007;82:95–101. doi: 10.1007/s11060-006-9251-9. [DOI] [PubMed] [Google Scholar]
- 30.Aronen HJ, Gazit IE, Louis DN, et al. Cerebral blood volume maps of gliomas: comparison with tumor grade and histologic findings. Radiology. 1994;191:41–51. doi: 10.1148/radiology.191.1.8134596. [DOI] [PubMed] [Google Scholar]
- 31.Law M, Oh S, Babb JS, et al. Low-grade gliomas: dynamic susceptibility-weighted contrast-enhanced perfusion MR imaging–prediction of patient clinical response. Radiology. 2006;238:658–667. doi: 10.1148/radiol.2382042180. [DOI] [PubMed] [Google Scholar]
- 32.Leach PA, Estlin EJ, Coope DJ, et al. Diffuse brainstem gliomas in children: should we or shouldn't we biopsy? Br J Neurosurg. 2008;22:619–624. doi: 10.1080/02688690802366198. [DOI] [PubMed] [Google Scholar]
- 33.Roujeau T, Machado G, Garnett MR, et al. Stereotactic biopsy of diffuse pontine lesions in children. J Neurosurg. 2007;107(1 Suppl):1–4. doi: 10.3171/PED-07/07/001. [DOI] [PubMed] [Google Scholar]


