Abstract
Although the effects of bevacizumab on magnetic resonance images (MRIs) of recurrent glioblastoma multiforme (GBM) are well documented, to our knowledge, no studies have explicitly quantified the volumetric changes resulting from initial treatment, nor have there been studies examining the ability for volumetric changes in conventional MRI to predict progression-free survival (PFS) and overall survival (OS). In the current study, we retrospectively examined volumetric changes on conventional MRI scans in 84 patients with recurrent GBM. MRIs were obtained before (mean, 11 days) and after (mean, 42 days) treatment with bevacizumab. The volume of abnormal fluid-attenuated inversion recovery (FLAIR) signal intensity, the volume of contrast enhancement, and the ratio of the 2 were quantified for each patient before and after initial treatment. Results demonstrated that initial treatment with bevacizumab resulted in a significant decrease in both the volume of abnormal FLAIR signal and the volume of contrast enhancement. Initial, residual, and change in FLAIR volume were not predictive of PFS or OS. Initial contrast-enhancing volume was predictive of PFS but not OS. The pretreatment relative nonenhancing tumor ratio, defined as the ratio of FLAIR to contrast-enhancing volume, was found to be predictive of both PFS and OS.
Keywords: MRI, glioblastoma, bevacizumab, volumetric analysis
Glioblastoma multiforme (GBM) is the most common and most aggressive type of primary brain tumor and carries a particularly poor prognosis. In GBM, vascular endothelial growth factor (VEGF) is typically overexpressed, leading to increased vascular permeability and tumor angiogenesis.1,2 Bevacizumab, a monoclonal antibody to VEGF,3 is now a common second-line treatment option for patients with GBM for whom the standard of care (ie, resection, radiotherapy, and temozolomide chemotherapy) has failed, as a result of a progression-free survival (PFS) benefit shown in clinical trials,4–6 compared with historic controls.7 The anti-permeability effect of bevacizumab treatment makes it difficult to assess tumor response on the basis of only enhancing areas, because nonenhancing tumor is common following bevacizumab treatment. To overcome these challenges, new criteria for tumor response was created that include additional consideration of T2-weighted or fluid-attenuated inversion recovery (FLAIR) signal changes as evidence of tumor burden.8 Although these criteria are thought to help determine when tumor recurrence occurs, the ability for early changes in contrast enhancement and/or FLAIR signal changes to predict patient survival after anti-angiogenic therapy has, to our knowledge, not been previously explored.
To date, to our knowledge, no studies have quantified the changes in tumor volume on conventional MRI before and after bevacizumab therapy in a large cohort of patients with recurrent GBM. Therefore, the objective of the current study was to quantify the change in contrast-enhancing and FLAIR signal volume before and after treatment with bevacizumab and to determine whether these early changes were predictive of PFS or overall survival (OS). Additionally, we aimed to test whether the ratio of FLAIR volume to contrast-enhancing volume, termed the relative nonenhancing tumor ratio (rNTR),9 was a significant predictor of PFS and/or OS.
Materials and Methods
Patients
All patients participating in this study signed institutional review board-approved informed consent to have their imaging data stored as part of our institution's neuro-oncology database. Data acquisition was performed in compliance with all applicable Health Insurance Portability and Accountability Act (HIPAA) regulations. The study spanned the period from August 11, 2005 to August 31, 2010. Patients were retrospectively selected from our institution's neuro-oncology database. A total of 84 patients who met the following criteria were selected: (1) patients had pathology-confirmed GBM, with recurrence based on MRI and clinical data; (2) patients were regularly treated every 2 weeks per cycle with bevacizumab (Avastin; Genentech; 5 or 10 mg/kg body weight), alone or in combination with chemotherapy (ie, carboplatin, irinotecan, etoposide, and lomustine); and (3) baseline (before bevacizumab treatment) and minimum of 1 follow-up MRI scan after treatment (after bevacizumab treatment) were available. Baseline scans were obtained ∼1 week before treatment (mean ± standard error of the mean, 11 ± 1.6 days). Follow-up scans were obtained at 4–6-week intervals (mean ± standard error of the mean, 42 ± 3.5 days). At the time of last assessment (August, 2010), 78 of 84 patients had progressed, and 66 of 84 patients had died. For bevacizumab-treated patients, 33 patients were receiving steroids at the time of initial imaging (dexamethasone dose range, 0.25–24 mg), and 51 patients were not receiving steroids. Of the 33 patients receiving steroids, 18 patients had no change in dose between the MRI scans examined, 10 patients had a decrease in steroid dose, and 5 patients had an increase in steroid dose. A total of 10 patients were treated at first recurrence, 9 at second recurrence, and 7 at third or more recurrence. All patients were treated with radiation therapy (typically 6000 cGy) and maximal tumor resection at time of initial tumor presentation.
MRI
Data were collected on a 1.5T MR system (General Electric Medical Systems) using pulse sequences supplied by the scanner manufacturer. Standard anatomical MRI sequences included axial T1 weighted (TE/TR = 15 ms/400 ms; slice thickness = 5 mm, with 1-mm interslice distance; number of excitations [NEX] = 2; matrix size = 256 ×256; and field-of-view [FOV] = 24 cm), proton density–weighted images (TE/TR = 9.6-16 ms/4000 ms; slice thickness = 5 mm, with 1-mm interslice distance; NEX = 2; matrix size = 256 ×256; and FOV = 24cm), T2-weighted fast spin-echo (TE/TR = 126-130 ms/4000 ms; slice thickness = 5 mm, with 1-mm interslice distance; NEX = 2; matrix size = 256 ×256; and FOV = 24 cm), and FLAIR images (TI = 2200 ms; TE/TR = 120 ms/4000 ms; slice thickness = 5 mm, with 1-mm interslice distance; NEX = 2; matrix size = 256 ×256; and FOV = 24 cm). Additionally, gadopentetate dimeglumine–enhanced (Magnevist; Berlex; 0.1 mmol/kg) axial and coronal T1-weighted images (coronal, TE/TR = 15 ms/400 ms; slice thickness =3 mm, with 1-mm interslice distance; NEX = 2; matrix size =256 ×256; and FOV = 24 cm) were acquired immediately after contrast injection.
Definition of disease progression
Disease progression was defined by a modified criteria of Macdonald et al.,8 indicated by a 25% increase in enhancing tumor, as well as a modification to this criteria that includes progression of a nonenhancing tumor evident by increased mass effect and/or architectural distortion, such as blurring of the gray-white interface10 noted by a board-certified neuroradiologist (W.B.P.), who was blinded from the results of the volumetric analysis. Both PFS and OS were with respect to the posttreatment MRI scan date.
Region of interest (ROI) determination
In the current study, we examined the volume of tissue in regions of T2 or T2-weighted FLAIR signal abnormality (“FLAIR”) and areas of contrast enhancement on T1-weighted images (“T1 + C”). The regions of FLAIR abnormality were chosen on the basis of Response Assessment in Neuro-Oncology (RANO) recommendations, the observation that tumor infiltration into normal brain parenchyma typically results in an increase in T2-weighted/FLAIR signal,11–14 and multiple investigations suggesting that T2 signal abnormalities should be routinely used to visualize the extent of malignant infiltrating tumor.15–19 The regions of T1 + C were defined on post-contrast T1-weighted images, excluding any T1 shortening from blood products on pre-contrast T1-weighted images and any central necrosis (hypointense on T1 + C). The volume of FLAIR and T1 + C were calculated before and after the first treatment with bevacizumab using a semi-automated procedure consisting of (1) manually defining the relative region of tumor occurrence, (2) thresholding either the FLAIR or T1 + C images within these regions using an empirical threshold combined with a region-growing algorithm, and then (3) manually editing the resulting masks to exclude any obvious radiation-induced changes or leukoaraiosis. ROIs were completed using custom scripts in AFNI software (Analysis of Functional NeuroImages; http://afni.nimh.nih.gov/afni). Image volume was computed by multiplying the in-plane resolution by the slice thickness. The volume of tumor regions assumed to span the interslice gap was calculated by multiplying the average of the superior and inferior slice in-plane cross-sectional areas by the interslice gap. The investigator who performed the volumetric analysis (B.M.E.) was blinded to the survival results until completion of the study.
Hypothesis testing
We hypothesized that a significant reduction of vasogenic edema leading to a decrease in both abnormal FLAIR signal volume and volume of contrast-enhancement.4,9,20,21 To test this hypothesis, we performed a nonparametric, paired Wilcoxon signed rank test on the volume of both FLAIR and T1 + C volumes, before and after treatment.
We then explored whether the initial or residual volumes of FLAIR or T1 + C, as well as the associated percent change in volume, were significant predictors of PFS or OS, which are common clinical end points. Additionally, we examined whether the pretreatment rNTR, defined by Norden et al.9 as the volume of FLAIR divided by the volume of T1 + C in the setting of tumor recurrence, was predictive of PFS or OS. Survival analysis was performed using log-rank statistical analysis on Kaplan-Meier data. All statistical tests were performed using GraphPad Prism, version 4.0.
Results
Bevacizumab significantly reduces FLAIR and T1 + C volume
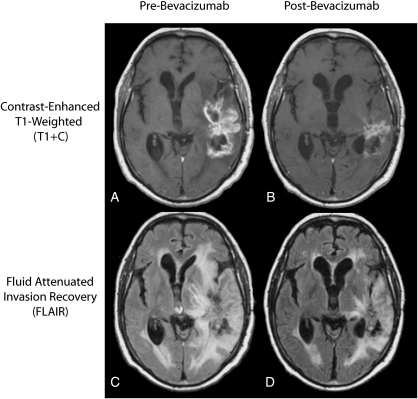
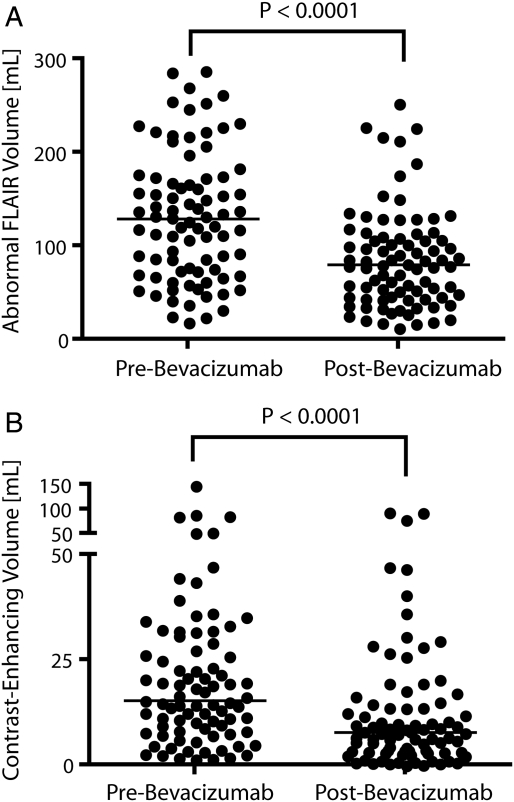
As illustrated in Figure 1, most patients treated with bevacizumab experienced a drastic reduction in both contrast-enhancement on T1-weighted images and vasogenic edema on FLAIR images at the first follow-up time-point. Approximately 77% of patients (65 of 84) exhibited >5% reduction in the volume of abnormal FLAIR signal intensity. Similarly, ∼79% of patients (66 of 84) had >5% reduction in the volume of contrast-enhancement. The vast majority of patients (76 [90%] of 84 patients) had either a response on FLAIR or post-contrast T1-weighted images. Our results are consistent with the hypothesis that bevacizumab significantly reduces the volume of FLAIR (P < .0001, by Wilcoxon signed-rank test) (Figure 2A) and the volume of contrast-enhancement (P < .0001, by Wilcoxon signed-rank test) (Figure 2B) at the first follow-up time-point.
Fig. 1.
Typical change in standard MR images of glioblastoma multiforme after treatment with bevacizumab. (A) Pretreatment contrast-enhanced T1-weighted image. (B) Post-treatment contrast–enhanced T1-weighted image showing a decrease in extent of contrast-enhancement. (C) Pretreatment fluid-attenuated inversion recovery (FLAIR) image. (D) Posttreatment FLAIR image showing reduction of vasogenic edema relative to pre-treatment FLAIR images.
Fig. 2.
Volumetric analysis of fluid-attenuated inversion recovery (FLAIR) and contrast-enhanced MRI before and after bevacizumab treatment. (A) Pretreatment abnormal FLAIR volume. (B) Posttreatment abnormal FLAIR volume. (C) Pretreatment contrast-enhancing volume. (D) Posttreatment contrast-enhancing volume. Results show significant reduction in both FLAIR and contrast-enhancement after bevacizumab therapy (P < .0001, by Wilcoxon signed rank test).
FLAIR is not predictive of PFS or OS
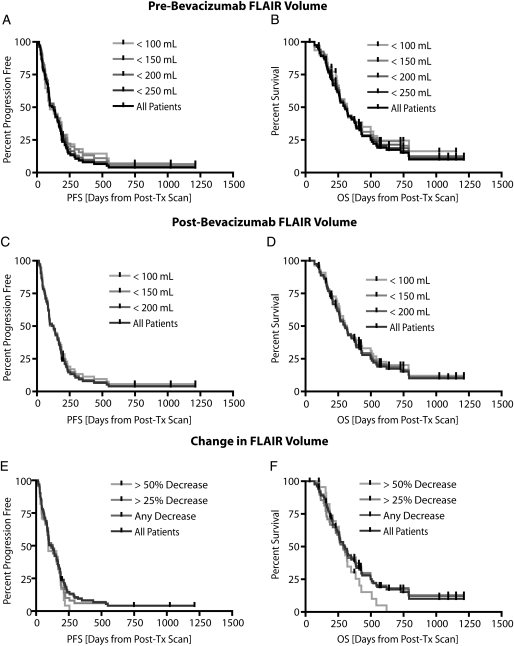
Although a lower pretreatment abnormal FLAIR volume seemed to slightly increase PFS and OS according to Figure 3A and 3B, no statistically significant correlation was observed between FLAIR volume and survival (P = .3102 and P = .3599, by log-rank test for trends, for PFS and OS, respectively). Similarly, we observed no statistically significant correlation between the posttreatment abnormal FLAIR volume and PFS or OS (P = .5825 and P = .5714, by log-rank test for trends, for PFS and OS, respectively) (Figure 3C and 3D). Despite illustrating a significant reduction in FLAIR volume at the first follow-up, this reduction was not predictive of PFS or OS (P = .2822 and P = .4664, by log-rank test for trends, for PFS and OS, respectively) (Figure 3E and 3F). We also attempted to stratify patients on the basis of median pretreatment FLAIR volume of 129 mL, but results did not show significant differences in PFS (P = .0.1632, by log-rank test) or OS (P = .2398, by log-rank test). Similarly, the median posttreatment FLAIR volume (80 mL) did not show differences in PFS (P = .8323, by log-rank test) or OS (P = .9903, by log-rank test). A reduction in FLAIR volume greater than or less than 50% also did not show statistically significant differences in PFS (P = .1239, by log-rank test) or OS (P = .1093, by log-rank test). In summary, our results suggest neither the pretreatment, posttreatment, nor change in FLAIR volume was predictive of PFS or OS.
Fig. 3.
Pretreatment fluid-attenuated inversion recovery (FLAIR) volume, posttreatment FLAIR volume, and change in FLAIR volume versus progression-free survival (PFS) and overall survival (OS) in recurrent glioblastoma multiforme treated with bevacizumab. (A) PFS for pretreatment FLAIR volumes ranging from 100 mL to 250 mL showing no significant trends (P = .3102, by log-rank test for trends). (B) OS for pretreatment FLAIR volumes ranging from 100 mL to 250 mL showing no significant trends (P = .3599, by log-rank test for trends). (C) PFS for posttreatment FLAIR volumes ranging from 100 mL to 200 mL showing no significant trends (P = .5825, by log-rank test for trends). (D) OS for posttreatment FLAIR volumes ranging from 100 mL to 200 mL showing no statistically significant trends (P = .5714, by log-rank test for trends). (E) Patients showing a change in FLAIR volume more than 25% and 50% were not predictive of PFS (P = .2822, by log-rank test for trends). (F) Patients having a change in FLAIR volume more than 25% and 50% were also not predictive of OS (P = .4664, by log-rank test for trends). Post-Tx, post-treatment.
T1 + C volume is predictive of PFS
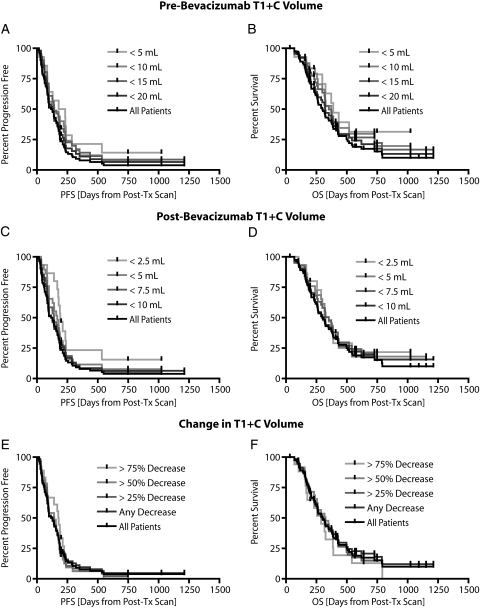
Next, we examined whether the pretreatment or posttreatment volume of contrast enhancement or the change in contrast enhancement was predictive of PFS or OS. Our results suggest a significant correlation between the pretreatment T1 + C volume and PFS (P = .0309, by the log-rank test for trends) (Figure 4A); however, no significant correlation was found between the pretreatment T1 + C volume and OS (P = .0601, by the log-rank test for trends) (Figure 4B). Specifically, patients who had a pretreatment T1 + C volume less than the median of 15.2 mL were statistically more likely to progress later than were patients who had pretreatment T1 + C volume more than 15.2 mL (P = .0063, by the log-rank test). No difference in OS was observed between these 2 groups (P = .0654, by the log-rank test).
Fig. 4.
Pretreatment contrast-enhancing volume, posttreatment contrast-enhancing volume, and change in contrast-enhancing volume versus progression-free survival (PFS) and overall survival (OS). (A) Pretreatment contrast-enhancing volumes ranging from 5mL to 20mL showing a significant trend with respect to PFS (P = .0309, by log-rank test for trends). (B) Pretreatment contrast-enhancing volumes ranging from 5 mL to 20 mL not showing any trends with respect to OS (P = .0601, by log-rank test for trends). (C) Posttreatment contrast-enhancing volumes ranging from 2.5 mL to 10 mL showing a significant trend with respect to PFS (P = .0225, by log-rank test for trends). (D) Posttreatment contrast-enhancing volumes ranging from 2.5 mL to 10 mL not showing significant trends with respect to OS (P = .3422, by log-rank test for trends). (E) No trends in PFS for decrease in contrast-enhancing volumes of 25%, 50%, and 75% were observed (P = .7426, by log-rank test for trends). (F) No trends in OS for decrease in contrast-enhancing volumes of 25%, 50%, and 75% were observed (P = .6202, by log-rank test for trends).
Similar to pretreatment results, we observed a significant correlation between the posttreatment T1 + C volume and PFS (P = .0225, by the log-rank test for trends) (Figure 4C), but not OS (P = .3422, by the log-rank test for trends) (Figure 4D). Patients who had a posttreatment T1 + C volume less than the median of 7.7 mL, however, were not more likely to progress later than patients who had a posttreatment T1 + C volume >7.7 mL (P = .0762, by the log-rank test). Again, no difference in OS was observed between these populations (P = .1700, by the log-rank test). No trend was observed between the change in T1 + C volume and PFS (P = .7426, by the log-rank test for trends) (Figure 4E) or OS (P = .6202, by the log-rank test for trends) (Figure 4F), suggesting the degree of reduction in contrast-enhancing volume is not a significant predictor of patient survival. In summary, our results suggest the pretreatment volume of contrast enhancement may be a predictor of PFS, but not OS, in recurrent GBM treated with bevacizumab.
Pretreatment rNTR is predictive of PFS and OS
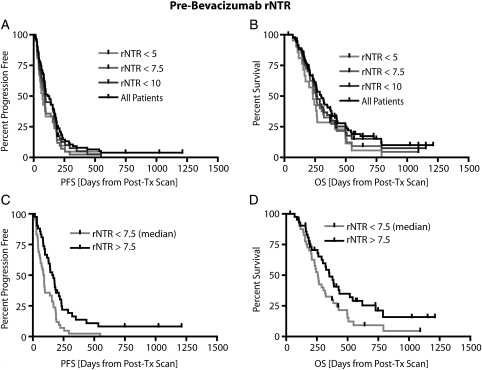
Finally, we examined the ability for the rNTR to predict PFS and OS. The rNTR was first proposed by Norden et al.9 as a method to quantify the large amount of nonenhancing tumor burden at tumor recurrence, but has not been examined at the start of treatment as a predictor of survival. A significantly different PFS was detected between patients who had a rNTR larger than the median pretreatment rNTR of 7.5 and patients who had a lower rNTR (P = .0023, by the log-rank test) (Figure 5C). Median PFS was 88 days for patients with an rNTR ≥7.5, compared with 162.5 days for patients with an rNTR ≤7.5. This threshold of rNTR also significantly stratified long and short OS (P = .0440, by the log-rank test) (Figure 5D). Median OS was 260 days for patients with an rNTR <7.5 and 352 days for patients with an rNTR >7.5. Posttreatment rNTR was not predictive of either PFS or OS (P = .8469 and P = .7949, by the log-rank test for trends, for PFS and OS, respectively). In summary, results suggest pretreatment rNTR is a valuable predictor of both PFS and OS in patients with recurrent GBM who are treated with bevacizumab.
Fig. 5.
Relationship between pretreatment relative non-enhancing tumor ratio (rNTR) and patient survival. (A) No significant trends observed between pre-treatment rNTR ranging from 5 to 10 and progression-free survival (PFS; P = .0577, by log-rank test for trends). (B) Similarly, no significant trends were observed between pretreatment rNTR ranging from 5 to 10 and overall survival (OS; P = .0762, by log-rank test for trends). (C) Patient stratification based on median rNTR (7.5) showing significant differences in PFS (P = .0023, by log-rank test). (D) Patient stratification based on median rNTR (7.5) also showed a significant difference in OS (P = .0440, by log-rank test).
Discussion
Current response measures of drug treatment effect for GBM use bidimensional measurements of enhancing tumor (eg, the criteria of Macdonald et al.8) and changes in FLAIR signal intensity as evidence of tumor progression and regression (ie, the RANO criteria22). The relationship between these biomarkers assessed at early time points following anti-angiogenic therapy and standard outcome measures of PFS and OS remains uncertain. Additionally, the potential value of volumetric tumor burden assessment in the setting of VEGF blockade is unknown. Therefore, we sought to analyze enhancing tissue and FLAIR volumes, as well as their ratio, in baseline and first follow-up MRI, for patients with recurrent GBM treated with bevacizumab to determine whether these measures were predictive of PFS and/or OS.
As expected, bevacizumab treatment significantly reduced both FLAIR and contrast-enhancement at first follow-up, with >75% of patients demonstrating a reduction in FLAIR and/or enhancing volumes by at least 5%. It has been suggested that the anti-permeability effect of bevacizumab treatment occurs rapidly (hours to weeks), but is not tightly coupled to the potential anti-tumor effect of this drug. This is supported by our data showing that the reduction in volume of FLAIR signal change, potentially due to edema resorption following treatment, was not predictive of PFS or OS.
Similarly, change in enhancing tumor volume following bevacizumab treatment did not predict outcome. Despite a similar response frequency, our results directly conflict with results shown in previous phase II studies using bidirectional measurements via Levin and Macdonald criteria23 that suggested these response criterion were predictive of PFS. However, our study had nearly twice the patients and used more accurate, volumetric estimates of change in tumor enhancement, thus we are confident in our results illustrating that the change in contrast-enhancing volume is not predictive of PFS or OS. The lack of prediction found in our study could be explained by the generalized anti-permeability effect of bevacizumab reducing gadolinium diffusion into the interstitium, thereby reducing contrast enhancement, which may be independent of the potential cytostatic effect of bevacizumab thought to result in prolonged PFS. In contrast to the change in volume, we did find initial and residual enhancing volume were significant predictors of time to progression. More specifically, we found that patients with larger enhancing tumor volumes, either before or after treatment, tended to have shorter times to progression; however, these patients did not necessarily have a shorter OS. Thus, our results suggest a reduced vascular permeability may be independent of subsequent sustained anti-tumor effects of this treatment paradigm.
We also examined the relationship between the ratio of abnormal FLAIR signal and enhancing tissue volume, termed the rNTR, with regard to PFS and OS. This ratio was first proposed by Norden et al9 as a method to assess nonenhancing tumor burden at recurrence, but it has not been examined at the start of treatment as a possible predictor of outcome. Using a cut-off of 7.5 (the median rNTR), we found that patients with a high rNTR measured prior to treatment had significantly longer PFS and OS. In fact, patients with a high rNTR had nearly twice the PFS than did those with a low rNTR, and the OS was > 3 months longer in the high-rNTR group. The reason for this observation is not clear. Tumors with high rNTR are likely to have more edema (resulting in large FLAIR volumes relative to contrast enhancing volumes), compared with low-rNTR tumors. Because VEGF is known to increase vascular permeability, high-rNTR tumors may secrete higher levels of VEGF, which is the target of bevacizumab. Therefore, patients with high-rNTR tumors may be better candidates for bevacizumab treatment. This hypothesis, however, is merely speculation and requires confirmation by histopathologic analysis of VEGF levels from tumor samples.
Neither change in rNTR nor posttreatment (first follow-up) rNTR was predictive of OS, similar to the findings for FLAIR and enhancing tumor volume when analyzed separately. The observation that changes, even when measured volumetrically, do not correlate with outcomes reinforces the challenges associated with response markers for patients treated with anti-angiogenic therapy. Although bevacizumab therapy results in a significant change in permeability measured by change in FLAIR, by enhancing volume, or by direct change in measured gadolinium permeability using dynamic contrast enhanced MRI,24 these permeability changes are not sufficient predictors of patient survival. This emphasizes the observation that better markers of tumor burden in this treatment paradigm are greatly needed. However, it may be the case that, although tumor regression is not predictive of outcome, volumetric assessment of tumor growth by either enhancing tissue or FLAIR signal change may add value to standard bidimensional measurements, particularly in later follow-up scans in which change is likely less a manifestation of permeability effects than true change in tumor burden.
There is some precedent in the literature for predictive biomarkers of bevacizumab response in recurrent glioblastoma beyond the use of conventional MR techniques. For instance, Pope et al.25 found that by using diffusion MRI, apparent diffusion coefficient histograms in contrast-enhancing regions prior to treatment could predict PFS in recurrent glioblastoma treated with bevacizumab. Functional diffusion mapping26 has also demonstrated the predictability of early changes in apparent diffusion coefficient to OS. Positron emission tomography tracers,27 dynamic susceptibility contrast MRI,28 and other advanced imaging techniques have also shown promise in predicting response to bevacizumab. However, to our knowledge, this is the first study explicitly examining volumetric analysis of standard MRI sequences as a predictor of outcome. The extent to which more advanced imaging techniques could be combined with standard MRI techniques to provide better prediction of response is not known.
Limitations to current study
Although the volumetric analysis used in the current study to estimate tumor volumes was thought to be a better estimate of tumor burden compared to bi-directional measurements, partial volume contamination and rather large slice thickness likely contributed to errors in volume estimation. Additionally, we estimated contrast-enhancing volume that excluded any central necrotic areas, which is different from bi-directional measurements that may include these necrotic areas as part of the tumor burden. This likely contributed to some differences in observations from other studies, namely the phase II studies using the Levin and Macdonald criteria.23
In summary, the purpose of the current study was to quantitatively determine the change in abnormal FLAIR volume and contrast-enhancing volume in recurrent GBM after treatment with bevacizumab. Results suggest that FLAIR volume was not predictive of PFS or OS, contrast-enhancing volume was predictive of PFS, and rNTR was predictive of both PFS and OS in recurrent GBM treated with bevacizumab.
Conflicts of interest statement. None declared.
Funding
Brain Tumor Funders Collaborative (WBP); Art of the Brain (TFC); Ziering Family Foundation in memory of Sigi Ziering (TFC); Singleton Family Foundation (TFC); Clarence Klein Fund for Neuro-Oncology (TFC).
References
- 1.Plate KH, Breier G, Risau W. Molecular mechanisms of developmental and tumor angiogenesis. Brain Pathol. 1994;4(3):207–218. doi: 10.1111/j.1750-3639.1994.tb00835.x. [DOI] [PubMed] [Google Scholar]
- 2.Holash J, Maisonpierre PC, Compton D, et al. Vessel cooption, regression, and growth in tumors mediated by angiopoietins and VEGF. Science. 1999;284(5422):1994–1998. doi: 10.1126/science.284.5422.1994. [DOI] [PubMed] [Google Scholar]
- 3.Duda DG, Batchelor TT, Willett CG, Jain RK. VEGF-targeted cancer therapy strategies: current progress, hurdles and future prospects. Trends Mol Med. 2007;13(6):223–230. doi: 10.1016/j.molmed.2007.04.001. [DOI] [PMC free article] [PubMed] [Google Scholar]
- 4.Nghiemphu PL, Liu W, Lee Y, et al. Bevacizumab and chemotherapy for recurrent glioblastoma: a single-institution experience. Neurology. 2009;72(14):1217–1222. doi: 10.1212/01.wnl.0000345668.03039.90. [DOI] [PMC free article] [PubMed] [Google Scholar]
- 5.Vredenburgh JJ, Desjardins A, Herndon JE, et al. Phase II trial of bevacizumab and irinotecan in recurrent malignant glioma. Clin Cancer Res. 2007;13(1253–9) doi: 10.1158/1078-0432.CCR-06-2309. [DOI] [PubMed] [Google Scholar]
- 6.Friedman AH, Prados MD, Wen PY, et al. Bevacizumab alone and in combination with irinotecan in recurrent glioblastoma. J Clin Oncol. 2009;27(28):4733–4740. doi: 10.1200/JCO.2008.19.8721. [DOI] [PubMed] [Google Scholar]
- 7.Stupp R, Mason WP, van den Bent MJ, et al. Radiotherapy plus concomitant and adjuvent temozolomide for glioblastoma. N Engl J Med. 2005;352(10):987–996. doi: 10.1056/NEJMoa043330. [DOI] [PubMed] [Google Scholar]
- 8.Macdonald DR, Cascino TL, Schold SC, Jr, Cairncross JG. Response criteria for phase II studies of supratentorial malignant glioma. J Clin Oncol. 1990;8(7):1277–1280. doi: 10.1200/JCO.1990.8.7.1277. [DOI] [PubMed] [Google Scholar]
- 9.Norden AD, Young GS, Setayesh K, et al. Bevacizumab for recurrent malignant gliomas: efficacy, toxicity, and patterns of recurrence. Neurology. 2008;70(10):779–787. doi: 10.1212/01.wnl.0000304121.57857.38. [DOI] [PubMed] [Google Scholar]
- 10.Pope WB, Sayre J, Perlina A, Villablanca JP, Mischel PS, Cloughesy TF. MR imaging correlates of survival in patients with high-grade gliomas. AJNR Am J Neuroradiol. 2005;26(10):2466–2474. [PMC free article] [PubMed] [Google Scholar]
- 11.Earnest F, 4th, Kelly PJ, Scheithauer BW, et al. Cerebral astrocytomas: histopathologic correlation of MR and CT contrast enhancement with stereotactic biopsy. Radiology. 1988;166(3):823–827. doi: 10.1148/radiology.166.3.2829270. [DOI] [PubMed] [Google Scholar]
- 12.Kelly PJ, Daumas-Duport C, Kispert DB, Kall BA, Scheithauer BW, Illig JJ. Imaging-based stereotaxic serial biopsies in untreated intracranial glial neoplasms. J Neurosurg. 1987;66(6):865–874. doi: 10.3171/jns.1987.66.6.0865. [DOI] [PubMed] [Google Scholar]
- 13.Kelly PJ, Daumas-Duport C, Scheithauer BW, Kall BA, Kispert DB. Stereotactic histological correlations of computed tomography- and magnetic resonance imaging-defined abnormalities in patients with glial neoplasms. Mayo Clin Proc. 1987;62(6):450–459. doi: 10.1016/s0025-6196(12)65470-6. [DOI] [PubMed] [Google Scholar]
- 14.Watanabe M, Tanaka R, Takeda N. Magnetic resonance imaging and histopathology of cerebral gliomas. Neuroradiology. 1992;34(6):463–469. doi: 10.1007/BF00598951. [DOI] [PubMed] [Google Scholar]
- 15.Brant-Zawadski M, Norman D, Newton TH. Magnetic resonance imaging of the brain: the optimal screening technique. Radiology. 1984;152:71–77. doi: 10.1148/radiology.152.1.6729138. [DOI] [PubMed] [Google Scholar]
- 16.Byrne TN. Imaging of gliomas. Semin Oncol. 1994;21:162–171. [PubMed] [Google Scholar]
- 17.Husstedt HW, Sickert M, Köstler H, Haubitz B, Becker H. Diagnostic value of the fast-FLAIR sequence in MR imaging of intracranial tumors. Eur Radiol. 2000;10(5):745–752. doi: 10.1007/s003300050997. [DOI] [PubMed] [Google Scholar]
- 18.Tsuchiya K, Mizutani Y, Hachiya J. Preliminary evaluation of fluid-attenuated inversion-recovery MR in the diagnosis of intracranial tumors. AJNR Am J Neuroradiol. 1996;17(6):1081–1086. [PMC free article] [PubMed] [Google Scholar]
- 19.Essig M, Hawighorst H, Schoenberg SO, et al. Fast fluid-attenuated inversion-recovery (FLAIR) MRI in the assessment of intraaxial brain tumors. J Magn Reson Imaging. 1998;8(4):789–798. doi: 10.1002/jmri.1880080407. [DOI] [PubMed] [Google Scholar]
- 20.Iwamoto FM, Abrey LE, Beal K, et al. Patterns of relapse and prognosis after bevacizumab failure in recurrent glioblastoma. Neurology. 2009;73(15):1200–1206. doi: 10.1212/WNL.0b013e3181bc0184. [DOI] [PMC free article] [PubMed] [Google Scholar]
- 21.Zuniga RM, Torcuator R, Jain R, et al. Efficacy, safety and patterns of response and recurrence in patients with recurrent high-grade gliomas treated with bevacizumab plus irinotecan. J Neurooncol. 2009;91(3):329–335. doi: 10.1007/s11060-008-9718-y. [DOI] [PubMed] [Google Scholar]
- 22.Wen PY, Macdonald DR, Reardon DA, et al. Updated response assessment criteria for high-grade gliomas: response assessment in neuro-oncology working group. J Clin Oncol. 2010;28(11):1963–1972. doi: 10.1200/JCO.2009.26.3541. [DOI] [PubMed] [Google Scholar]
- 23.Kreisl TN, Kim L, Moore K, et al. Phase II trial of single-agent bevacizumab followed by bevacizumab plus irinotecan at tumor progression in recurrent glioblastoma. J Clin Oncol. 2009;27(5):740–745. doi: 10.1200/JCO.2008.16.3055. [DOI] [PMC free article] [PubMed] [Google Scholar]
- 24.Ferl GZ, Xu L, Friesenhahn M, Bernstein LJ, Barboriak DP, Port RE. An automated method for nonparametric kinetic analysis of clinical DCE-MRI data: application to glioblastoma treated with bevacizumab. Magn Reson Med. 2010;63(5):1366–1375. doi: 10.1002/mrm.22335. [DOI] [PubMed] [Google Scholar]
- 25.Pope WB, Kim HJ, Huo J, et al. Recurrent glioblastoma multiforme: ADC histogram analysis predicts response to bevacizumab treatment. Radiology. 2009;252(1):182–189. doi: 10.1148/radiol.2521081534. [DOI] [PubMed] [Google Scholar]
- 26.Ellingson BM, Malkin MG, Rand SD, et al. Volumetric analysis of functional diffusion maps (fDMs) is a predictive imaging biomarker for cytotoxic and anti-angiogenic treatments in malignant gliomas. J Neurooncol. 2010 doi: 10.1007/s11060-010-0293-7. Published online ahead of print August 27, 2010. [DOI] [PMC free article] [PubMed] [Google Scholar]
- 27.Chen W, Delaloye S, Silverman DH, et al. Predicting treatment response of malignant gliomas to bevacizumab and irinotecan by imaging proliferation with [18F] fluorothymidine positron emission tomography: a pilot study. J Clin Oncol. 2007;25(30):4714–4721. doi: 10.1200/JCO.2006.10.5825. [DOI] [PubMed] [Google Scholar]
- 28.Sawlani RN, Raizer J, Horowitz SW, et al. Glioblastoma: a method for predicting response to antiangiogenic chemotherapy by using MR perfusion imaging–pilot study. Radiology. 2010;255(2):622–628. doi: 10.1148/radiol.10091341. [DOI] [PMC free article] [PubMed] [Google Scholar]


