Molecular imprinting (MI) is a technique for preparing polymer scaffolds that function as synthetic receptors1-3, and imprinted polymers that can selectively recognize organic compounds have been proven useful for sensor development2-7. Although creating synthetic MI polymers (MIPs) that recognize proteins remains challenging8-11, nanodevices and nanomaterials show promise for protein recognition into sensor architectures12-14. Here, we show that arrays of carbon nanotube (nanotube) tips imprinted with a non-conducting polymer coating can recognize proteins with subpicogram per litre sensitivity using electrochemical impedance spectroscopy. We specifically developed MI sensors for human ferritin and human papillomavirus derived E7 protein. The MI-based nanosensor can also discriminate between Ca2+-induced conformational changes in calmodulin. This ultrasensitive, label-free electrochemical detection of proteins offers an alternative to biosensors based on biomolecule recognition.
MI technology offers considerable potential as a cost-effective alternative to the use of biomolecule-based recognition in a variety of sensor applications15-17. MIPs afford the creation of specific recognition sites in synthetic polymers by a process that involves co-polymerization of functional monomers and cross-linkers around template molecules. The molecules are removed from the polymer, rendering complementary binding sites capable of subsequent template molecule recognition1-3. Although deposition of MIPs onto the surface of nanostructures may improve sensitivity for recognition of a range of organic compounds8,18-20, electronic nanosensors capable of recognizing proteins continue to be a challenge to implement, in part, because: 1) the MIP film may attenuate signals generated in response to template binding (due to the large thickness); 2) the detection mechanisms do not readily allow for effective signal conversion of template molecule binding; and 3) the sensor platforms do not support highly sensitive detection4,9-11.
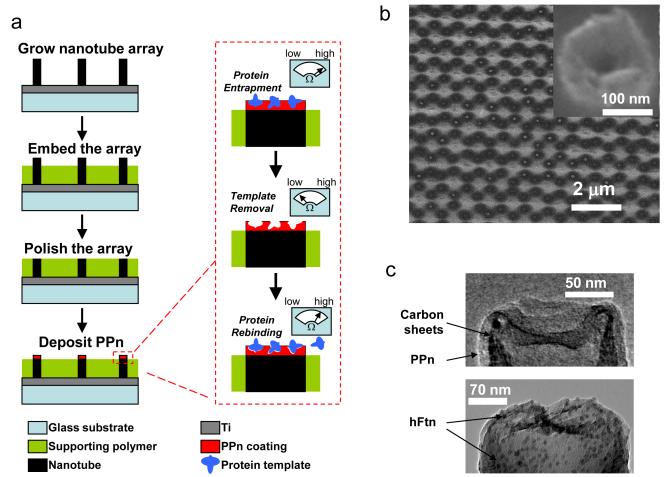
We have sought to overcome these limitations by imprinting a non-conducting polymer nanocoating on the tips of nanotube arrays. The template protein is initially incorporated in the nanocoating and, upon extraction of protein from accessible surfaces on the nanocoating, sensor electrical impedance is greatly reduced due to electrical leakage through the surface imprints in the nanocoating. Subsequent recognition of template protein is detected as an increase in impedance, due to the relatively lower conductivity of the protein. As a critical component to assembly of the sensor architecture, a non-conductive polyphenol (PPn) nanocoating was electropolymerized on the tips of nanotubes (Fig. 1a). The deposition was self-limiting (Fig. S1) and yielded a highly conformal nanocoating that is beneficial in low noise recordings21. Electrochemical impedance spectroscopy (EIS) revealed that the highest impedance of the PPn coating was obtained at the nanotube tips (data not shown), likely owing to the faster electron transfer on nanotube tips in comparison to the nanotube side walls22. The nanotube tips exhibited open cross-sections with centered cavities (Figs. 1b,c). Transmission electron microscopy confirmed that a PPn thin film of 13 nm was uniformly deposited on the nanotube tips and co-deposition of human ferritin (hFtn) was visualized due to contrast enhancement by the iron crystalline cores in the hFtn (Fig. 1c). The diameters of the observed iron cores were between 5 to 8 nm. In general, the thickness of the PPn nanocoating is comparable to that of the protein diameter such that the impedance change in response to template protein binding will be significantly enhanced.
Figure 1.
Fabrication of molecular imprinted protein nanosensor. a, Schematic of nanosensor fabrication and template protein detection (see Methods for details). The supporting polymer (SU8-2002) is spin-coated on a glass substrate containing nanotube arrays. Template proteins trapped in the polyphenol (PPn) coating are removed to reveal the surface imprints. Inset meter shows hypothetical sensor impedance responses at critical stages of the fabrication and detection. b, Scanning electron microscopy image of a polished nanotube array after PPn coating. Inset: Cross section of nanotube tip after polishing. c, Transmission electron microscopy images of PPn-coated nanotube tip without (top) and with (bottom) hFtn.
Estimation of the number of hFtn imprints was conducted by electrochemically refilling of the imprint voids with PPn, converting the total refilling charge to volume of PPn23, and calculating the equivalent number of hFtn that represented the number of imprints on the sensor (see Supplementary Information for calculations). The average number of hFtn imprints/nanotube tip corresponded to 12 hFtn (independent experiment with three chips). We also evaluated imprint development using streptavidin as a template molecule. Following rebinding of streptavidin, biotinylated gold particles were used to detect streptavidin bound on the nanotube tips (refer to Fig. S2); the average number of streptavidin imprints/nanotube tip corresponded to 40 hFtn.
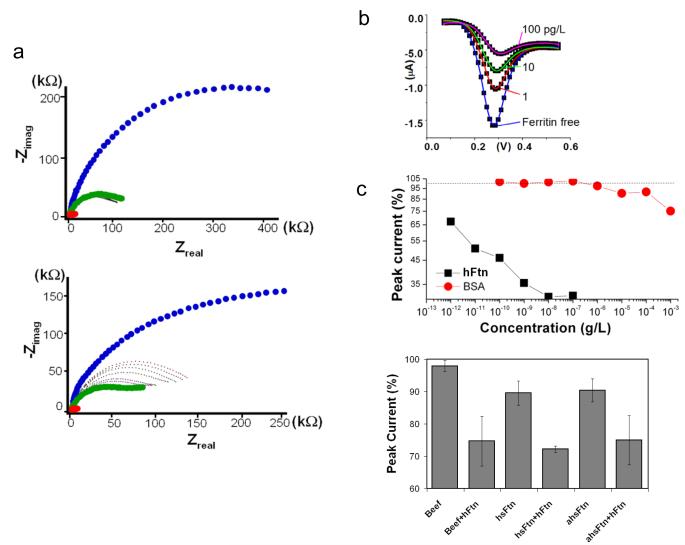
The detection of hFtn binding to its imprint site was evaluated using EIS and differential pulse voltammetry (DPV). Nyquist plots (Fig. 2a) show the impedance spectroscopy of the nanosensor at different stages of development and at various levels of protein rebinding. Compared to nanotube tips devoid of PPn, the PPn coating with hFtn increased the sensor impedance modulus from 13±2 kΩ to 241±47 kΩ at f=10 Hz. For these experiments, each measurement was preceded by the measurement of a control protein, bovine serum albumin (BSA), which served as a reference for the response to hFtn. Addition of hFtn ranging from 10−12 to 10−7 g/L exhibited a concentration-dependent increase of impedance, which was significantly larger than that induced by BSA even at 10−3 g/L. The impedance modulus at 10 Hz revealed that the impedance change in response to hFtn occurred at a concentration of 10−11 g/L, whereas BSA did not exert an impedance change below 10−4 g/L. The impedance approached its maximum value at 10−7 g/L hFtn. Thus, the dynamic range of hFtn detection spans 4 decades. The dissociation constant Kd of hFtn binding corresponded to 53.6 pg/L (Fig. S3). The peak current as measured by DPV decreased in response to increasing hFtn concentration (Fig. 2b), with the reduction in peak current responses similar to that observed by EIS (Fig. 2c).
Figure 2.
Detection of hFtn using molecular imprinted nanosensor. a, Nyquist plots of nanosensor response (f scanned from 1 Hz to 1 MHz). Traces correspond to measurements without PPn (red), hFtn entrapped in PPn (blue), hFtn removed from PPn (green), and application of BSA (upper graph, black tracing) from 10−10 to 10−4 and hFtn (lower graph, dotted tracings) from 10−12 to 10−7 g/L. Data represent three independent determinations. b, DPV current responses to different hFtn concentrations. c, Protein concentration-dependent peak current response represented as the percentage of peak current (%) vs. concentration (g/L) on log-log scales. d, DPV current responses to hFtn in binary mixtures. The final concentration of hFtn and individual interferent proteins corresponded to 10−8 g/L and 10−6 g/L, respectively. Beef: bovine muscle protein extract; hsFtn: horse ferritin; ahsFtn: horse apoferritin; hFtn: human ferritin. Data represented as standard error of the mean (n=3).
Horse apoferritin (ahsFtn) and horse ferritin (hsFtn) did not produce a significant response with the hFtn-imprinted nanosensor when evaluated at concentrations as high as 10−4 g/L (Fig. 2d); hsFtn shares greater than 92% homology with the hFtn. Specificity of the hFtn-imprinted nanosensor was also demonstrated in a series of measurements with hFtn combined with ahsFtn or hsFtn (Fig. 2d). In each case, binding of hFtn was achieved as evidenced by a decreased in the percentage of peak current, with each binary mixture exhibiting decreased DPV responses greater than the ahsFtn or hsFtn alone. Similar results were obtained with a complex mixture of proteins derived from bovine muscle extracts (Fig. 2d).
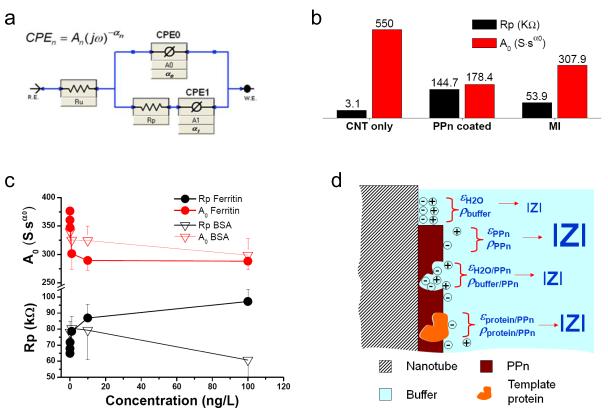
To investigate the mechanism of detection following template protein binding, Nyquist plots were fitted with a model containing constant phase elements (CPE) (Fig. 3a). Rp corresponds to the PPn coating resistance. Ru is the solution resistance. When α0 in CPE0 approximates 1.0, A0 represents the double layer capacitance Cdl. For PPn-coated electrodes, A0 is the capacitance of serial Cdl and CPPn. Accordingly, the observed impedance changes in “PPn coated” and “MI” sensors can be attributed to the alterations in resistance and capacitance (Fig. 3b). The hFtn concentration-dependent response in EIS can be separated into two components: 1) increase in resistance; and 2) decrease in capacitance vs. the increase of hFtn concentration (Fig. 3c). At the highest hFtn concentration, we observed a 50% resistance increase and a 20% capacitance decrease. Non-template BSA showed an obscure pattern of resistance and capacitance changes (Fig. 3c). The change of permittivity ε and resistivity ρ in the surface materials in response to hFtn binding (Fig. 3d) is considered the primary mechanism of signaling (rebinding proteins have lower ε and higher ρ than the replaced water in the imprint space, leading to decreased capacitance and increased resistance).
Figure 3.
Detection mechanism of the molecular imprint nanosensor. a, Equivalent circuit model with constant phase elements (CPE). b, Rp and A0 derived from Nyquist plots fittings at various fabrication stages corresponding to: nanotube tips devoid of PPn (CNT only), nanotube tips coated with template protein entrapped PPn (PPn coated), and template protein molecular imprinted nanotube tips (MI). c, Rp and A0 vs. hFtn or BSA concentrations; error bars show standard error of the mean (n=3). d, Four scenarios of sensor surface conditions closely related to resistivity (ρ) and permittivity (ε): 1) bare nanotube surface, where solution double-layer dominates the surface, (εH2O, ρbuffer); 2) nanotube surface coated by PPn, (εPPn, ρPPn); 3) nanotube coated by PPn with imprint sites, (εH2O/PPn, ρbuffer/PPn); and 4) imprint sites occupied with re-bound template protein, (εprotein/PPn, ρprotein/PPn).
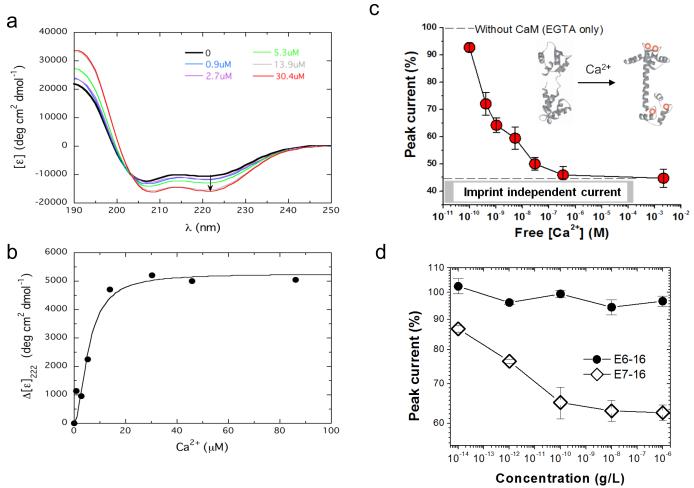
We also determined if the nanosensor could discriminate between protein conformations. Calmodulin was used since it undergoes measureable conformational changes following Ca2+ binding. Circular dichroism spectroscopy verified that calmodulin affinity for Ca2+ was within the μM range as previously reported24-26. Binding of Ca2+ enhanced the α-helical content of calmodulin (Figs. 4a and S4). These data are consistent with reports demonstrating that two ions bound produce the bulk of this large change in the far UV region25,26. Our solution binding data are consistent with a Kd of 5.6±1.1 μM (Fig. 4b) for two Ca2+ ions binding to calmodulin. Interestingly, the Kd is much higher than what appears to be operational in the Ca2+ bound calmodulin (Ca-CaM) imprint nanosensor for free Ca2+ (Supplementary Information, section I.2), where half-saturation is approximately 1 nM (Fig. S4). A likely explanation is that the off-rate of Ca2+ from the Ca-CaM complex bound to the nanotube imprint is much slower than for Ca2+ dissociating from the calmodulin complex in solution. There is a large excess of calmodulin (0.6 mM) present in the solution compared to the available imprints accessible to rebind any released Ca2+; however, the motional constraints of the imprint-bound protein are likely to hinder ion release. That said, Ca-CaM was detected by DPV under a variety of free Ca2+ concentrations with the peak current decreasing as a function of free Ca2+ with a 50% decrease corresponding to sub-nanomolar free Ca2+ (Fig. 4c).
Figure 4.
Detection of calcium-dependent calmodulin conformational changes and HPV derived oncoproteins. a, Far-UV CD spectra showing the molar ellipticity (measured in deg-cm2 dmol−1) for calmodulin in the absence (black) and presence of 0.9 (blue), 2.7 (purple), 5.3 (green), 13.9 (grey), and 30.4 (red) μM Ca2+. The arrow shows increasing negative ellipticity at 222 nm. b, Change in calmodulin mean residue ellipticity at 222 nm ([ε]0 – [ε]Ca2+) as a function of added Ca2+. The increasing value for Δ[ε] indicates an increase in helix as Ca2+ is added. c, Nanosensor DPV represented as the percentage of peak current versus free Ca2+ concentration. The peak current is normalized to that recorded in Tris buffer with 1 mM EGTA (see Supplementary Information for details). Imprint-independent current represents the total residual current with overloaded Ca2+. d, MI recognition of oncoprotein E7 type-16 by an E7-16 imprinted sensor. Protein E6-16 was used as a negative control. Data represent percentage of peak current vs. E7 (open diamonds) or E6 (closed circles) type 16 protein concentrations. Error bars show standard error of the mean (n=3).
To further demonstrate the applicability of the nanosensor, we developed a MI using human papillomavirus derived E7 protein (type-16). Analysis revealed detection of E7 protein at sub pg/L levels (Fig. 4d). Of note, computational analysis of the interaction between PPn and the template E7 protein revealed low energy PPn dockings on the protein (Fig. S5). Importantly, the papillomavirus E6 protein (type-16) was not recognized by the E7 imprint (Fig. 4d).
In conclusion, we describe a nanosensor that offers selective, label-free, electrochemical detection of proteins by MI. In contrast to conventional MI-based sensors and biomolecule-based nanosensors, a key component of the architecture is the non-conductive PPn nanocoating on nanotube tips27,28. A detection limit of ~10 pg/L was achieved for hFtn. It should be mentioned that we recognize that at low (e.g., attomolar) concentrations, the probability for a template molecule to bind to the imprint is no longer governed by simple diffusion rules and thus, the reproducibility of the system maybe lessened, potentially yielding false-negative responses. We also demonstrate the potential clinical utility of the nanosensor in the selective detection of E7 protein, suggesting use in detection and diagnosis of human papillomavirus and, by extension, other human pathogens and toxins. The nanosensor should prove highly useful in diagnosis of human disease, such as detection of cancer biomarkers, and in a host of proteomic applications29.
Methods
Nanotube array preparation
Vertically aligned nanotubes were prepared on Ti coated glass substrates as described14. The nanotubes arrays were embedded in SU8-2002 (SU8) photoresist by spin coating and then mechanically polished to expose the tips; SU8 was applied onto an array at 3000 rpm for 30 s. Following soft baking at 100 °C (5 min), SU8 was cross-linked by exposure to UV light for 3 min and then the sample was then baked at 150 °C overnight. The array was polished with a vibratory polisher from Buehler (Lake Bluff, IL) at 80% power level for 6-9 hr until the desired pattern emerged from the SU8 coating as monitored by scanning electron microscopy.
Electropolymerization of PPn onto nanotube array tips
PPn film was deposited on the exposed nanotube tips by cyclic voltammetry in phosphate buffered saline containing 1.5 mM phenol (pH=7.4). The working electrode (nanotube tips) was applied a “ramping” voltage at a scanning rate of +/−50 mV/s between 0.0 to 0.9 V versus the reference electrode (Ag/AgCl) for 5 cycles. An additional electrode consisting of a platinum wire was connected as the counter electrode for current injection. To entrap template proteins in the PPn coating, 100 μg/ml of the corresponding template protein was added to the PPn deposition buffer. A 300 mV DC voltage (30 s) was first used to attract proteins onto the nanotube tips, then 5 cycles of voltage scanning was applied as described above. A similar procedure was used to entrap E7 protein and calmodulin in the PPn coating with the exception that during calmodulin co-deposition, 1 mM Ca2+ was included in order to render a conformation with a full scale elongation (“open”) that offered distinctive imprint morphology from its globular shape at Ca2+ free or other partial “close” status.
Electrochemical measurements
A three-electrode electrochemical system was configured by connecting the Ti film, on which nanotubes were vertically grown, as the working electrode; Ag/AgCl corresponded to the reference electrode, and the platinum wire served as the counter electrode. EIS was used to monitor the impedance changes of the electrode surface and its interface to the buffer solution containing 1 mM ferrocyne carboxyl acid in phosphate buffered saline during the PPn deposition. An AC sine wave voltage was applied to the chip with a superimposed DC voltage at 300 mV. Its peak-to-peak amplitude was 10 mV. The frequency varied from 1 Hz to 1 MHz with 20 points impedance readings per decade. The impedance data were then represented in form of Nyquist plots that were fitted to an equivalent circuit by the analysis function in Echem Analyst software. DPV was conducted in binding buffer supplemented with 1 mM ferrocyne carboxyl acid. Initial and final potentials vs. reference electrode were 0.0 and 0.5 V, respectively. Pulse size was 50 mV and pulse time was 0.05 s; step size was 2 mV and sample period was 0.1 s. For imprint refilling experiments, nanotube arrays were coated with PPn only or with PPn plus hFtn. A leakage current was observed with the PPn only sample after imprint development. By eliminating the charge due to the leakage current with PPn only sample, the imprint contributed charge in the imprinted sample was obtained for estimating the amount of imprints on the chip.
Protein imprint development
For imprint development, the nanotube tip array with protein-entrapped PPn coating was rinsed and incubated overnight in deionized water at room temperature. In some instances, a developing buffer containing 5% acetic acid and 10% sodium dodecyl sulfate was used, which yielded higher protein extraction efficiency. After protein entrapment and removal, the sample was evaluated by transmission electron microscopy and EIS. Prior to measuring template protein rebinding, DPV was repetitively performed in a template protein-free buffer solution until the current stabilized. Nanosensor responses were then measured by DPV or EIS following incubation for 30 min at room temperature with the template protein at various concentrations.
Supplementary Material
Acknowledgements
The authors thank the financial support of The Seaver Institute and the National Cancer Institute (R21CA137681-01; T.C.C., D.C., M.J.N.). Lu Ren was supported by China Scholarship Council (File No. 2008677005). We thank Drs. Olga Gursky and Shobini Jayaraman (Boston University School of Medicine, Department of Physiology and Biophysics) for use of their Aviv spectropolarimeter.
Footnotes
Additional Information The authors declare no competing financial interests in connection to this publication.
Supplementary information accompanies this paper at www.nature.com/naturenanotechnology. Reprints and permission information is available online at http://npg.nature.com/reprintsandpermissions/. □Correspondence and requests for materials should be addressed to D.C.
Summary of paper NANOSENSORS: Carbon nanotube tips containing molecular imprints within a non-conducting polymer coating can detect proteins with high sensitivity, offering a label-free alternative to sensors based on biomolecule recogniton.
References
- 1.Wulff G, Sharhan A. Über die Anwendung von enzymanalog gebauten Polymeren zur Racemattrennung. Angew. Chem. 1972;84:364. [Google Scholar]
- 2.Vlatakis G, Anderson LI, Muller R, Mosbach K. Drug assay using antibody mimics made by molecular imprinting. Nature. 1993;361:645–647. doi: 10.1038/361645a0. [DOI] [PubMed] [Google Scholar]
- 3.Hoshino Y, Kodama T, Okahata Y, Shea KJ. Peptide imprinted polymer nanoparticles: a plastic antibody. J. Am. Chem. Soc. 2008;130:15242–15243. doi: 10.1021/ja8062875. [DOI] [PubMed] [Google Scholar]
- 4.Bossi A, Bonini F, Turner APF, Piletsky SA. Molecularly imprinted polymers for the recognition of proteins: the state of the art. Biosens. Bioelectron. 2007;22:1131–1137. doi: 10.1016/j.bios.2006.06.023. [DOI] [PubMed] [Google Scholar]
- 5.Karube J, et al. Molecular recognition in continuous polymer rods prepared by a molecular imprinting technique. Anal. Chem. 1993;65:2223–2224. [Google Scholar]
- 6.Kempe M. Antibody-mimicking polymers as chiral stationary phases in HPLC. Anal. Chem. 1996;68:1948–1953. doi: 10.1021/ac9512160. [DOI] [PubMed] [Google Scholar]
- 7.Rashid BA, Briggs RJ, Hay JN, Stevenson D. Preliminary evaluation of a molecular imprinted polymer for solid-phase extraction of Tamoxifen. Anal. Commun. 1997;34:303–305. [Google Scholar]
- 8.Shi H, Tsai W-B, Garrison MD, Ferrari S, Ratner BD. Template-imprinted nanostructured surfaces for protein recognition. Nature. 1999;398:593–597. doi: 10.1038/19267. [DOI] [PubMed] [Google Scholar]
- 9.Rick J, Chou TC. Using protein templates to direct the formation of thin-film polymer surfaces. Biosens. Bioelectron. 2006;22:544–549. doi: 10.1016/j.bios.2006.06.035. [DOI] [PubMed] [Google Scholar]
- 10.Wang Y, et al. A potentiometric protein sensor built with surface molecular imprinting method. Biosens. Bioelectron. 2008;24:162–166. doi: 10.1016/j.bios.2008.04.010. [DOI] [PubMed] [Google Scholar]
- 11.Bossi A, Piletsky SA, Piletska EV, Righetti PG, Turner APF. Surface-grafted molecularly imprinted polymers for protein recognition. Anal. Chem. 2001;73:5281–5286. doi: 10.1021/ac0006526. [DOI] [PubMed] [Google Scholar]
- 12.Zheng G, Patolsky F, Cui Y, Wang WU, Lieber CM. Multiplexed electrical detection of cancer markers with nanowire sensor arrays. Nat. Biotechnol. 2005;23:1294–1301. doi: 10.1038/nbt1138. [DOI] [PubMed] [Google Scholar]
- 13.Yu X, et al. Carbon nanotube amplification strategies for highly sensitive immunodetection of cancer biomarkers. J. Am. Chem. Soc. 2006;128:11199–11205. doi: 10.1021/ja062117e. [DOI] [PMC free article] [PubMed] [Google Scholar]
- 14.Yu Y, et al. Assembly of multi-functional nanocomponents on periodic nanotube array for biosensors. Micro. Nano. Letters. 2009;4:27–33. doi: 10.1049/mnl:20080054. [DOI] [PMC free article] [PubMed] [Google Scholar]
- 15.Riskin M, Tel-Vered R, Willner I. The imprint of electropolymerized polyphenol films on electrodes by donor-acceptor interactions: selective electrochemical sensing of N,N’-dimethyl-4,4′-bipyridinium (methyl viologen) Adv. Func. Mat. 2007;17:3858–3863. [Google Scholar]
- 16.Lakshmi D, et al. Electrochemical sensor for catechol and dopamine based on a catalytic molecularly imprinted polymer-conducting polymer hybrid recognition element. Anal. Chem. 2009;81:3576–3584. doi: 10.1021/ac802536p. [DOI] [PubMed] [Google Scholar]
- 17.Panasyuk TL, Mirsky VM, Piletsky SA, Wolfbeis OS. Electropolymerized molecularly imprinted polymers as receptor layers in capacitive chemical sensors. Anal. Chem. 1999;71:4609–4613. [Google Scholar]
- 18.Choong CL, Bendallb JS, Milnea WI. Carbon nanotube array: a new MIP platform. Biosen. Bioelectron. 2009;25:652–656. doi: 10.1016/j.bios.2008.11.025. [DOI] [PubMed] [Google Scholar]
- 19.Wei Y, Qiu L, Owen C, Lai EPC. Encapsulation of quantum dots and carbon nanotubes with polypyrrole in a syringe needle for automated molecularly imprinted solid phase pre-concentration of ochratoxin A in red wine analysis. Sens. Instrum. Food Qual. 2007;1:133–141. [Google Scholar]
- 20.Xie C, Li H, Li S, Wu J, Zhang Z. Surface molecular self-assembly for organophosphate pesticide imprinting in electropolymerized poly(p-aminothiophenol) membranes on a gold nanoparticle modified glassy carbon electrode. Anal. Chem. 2010;82:241–249. doi: 10.1021/ac901860t. [DOI] [PubMed] [Google Scholar]
- 21.Tabard-Cossa V, Trivedi V, Wiggin M, Jetha NN, Marziali A. Noise analysis and reduction in solid-state nanopores. Nanotechnology. 2007;18:305505. (6pp) [Google Scholar]
- 22.Gong K, Chakrabarti S, Dai L. Electrochemistry at carbon naotube electrodes: is the nanotube tip more active than the side wall? Angew. Chem. Int. Ed. 2008;47:5446–5450. doi: 10.1002/anie.200801744. [DOI] [PubMed] [Google Scholar]
- 23.Bartlett PN, Tebbutt P, Tyrrell CH. Electrochemical immobilization of enzymes. 3. Immobilization of glucose oxidase in thin films of electrochemically polymerized phenols. Anal. Chem. 1992;64:138–142. [Google Scholar]
- 24.Klee CB. Conformational transition accompanying the binding of Ca2+ to the protein activator of 3′,5′-cyclic adenosine monophosphate. Biochemistry. 1977;16:1017–1024. doi: 10.1021/bi00624a033. [DOI] [PubMed] [Google Scholar]
- 25.Crouch TH, Klee CB. Positive cooperative binding of calcium to bovine brain calmodulin. Biochemistry. 1980;19:3692–3698. doi: 10.1021/bi00557a009. [DOI] [PubMed] [Google Scholar]
- 26.Weinstein H, Mehler EL. Ca2+-binding and structural dynamics in the functions of calmodlins. Annu. Rev. Physiol. 1994;56:213–236. doi: 10.1146/annurev.ph.56.030194.001241. [DOI] [PubMed] [Google Scholar]
- 27.Devanathan S, et al. Subpicomolar sensing of δ-opioid receptor ligands by molecular-imprinted polymers using plasmon-waveguide resonance spectroscopy. Anal. Chem. 2005;77:2569–2574. doi: 10.1021/ac048476e. [DOI] [PubMed] [Google Scholar]
- 28.Patolsky F, Zheng G, Lieber CM. Fabrication of silicon nanowire devices for ultrasensitive, label-free, real-time detection of biological and chemical species. Nature Protocols. 2006;1:1711–1724. doi: 10.1038/nprot.2006.227. [DOI] [PubMed] [Google Scholar]
- 29.Sanchez-Carbayo M. Antibody arrays: Technical considerations and clinical applications in cancer. Clin. Chem. 2006;52:1651–1659. doi: 10.1373/clinchem.2005.059592. [DOI] [PubMed] [Google Scholar]
Associated Data
This section collects any data citations, data availability statements, or supplementary materials included in this article.


