

Abstract
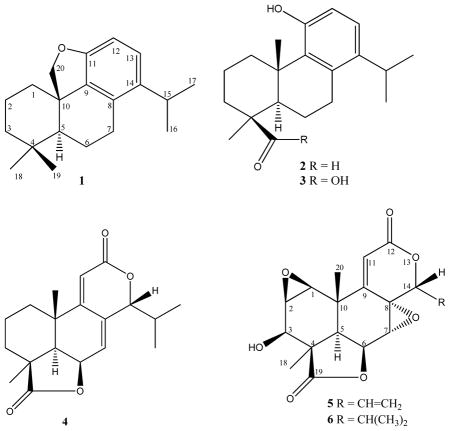
An activator protein-1 (AP-1) based bioassay guided phytochemical investigation on Podocarpus latifolius led to the isolation of three new sempervirol type diterpenes, cycloinumakiol (1), inumakal (2), and inumakoic acid (3) along with three known norditerpenes (4–6). Compounds 4 and 6 were responsible for the observed bioactivity.
Carcinogenesis, the process of transforming normal cells into cancer cells, is a multistage process of initiation, promotion, and progression. The activator protein-1 (AP-1), an oncogenic transcription factor, is a heterodimeric or homodimeric protein complex that is required for tumor promotion and progression.1,2 The heterodimer AP-1 consists of Jun (c-Jun, Jun B and Jun D) paired with Fos (c-Fos, Fos B, Fra 1 and Fra 2) proteins; homodimers of Jun proteins also exist.3 The N-terminally truncated c-Jun (TAM67) mutant protein has been shown to form homodimers or heterodimers with other Jun or Fos family members, which bind to AP-1 sequences, that subsequently demonstrate no or diminished AP-1 transactivation.4 It has been shown that molecules that mimic TAM67 in inhibiting 12-O-tetradecanoyl probol-13-ester (TPA)-stimulated AP-1 activity may be valuable for the prevention and treatment of cancers.1,2 Hence, a search for novel and specific AP-1 inhibitors from natural products, including those of plant origin, might be beneficial for the prevention and therapy of cancer. We recently developed a high throughput assay to screen natural product extracts for such inhibitors.2 An organic solvent extract of the root bark of Podocarpus latifolius (Thunb.) R.Br. ex Mirb. collected in Tanzania demonstrated activity in this assay and was subjected to bioassay-guided fractionation.
Podocarpus is one of the most widely distributed genera of the family Podocarpaceae, with about 100 species having diverse morphology, ecology, and chemical constituents. A number of medicinal and non-medicinal ethnobotanical uses are reported for the genus Podocarpus.5 Different biological activities such as cytotoxic, antibacterial, anti-inflammatory, antioxidant, and tyrosinase inhibitory properties have been reported for compounds from Podocarpus.5–11
Podocarpus latifolius is a slow-growing evergreen tree which can reach a height of 30 m. The norditerpene dilactone macrophyllic acid and several biflavones have previously been reported from P. latifolius.12 Our bioassay guided phytochemical investigation with respect to AP-1 led to the isolation of three new (1–3) and three known (4–6) diterpenes.
Results and Discussion
The fractionation of root bark extract (CH2Cl2-MeOH) of P. latifolius by successive diol and LH-20 column chromatography yielded three new (1–3) and three known (4–6) diterpenoids. Compound 1 was obtained as a reddish gum. The IR spectrum of 1 exhibited absorptions at 1601, and 1547 cm−1 due to oxymethylene and aromatic bonds, respectively.13 The HREIMS analysis of 1 showed a molecular composition of C20H29O ([M + H]+ at m/z 285.2222, calcd 285.2212), implying seven double bond equivalents (DBE). Four of these DBE could be accounted for by a single aromatic ring, and the absence of carbonyl resonances and lack of other unsaturated carbons implied a tetracyclic structure. Four methyl groups were evident in the 13C NMR spectrum. In the 1H NMR spectrum of 1 (Table 1), two methyls resonating at δH 0.97 and 1.10 were assigned as C-18 and C-19, respectively. These assignments were supported by ROESY correlations (Figure 1). Two methyl doublets at δH 1.28 and 1.27 (J = 7.0 Hz) were attributed to C-16 and C-17 isopropyl methyls,7,8 while the isopropyl methine proton appeared as a broad resonance at δH 3.12. The oxymethylene protons H-20a and b resonated as two doublets at δH 3.43 and 3.79 (J = 11.0 Hz). Both oxymethylene protons showed HMBC correlations with C-10 (δC 38.6), C-1 (δC 35.1) and C-5 (δC 50.6). Similarly, H-5 correlated with C-20 (δC 64.8). The aromatic region of the 1H NMR spectrum showed two ortho-coupled doublets at δH 6.50 (J = 8.5 Hz) and 6.91 (J = 8.5 Hz) that were assigned to H-13 and H-12, respectively. Both H-13 and H-12 showed HMBC correlations with C-11 (δC 152.9) and C-14 (δC 131.2), however, the correlation of H-13 with C-14 was stronger than with C-11 and vice-versa for H-12. Correlations of H-16 and H-17 were also observed with C-15 (δC 27.4) and C-14. Similarly, H-7b (δH 2.66) showed HMBC interactions with C-8 (δC 133.3), and C-9 (δC 142.0). Data pertaining to the relative configuration of compound 1 (Fig. 1) defined a trans fusion of rings A and B. The oxymethylene proton H-20a (δH 3.79) showed ROESY correlations with H-19 (δH 1.10), H-1a (δH 1.80), H-2a (δH 1.60), and H-3b (δH 1.30). Similarly, H-18 (δH 0.97) exhibited through-space interaction with H-5 (δH 1.34), H-3a (δH 2.18), and H-7a (δH 2.87). This analysis suggested that C-20 and C-19 are cofacial, whereas C-18 and H-5 are on the opposite face. Hence, compound 1 was concluded to be 11,10-oxymethylenecyclopent-14-isopropyl-8,11,13-podocarpatriene and was named cycloinumakiol. It has the same carbon skeleton to that of previously reported inumakiols except for the presence of the additional oxymethylene ring.10
Table 1.
1H and 13C NMR Data (600 MHz, CDCl3) of Compounds 1–3 and 13C NMR Data of Compound 6
| Position | 1 | 2 | 3 | 6 | |||
|---|---|---|---|---|---|---|---|
| δH (J in Hz) | δC | δH (J in Hz) | δC | δH (J in Hz) | δC | δC | |
| 1a | 1.80, 1H, m | 35.1 | 2.20, 1H, m | 33.9 | 2.20, 1H, m | 37.4 | 56.5 |
| 1b | 0.93, 1H, m | 1.06, 1H, m | 1.03, 1H, m | ||||
| 2a | 1.60, 1H, m | 19.5 | 1.72, 1H, m | 19.3 | 1.96, 1H, m | 20.5 | 51.4 |
| 2b | 1.31, 1H, m | 1.61, 1H, m | 1.55, 1H, m | ||||
| 3a | 2.18, 1H, brd (12.7) | 39.7 | 2.21, 1H, m | 39.3 | 2.16, 1H, m | 40.3 | 68.7 |
| 3b | 1.30, 1H, m | 1.33, 1H, m | 1.27, 1H, m | ||||
| 4 | - | 37.6 | - | 48.6 | - | 43.8 | 49.5 |
| 5 | 1.34, 1H, brd (12.9) | 50.6 | 1.59, 1H, brd (11.4) | 51.4 | 1.44, 1H, brd (12.4) | 52.2 | 45.9 |
| 6a | 1.94, 1H, m | 19.2 | 2.25, 1H, m | 19.5 | 2.19, 1H, m | 21.3 | 72.1 |
| 6b | 1.53, 1H, m | 1.94, 1H, m | 1.94, 1H, m | ||||
| 7a | 2.87, 1H, dd (6.0) | 29.3 | 2.98, 1H, dd (5.6) | 29.5 | 2.93, 1H, dd (4.9) | 30.2 | 54.8 |
| 7b | 2.66, 1H, m | 2.75, 1H, m | 2.62, 1H, m | ||||
| 8 | - | 133.3 | - | 133.5 | - | 134.4 | 58.7 |
| 9 | - | 142.0 | - | 140.6 | - | 141.0 | 158.1 |
| 10 | - | 38.6 | - | 38.1 | - | 38.6 | 38.3 |
| 11 | - | 152.9 | - | 152.4 | - | 152.3 | 120.0 |
| 12 | 6.91, 1H, d (8.5) | 123.0 | 6.98, 1H, d (8.5) | 123.8 | 6.97, 1H, d (8.5) | 124.3 | 164.2 |
| 13 | 6.50, 1H, d (8.5) | 114.2 | 6.52 (1H, d, 8.5) | 114.8 | 6.51, 1H, d (8.5) | 114.6 | |
| 14 | - | 131.2 | 131.2 | - | 131.0 | 83.2 | |
| 15 | 3.12, 1H, brs | 27.4 | 3.25, 1H, brs | 27.5 | 3.25, 1H, brs | 27.4 | 27.4 |
| 16* | 1.28, 3H, d (7.0) | 20.2 | 1.34, 3H, d (7.0) | 20.4 | 1.31, 3H, d (7.0) | 20.2 | 16.9 |
| 17* | 1.27, 3H, d (7.0) | 20.2 | 1.32, 3H, d (7.0) | 20.5 | 1.32, 3H, d (7.0) | 20.4 | 21.6 |
| 18 | 0.97, 3H, s | 26.7 | 1.08, 3H, s | 24.2 | 1.30, 3H, s | 28.8 | 25.6 |
| 19 | 1.10, 3H, s | 26.1 | 9.80, 1H, s | 206.1 | - | 183.2 | 177.1 |
| 20a | 3.79, 1H, d (11.0) | 64.8 | 1.03, 3H, s | 24.4 | 1.10, 3H, s | 23.4 | 21.7 |
| 20b | 3.43, 1H, d (11.0) | ||||||
The 1H- and 13C- NMR assignments may be exchanged for 1, 2, and 3.
Figure 1.
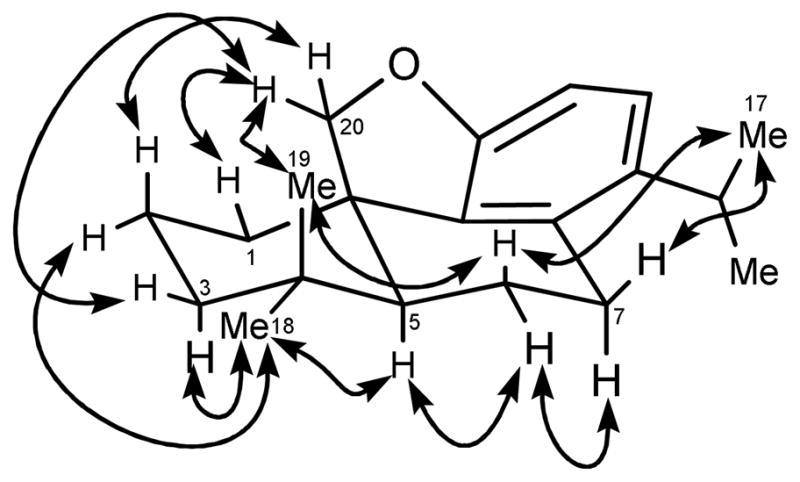
Key ROESY interactions in compound 1
Compound 2 was isolated as a reddish gum. The IR spectrum of 2 exhibited absorptions at 3549, 1714, and 1550 cm−1 for phenolic hydroxy, carbonyl, and aromatic bonds, respectively.13 The molecular formula of 2 was determined to be C20H29O2 in HREIMS ([M + H]+ at m/z 301.2172, calcd 301.2162), corresponding to the presence of seven degrees of unsaturation. The analysis of 1D and 2D NMR data of compound 2 showed distinct similarities with compound 1 with major differences at C-20 and C-19. The C-20 methyl protons resonated as a 3H singlet at δH 1.03 with a carbon shift value of δC 24.4, whereas the formyl proton of C-19 appeared as a singlet at δH 9.80 with a carbon shift of δC 206.1. The 1H and 13C NMR data of compound 2 are presented in Table 1. Hence, compound 2 was concluded to be 11-hydroxy-14-isopropyl-8,11,13-podocarpatrien-19-al and was named inumakal.
Compound 3 was isolated as a reddish gum. The IR spectrum of 3 exhibited absorptions at 3053, 1734, and 1550 cm−1 for carboxylic acid hydroxy, carbonyl, and aromatic bonds, respectively.13 The molecular composition of 3 was found to be C20H29O3 by HREIMS ([M + H]+ at m/z 317.2112, calcd 317.2111), corresponding to seven degrees of unsaturation. The 1D and 2D NMR data of compound 3 showed many similarities with compound 2 except for the presence of a carboxylic acid instead of an formyl group at C-4. The acid carbonyl resonated at δC 183.2. The 1H and 13C NMR data of compound 3 are presented in Table 1. Hence, compound 3 was concluded to be 11-hydroxy-14-isopropyl-8,11,13-podocarpatrien-19-oic acid and was named as inumakoic acid.
Together with these three new sempervirol diterpenes, three known norditerpenes 4–6 were isolated and identified based on a comparison of their spectroscopic data with the literature. The known norditerpenes were identified as nagilactone F (4), inumakilactone B (5) and inumakilactone (6).6,14–16 The 13C NMR data of compound 6 has not been previously published and thus is shown in Table 1. The originally proposed stereostructures of 5 and 6 have been revised by others as shown, and are consistent with our data.6
All six compounds were evaluated for their ability to inhibit phorbol ester TPA-induced activation of AP-1 activity. Only compounds 4 and 6 had significant activity at the concentrations tested, with IC50 values estimated from dose-response curves of 1.5 and 4.0 μM, respectively. However, both of these compounds also appeared to be toxic, with cell survival of <50% in each case at more than 2.5 μM.
Experimental Section
General Experimental Procedures
Optical rotations were measured on a Perkin-Elmer 241 polarimeter in a 100 × 2 mm cell (units 10−1 deg cm2g−1). UV absorption spectra were obtained using a Varian Cary 50 Bio UV-visible spectrophotometer. IR spectra were measured using a JASCO FT/IR-6100 type A spectrometer. LCMS were obtained using a Hewlett Packard Series 1100 MSD, whereas HRMS were acquired on an Agilent 6520 Accurate Mass Q-TOF instrument with internal reference masses at 121.05087 and 922.00979, both within 5 ppm. The NMR experiments were performed on a Bruker 600 MHz NMR spectrometer. 1H and 13C spectra were referenced to deuterated solvent peaks. The diol DIO Spe-ed SPE cartridge was used for fractionation of the extract, whereas Sephadex LH-20 columns attached to a model UA-6 UV detector and Foxy 200 fraction collector (Teledyne Isco) were used for further fractionation and purification of the compounds. All solvents and chemicals were of analytical grade.
Plant Material
The root bark of Podocarpus latifolius (Thunb.) R. Br. ex Mirb. (517.0 gm dry weight, Q66T0357, N017773) was collected on October 8, 1988 by Roy Gereau and James Lovett of the Missouri Botanical Garden at Luisenga Stream, Mufundi District, Iringa Province, Tanzania (1710 m elevation) and identified by James Lovett. A voucher specimen was deposited in the Missouri Botanical Garden herbarium as R. Gereau & J. Lovett 2635.
Extraction and Isolation
The dried root bark of P. latifolius was ground and extracted with CH2Cl2-MeOH (1:1 v/v) by the standard NCI method to yield 66.25 gm of organic extract.17 Part (101.4 mg) of this extract was used for the AP-1 based bioassay guided extraction and isolation of compounds. The extract was loaded on a diol DIO Spe-ed SPE cartridge and eluted with 6.0 mL each of hexanes/CH2Cl2 (9:1), CH2Cl2/EtOAc (20:1), EtOAc, and EtOAc/MeOH (5:1) to give four fractions A-E of 4.3, 22.5, 16.0 and 53.0 mg, respectively. The AP-1 activity of fraction B was found to be higher than the other fractions and was selected for further fractionation and isolation of compounds. Fraction B (21.0 mg) was chromatographed on a 1.5 × 40 cm Sephadex LH-20 column and eluted with hexanes/CH2Cl2/MeOH (2:5:1, v/v), with 150 drop fractions collected in each tube. Based upon the UV-absorption (254 nm), eight fractions A1-H1 were collected. The fractions A1-H1 were between the tubes 1–11, 12–19, 20–26, 27–32, 33–36, 37–44, 45–55, and 56–66, respectively. Among the eight fractions, fraction A1 - D1, F1, and G1 were found to be pure and correspond to compounds 5 (2.1 mg), 4 (6.6 mg), 6 (2.8 mg), 2 (3.6 mg), 1 (2.5 mg), and 3 (2.9 mg), respectively.
Cycloinumakiol (1)
Reddish gum (CHCl3); [α]25D = + 49 (c 0.015, MeOH); UV (MeOH) λmax (log ε) 280.0 (4.21), 226.5 (3.71) nm; IR (KBr) νmax 1601, 1547 cm−1; 1H and 13C NMR data, see Table 1; HR-EIMS [M + H] + m/z 285.2222 (calcd for C20H29O 285.2212).
Inumakal (2)
Reddish gum (CHCl3); [α]25D = + 20 (c 0.021, MeOH); UV (MeOH) λmax (log ε) 280.0 (4.43), 226.5 (3.89) nm; IR (KBr) νmax 3549, 1714, 1550 cm−1; 1H and 13C NMR data, see Table 1; HR-EIMS [M + H] + m/z 301.2172 (calcd for C20H29O2 301.2162).
Inumakoic acid (3)
Reddish gum (CHCl3); [α]25D = + 13 (c 0.018, MeOH); UV (MeOH) λmax (log ε) 280.0 (4.43), 226.5 (3.62) nm; IR (KBr) νmax 3053, 1734, 1550 cm−1; 1H and 13C NMR data, see Table 1; HR-EIMS [M + H] + m/z 317.2112 (calcd for C20H28O3 317.2111).
AP-1 Assay
The ability of compounds and fractions to inhibit TPA-induced AP-1 activation was assessed as described.2 Briefly, cells expressing β-lactamase under the control of the AP-1 promoter were treated for 18 h with tetradecanoyl phorbol acetate (TPA) in the presence or absence of putative inhibitors. Activity was normalized to that of cells treated with TPA only. Cytotoxicity was evaluated by estimating effects of compounds on cell numbers by a separate XTT assay. Samples were added in DMSO solution in triplicate.
Supplementary Material
Acknowledgments
We thank Tom McCloud, SAIC-Frederick, Inc., Frederick, MD and the Natural Products Support Group for plant grinding and extraction, the CCR Biophysics Resource for providing technical assistance with HR-EIMS measurements, and Kirk Gustafson, Molecular Targets Laboratory, National Cancer Institute, Frederick, MD for helpful comments. This project has been funded in whole or in part with Federal funds from the National Cancer Institute, National Institutes of Health, under contract HHSN261200800001E. The content of this publication does not necessarily reflect the views or policies of the Department of Health and Human Services, nor does mention of trade names, commercial products or organizations imply endorsement by the US Government. This research was supported [in part] by the Intramural Research Program of NIH, National Cancer Institute, Center for Cancer Research.
Footnotes
Dedicated to Dr. Koji Nakanishi of Columbia University for his pioneering work on bioactive natural products.
Supporting Information Available: This material is available free of charge via the internet at http://pubs.acs.org.
References and Notes
- 1.Young MR, Li JJ, Rincón M, Flavell RA, Sathyanarayana BK, Hunziker R, Colburn N. Proc Natl Acad Sci U S A. 1999;96:9827–9832. doi: 10.1073/pnas.96.17.9827. [DOI] [PMC free article] [PubMed] [Google Scholar]
- 2.Ruocco KM, Goncharova EI, Young MR, Colburn NH, McMahon JB, Henrich CJ. J Biomol Screen. 2007;12:133–139. doi: 10.1177/1087057106296686. [DOI] [PubMed] [Google Scholar]
- 3.Angel P, Karin M. Biochim Biophys Acta. 1991;1072:129–157. doi: 10.1016/0304-419x(91)90011-9. [DOI] [PubMed] [Google Scholar]
- 4.Brown PH, Alani R, Prei LH, Szabo E, Birrer MJ. Oncogene. 1993;8:877–886. [PubMed] [Google Scholar]
- 5.Abdillahi HS, Stafford GI, Finnie JF, Van Staden J. S Afr J Bot. 2010;76:1–24. [Google Scholar]
- 6.Sato K, Inaba Y, Park HS, Akiyama T, Koyama T, Fukaya H, Aoyagi Y, Takeya K. Chem Pharm Bull. 2009;57:668–679. doi: 10.1248/cpb.57.668. [DOI] [PubMed] [Google Scholar]
- 7.Park HS, Kai N, Fukaya H, Aoyagi Y, Takeya K. Heterocycles. 2004;63:347–357. [Google Scholar]
- 8.Kuo YJ, Hwang SY, Wu MD, Liao CC, Liang YH, Kuo YH, Ho HO. Chem Pharm Bull. 2008;56:585–588. doi: 10.1248/cpb.56.585. [DOI] [PubMed] [Google Scholar]
- 9.Reynolds M, Chaturvedula VSP, Ratovosons F, Andriantsiferana R, Rasamison VE, Guza RC, Kingston DGI. Nat Prod Res. 2006;20:606–610. doi: 10.1080/14786410500249315. [DOI] [PubMed] [Google Scholar]
- 10.Sato K, Sugawara K, Takeuchi H, Park HS, Akiyama T, Koyama T, Aoyagi Y, Takeya K, Tsugane T, Shimura S. Chem Pharm Bull. 2008;56:1691–1697. doi: 10.1248/cpb.56.1691. [DOI] [PubMed] [Google Scholar]
- 11.Abdillahi HS, Finnie JF, Van Staden J. J Ethnopharmacol. 2010 doi: 10.1016/j.jep.2010.07.019. In Press. [DOI] [PubMed] [Google Scholar]
- 12.Fozdar BI, Khan SA, Shamsuddin KM. J Indian Chem Soc. 1989;66:423–424. [Google Scholar]
- 13.Pavia DL, Lampman GM, Kriz GS. Introduction to Spectroscopy. 2. Harcourt Brace College Publishers; USA: 1996. [Google Scholar]
- 14.Hayashi Y, Yokoi J, Watanabe Y, Sakan T. Chem Lett. 1972:759–762. [Google Scholar]
- 15.Hayashi Y, Matsumoto T, Uemura M. Org Magn Reson. 1980;14:86–91. [Google Scholar]
- 16.Hori M. Steroids. 1969;14:33–46. doi: 10.1016/0039-128x(69)90091-9. [DOI] [PubMed] [Google Scholar]
- 17.McCloud TG. Molecules. 2010;15:4526–4563. doi: 10.3390/molecules15074526. [DOI] [PMC free article] [PubMed] [Google Scholar]
Associated Data
This section collects any data citations, data availability statements, or supplementary materials included in this article.