

In lung cancer screening, the presence or absence of a change in the size of noncalcified lung nodules appears to be the most important consideration in detecting change and making follow-up recommendations; reader agreement for those determinations seems acceptable but could be improved.
Abstract
Purpose:
To measure reader agreement in determining whether lung nodules detected at baseline screening computed tomography (CT) had changed at subsequent screening examinations and to evaluate the variability in recommendations for further follow-up.
Materials and Methods:
All subjects were enrolled in the National Lung Screening Trial (NLST), and each participant consented to the use of their de-identified images for research purposes. The authors randomly selected 100 cases of nodules measuring at least 4.0 mm at 1-year screening CT that were considered by the original screening CT reader to be present on baseline CT scans; nodules considered by the original reader to have changed were oversampled. Selected images from each case showing the entire nodule at both examinations were preloaded on a picture archiving and communication system workstation. Nine radiologists served as readers, and they evaluated whether the nodule was present at baseline and recorded the bidimensional measurements and nodule characteristics at each examination, presence or absence of change, results of screening CT, and follow-up recommendations (high-level follow-up, low-level follow-up, no follow-up).
Results:
On the basis of reviews during case selection, five nodules seen at follow-up were judged not to have been present at baseline; for 19 of the remaining 95 cases, at least one reader judged the nodule not to have been present at baseline. For the 76 nodules that were unanimously considered to have been present at baseline, 21%–47% (mean ± standard deviation, 30% ± 9) were judged to have grown. The κ values were similar for growth (κ = 0.55) and a positive screening result (κ = 0.51) and were lower for a change in margins and attenuation (κ = 0.27–0.31). The κ value in the recommendation of high- versus low-level follow-up was high (κ = 0.66).
Conclusion:
Reader agreement on nodule growth and screening result was moderate to substantial. Agreement on follow-up recommendations was lower.
© RSNA, 2011
Supplemental material: http://radiology.rsna.org/lookup/suppl/doi:10.1148/radiol.10101254/-/DC1
Introduction
Although the sensitivity of low-dose chest computed tomography (CT) in the detection of small lung nodules is high, most nodules are benign or indeterminate (1). These indeterminate nodules are frequently managed by means of CT surveillance to assess for changes suggestive of neoplasia. Therefore, interpretation of subsequent lung screening CT scans is as crucial as the interpretation of baseline CT scans because radiologists must not only detect new abnormalities but also follow the status of any preexisting indeterminate nodules.
Evaluation of preexisting nodules includes assessments of changes in size, attenuation, and contour, all of which may be subjective and involve substantial reader variability (2,3). Although reader variability in the interpretation of baseline screening CT scans has been previously reported (4,5), to our knowledge the variability in determining changes in those lesions has not. The primary purpose of this study was to assess reader variability in determining whether an abnormality detected at baseline screening CT has changed at subsequent screening examinations. Because the most clinically relevant result of interpretation is the subsequent diagnostic action to be taken, we also evaluated the variability in radiologists’ recommendations for further evaluation of the abnormality.
Materials and Methods
Subjects
All subjects were enrolled in the National Lung Screening Trial (NLST) (http://www.cancer.gov/nlst, clinical trials.gov identifier NCT00047385). The rationale and design of the trial and the details of screening CT have been previously described (6,7). Each subject consented to the use of de-identified images for research purposes at the time of enrollment. The mean age (±standard deviation) of the 100 subjects was 62 years ± 5.0. There were 62 (62%) men (mean age, 63 years ± 4.9) and 38 (38%) women (mean age, 61 years ± 4.9).
Case Selection and Presentation
Cases were retrospectively selected from more than 15 000 NLST screening CT examinations performed between September 2003 and August 2005 at the 10 NLST–Lung Screening Study screening centers, approximately 1 year (follow-up scans) after the initial screening examination (baseline scans). Eligible cases for the current study included all follow-up CT examinations in which the original NLST interpretation described a noncalcified nodule (NCN) measuring at least 4.0 mm that was judged to be present at baseline (the nodule seen at baseline could have been smaller or larger than 4.0 mm). Nodules interpreted by the original reader as showing growth or change in margins and/or attenuation, which were relatively rare in the overall NLST, were oversampled to achieve an a priori case distribution (on the basis of the original reader’s assessment) as shown in Table 1; a random number generator was used to select cases within each stratum. In all cases, CT was performed with multidetector scanners with at least four detectors and a low radiation dose. CT acquisition parameters included 120–140 kVp and 20–60 effective mAs (milliampere seconds/pitch, where pitch is calculated as table feed rate/[number of detectors × detector collimation]). Reconstructed section thickness was 2.5 mm or less, and the section interval was contiguous or overlapping in the transverse plane. There were no differences in the section thickness and interval in the two CT examinations of any given participant.
Table 1.
Sampling Plan of Nodules
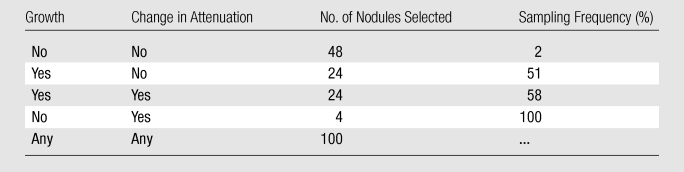
Note.—Growth and change in attenuation are based on the original NLST interpretation.
Two NLST radiologists with more than 15 years of experience, who were not readers in the current study, were responsible for image selection. The original reader interpretation describing the location of the chosen NCN (lung lobe and CT image number) was available. On the basis of this information, a limited number of images in which the selected NCN was visible, as well as at least one image above and below it, were selected from baseline and follow-up CT scans. All protected health information and screening site identifiers were removed from the images. To optimize reader efficiency and consistency in the evaluation of same nodule, the specific abnormality to be evaluated was marked with an arrow on one of the follow-up CT scan images (Fig 1). In addition to selecting images, the two radiologists also examined the image sets obtained at baseline and follow-up to evaluate whether the nodule seen at follow-up was in fact present at baseline as well as the accuracy of image selection depicting the nodule in question in both examinations.
Figure 1a:
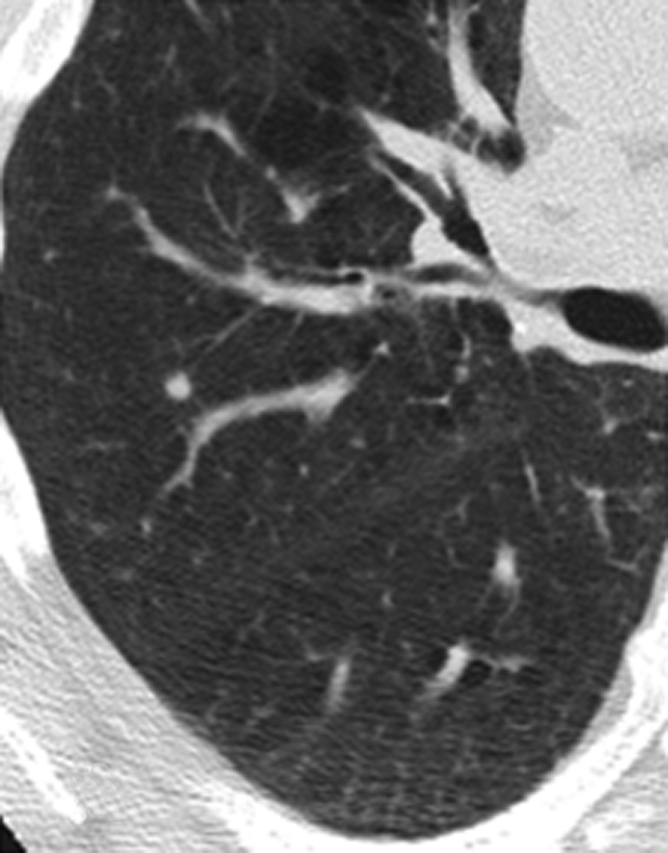
Representative CT scans obtained in a study participant at (a) baseline and (b) 1-year follow-up. The nodule to be evaluated is identified with an arrow.
Figure 1b:
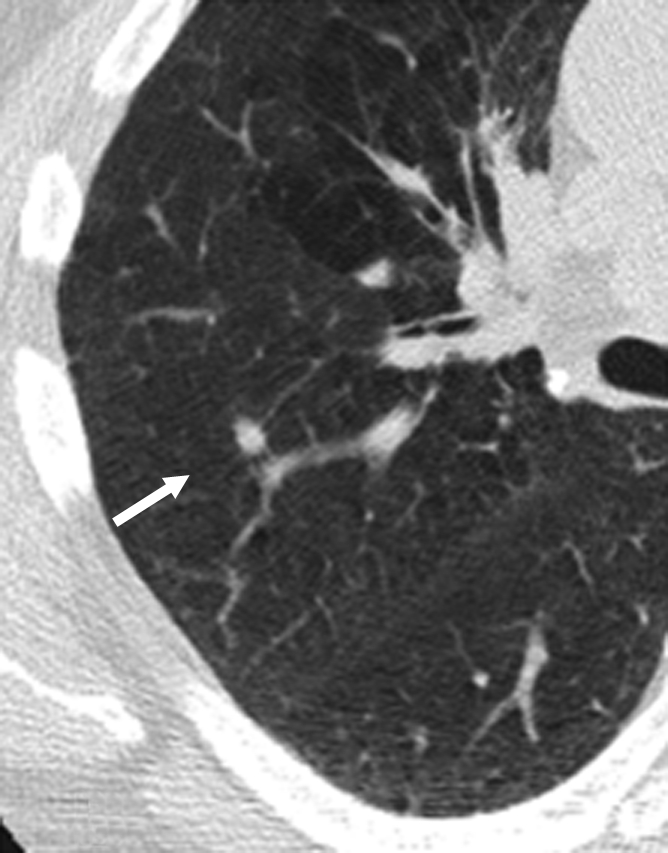
Representative CT scans obtained in a study participant at (a) baseline and (b) 1-year follow-up. The nodule to be evaluated is identified with an arrow.
Image Viewing and Readers
The image sets were loaded into a clinical picture archiving and communication system (Centricity; GE Medical Systems, Waukesha, Wis) with a two-monitor diagnostic workstation that allowed side-by-side display of CT scans. All traditional CT workstation tools, including electronic ruler, magnification, image scrolling, and window level and/or width adjustment, were available. Before each reading session, the monitors were calibrated according to American College of Radiology electronic image display standards. Each reader was provided with instructions for the use of the workstation, and a demonstration of the system and tools was performed before the reading session. Cases were displayed in a predetermined randomized order, which was the same for each reader. To ensure that viewing conditions were as uniform as possible, readers traveled to a single location to perform the reading. The readers were instructed to follow the same approach they use when reading the screening CT scans for the NLST at their own institution.
Nine radiologists, one each from nine of the 10 screening centers of the Lung Screening Study, comprised the test readers (Table E1, online). The readers had 12–42 years (mean, 23.6 years ± 10.4) of experience in thoracic imaging (including CT). Eight radiologists had been interpreting the NLST CT scans since the beginning of the trial, and one radiologist had been interpreting the scans for 1 year. Six radiologists practiced in an academic setting as thoracic radiology subspecialists and three were in private practice. All readers had reviewed an NLST CT interpretation training slide presentation (produced by American College of Radiology Imaging Network radiologists who participated in the NLST) before reading any scans from the NLST CT examinations (4).
Data Collection
Abnormalities were recorded by readers on a modified version of the standard NLST screening form. Bidimensional measurements (to the nearest millimeter) of the nodule at each examination (baseline and follow-up) were recorded, as were the nodule’s dominant attenuation pattern (solid, ground glass, mixed, fat, or other) and edge characteristics (smooth, spiculated, poorly defined). Readers were asked to judge whether the nodule seen at follow-up was present at baseline. If so, they recorded whether nodule size, attenuation, or margins had changed from baseline to follow-up. Readers were allowed to choose “unable to determine” for any of the variables. In addition, the confidence level of determining the presence or absence of change in these three parameters was rated as follows: definitely no change, probably no change, uncertain, probable change, and definite change.
Per the NLST protocol, the follow-up examinations were interpreted as (a) a positive screening result (NCN ≥4.0 mm in greatest transverse dimension) if there was an abnormality suspicious for lung cancer, (b) a positive screening result if there was an abnormality suspicious for lung cancer but no substantial change, or (c) a negative screening result if there were minor abnormalities not suspicious for cancer; the last choice was allowed if a reader considered the nodule to be smaller than 4.0 mm or calcified. Readers were also asked to provide recommendations for follow-up, which included continuation or routine screening without any intervention (no follow-up), repeat low-dose CT at a specified interval before the next annual screening examination (low-level follow-up), or a diagnostic imaging study (eg, diagnostic chest CT or CT positron emission tomography [PET]), lung biopsy, or other method specified by the reader (high-level follow-up).
The NLST did not prescribe specific algorithms for the follow-up evaluation of patients with a positive screening examination, and the readers’ recommendations for follow-up were based on current standards of clinical practice. To gain insight into reasons for variability in follow-up recommendations, a survey of different scenarios of NCN was circulated after all of the study readings were performed. Readers were asked to mark their usual choice of follow-up recommendation for each scenario (Fig E1, online).
Lung cancer diagnosis obtained within a year of follow-up CT was available for the cases included in this study.
Data Analysis
We analyzed the rates at which readers judged that nodules had grown or had a change in attenuation or margins (which constituted a positive category a screening examination as mentioned earlier) and warranted various follow-up recommendations. Coefficients of variation for these rates were calculated as the standard deviation of rates across readers divided by the mean; they were multiplied by 100 and expressed as percentages. Interrater agreement for categorical variables behind these rates was evaluated by using the multirater κ coefficient (8).
For continuous measurements such as size and change in size, the mean, standard deviation, and coefficient of variation were calculated for each relevant subject for the estimates across readers; these summary statistics were then averaged over patients. There was no objective, independent standard of reference with which to determine whether change had actually occurred. Therefore, in an attempt to analyze the variation in readers’ estimates of nodule size changes among nodules that showed real growth, the measurements obtained at baseline were subtracted from those obtained at follow-up and compared for those nodules recorded as having grown by most of the nine readers. Similarly, there was no standard of reference for determining the nodule characteristics of margins and attenuation. Therefore, the plurality of the readers’ assessments was used to classify each nodule’s attenuation and margin status.
For some nodules, a few readers did not agree that the nodule seen at follow-up was in fact present at baseline and so did not respond to the questions regarding nodule change. The analysis of the rates at which readers judged nodules to have grown or changed in attenuation or margins was restricted to those nodules that were unanimously considered to have been present at baseline so that all readers’ rates would be directly comparable. For all other analyses, including κ value and statistics for continuous measurements, all valid reader responses (ie, all responses where the individual reader considered the nodule to be present at baseline, regardless of what the other readers marked for that nodule) were used.
Results
On the basis of reviews during case selection and responses of the nine readers, five of the 100 nodules seen at follow-up were judged not to have been present at baseline. In 76 of the remaining 95 nodules, all nine readers agreed that the nodule seen at follow-up was present at baseline. In an additional 12 nodules, eight of the nine readers agreed that the nodule seen at follow-up was present at baseline. In the seven remaining nodules, five to seven readers agreed that the nodules were present at baseline. Nodule size was reported as the average size across all readers, with a mean nodule size across subjects of 7.0 mm ± 5.0 at baseline and 7.8 mm ± 5.6 at follow-up. Nodules ranged in size from 1.5 to 40 mm at baseline and from 2.6 to 42 mm at follow-up. On the basis of average size measurement across the nine readers, 12 nodules were smaller than 4.0 mm at baseline, 57 were 4.0–6.9 mm, 10 were 7.0–9.9 mm, and 16 were at least 10.0 mm. At follow-up, nine nodules were smaller than 4.0 mm, 52 were 4.0–6.9 mm, 13 were 7.0–9.9 mm, and 21 were at least 10.0 mm. In addition, 64 nodules (84%) had soft-tissue attenuation, eight (11%) had ground-glass attenuation, and four (5%) had mixed attenuation. Sixty-four percent of nodules had smooth margins, 12% had spiculated margins, and 24% had poorly defined margins.
Of the 76 nodules considered by all readers to be present at baseline, 26 (34%) were considered unchanged in size by all nine readers and 16 (21%) were so considered by eight of the nine readers. Eight of the 76 nodules (10%) were considered to have increased in size by all nine readers and another five (7%) were so considered by eight of the nine readers. In 21 of the 76 nodules (28%), at least two readers disagreed with the majority of readers regarding whether growth had occurred. The attenuation and margins were considered unchanged by eight or nine readers in 61 (80%) and 59 (78%) of the 76 nodules, respectively. Only one nodule was judged to have changed in attenuation and none of the nodules were judged to have a change in margins by at least eight of the readers. Among the nine readers, there was approximately a twofold range in percentage of nodules judged to have grown, a threefold range in the percentage judged to have changed in attenuation, and a 10-fold range in the percentage judged to have changed in margins (Table 2).
Table 2.
Number of Nodules Showing Changes in Growth, Attenuation, and/or Margins and Percentage of Positive Screening Results according to Reader
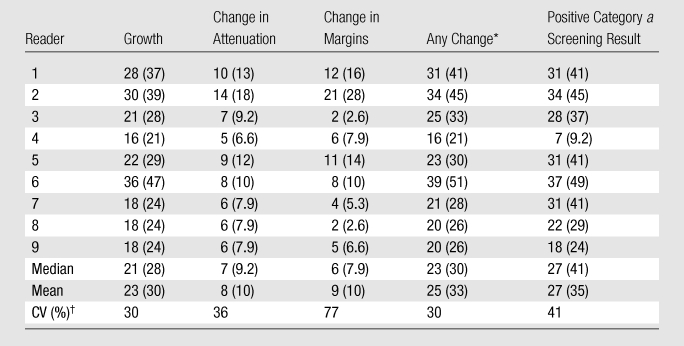
Note.—Except where indicated, data are numbers of nodules; numbers in parentheses are percentages. Data were obtained in the 76 nodules that were determined by all readers to be present at baseline.
Nodules with growth, change in attenuation, or change in margins.
CV = coefficient of variation (standard deviation/mean).
Table 3 displays κ coefficients on interrater agreement. Agreement on nodule growth was higher than that for change in attenuation or margins. The κ coefficient for screening result (positive category a screening result vs other screening result) of 0.51 was similar to that for growth. Readers were more confident of noted changes in size than in attenuation or margins. When readers judged growth to have occurred, it was considered a definite change 72% of the time; in contrast, changes in attenuation and margins were considered definite only 39% and 41% of the time, respectively. When no change was noted, it was considered definite 65% of the time for growth and approximately 75% of the time for attenuation and margins.
Table 3.
Interrater Agreement
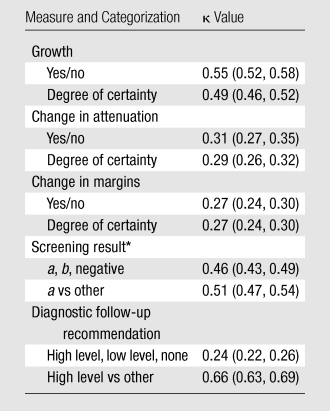
Note.—Degree of certainty was classified as definite change, probable change, uncertain, probably no change, and definitely no change. Numbers in parentheses are 95% confidence intervals.
a = positive screening result with an abnormality of at least 4.0 mm suspicious for lung cancer, b = positive screening result with an abnormality suspicious for lung cancer without substantial change.
Most readers (at least five of the nine) reported that growth had occurred in 22 of the 76 nodules; the mean longest diameter at follow-up in these 22 nodules was 13.7 mm ± 8.6 as recorded by the readers (Fig 2). The mean estimated increase in longest diameter was 3.0 mm. The average standard deviation of readers’ estimates of growth over the 22 cases was 1.8 mm (range, 0.5–4.4 mm), with an average coefficient of variance over these cases of 88% (range, 14%–360%). In six of these 22 cases, all nine readers agreed that the nodule grew at least 2.0 mm; the same opinion was reported by eight of the nine readers in an additional seven cases. In the remaining nine cases, however, at least three readers disagreed with the majority over whether a 2.0-mm increase had occurred.
Figure 2:

Reader estimates for the 22 nodules judged to have grown by most readers. Each vertical line gives the range of reader estimates for growth (longest diameter). Circles are mean estimates; squares are mean estimates ± 1 standard deviation. Numbers above the line are mean estimated nodule sizes (in millimeters) at follow-up.
Although the standard deviation for the variability in assessment of growth for all nodules was the same for the different nodule sizes, the mean percentage reported to show growth increased with size category. Thus, across readers, growth was reported at follow-up in a mean of 12.7% ± 10 (range, 2%–31%) of 4.0–7.0-mm nodules, 48% ± 8.4 (range, 38%–62%) of 7.0–9.9-mm nodules, and 67% ± 11 (range, 53%–82%) of nodules measuring at least 10 mm.
Over all readers and cases, high-level follow-up was recommended 21% of the time, low-level follow-up was recommended 34% of the time, and no diagnostic follow-up was recommended 45% of the time (Table 4). The rates of recommending high-level follow-up were similar across readers, whereas rates of recommending low-level or no follow-up were more variable. This variability in the rates of low-level and no follow-up is reflected in a low κ value of 0.24 for the three follow-up recommendation categories (Table 3). However, corresponding to the low degree of variability for the rates of high level follow-up, the κ statistic for the binary comparison of high-level follow-up versus other follow-up was higher, at 0.66.
Table 4.
Rates of Diagnostic Follow-up Recommendations across Readers
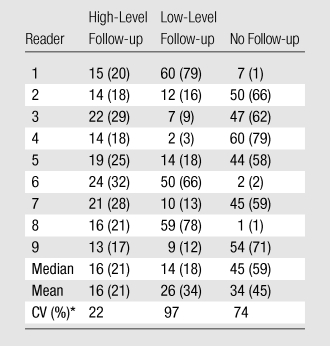
Note.—Except where indicated, data are numbers of nodules; numbers in parentheses are percentages. Data were obtained in the 76 nodules that were determined by all readers to be present at baseline.
CV = coefficient of variation (standard deviation/mean).
Analysis of the follow-up surveys of diagnostic recommendations revealed reasonable consistency in the recommendations for each scenario (Table 5). In general, readers recommended low-level follow-up when there was no or minimal change (scenarios 1–3 and 5) and progressively higher-level diagnostic categories when the scenario described a more substantial change (eg, scenarios 4 and 6–8). Analysis of interrater agreement for these scenarios revealed a κ value of 0.63.
Table 5.
Results of Follow-up Survey of Diagnostic Recommendations
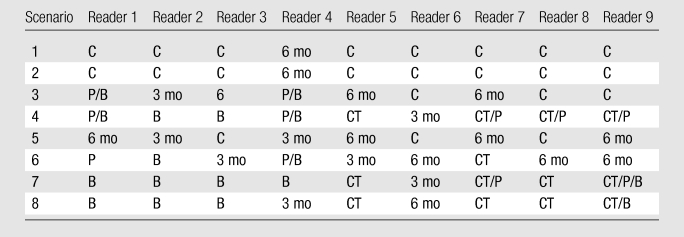
Note.—C = continue screening (no follow-up); 3 mo and 6 mo = thin-section CT at 3 and 6 months, respectively (low-level follow-up); B = biopsy, CT = diagnostic CT, and P = FDG-PET (all of which are considered high-level follow-up). See Figure E1 (online) for definitions of scenarios.
Eleven NCNs were diagnosed as cancers within a year of the follow-up CT examination. On average, 90% of readers reported detecting growth (range, 80%–100% across readers) for these nodules and reported detecting any change (in size, attenuation, or margins) an average of 97% of the time (range, 91%–100%).
Discussion
Because the case selection was based on the original readers’ interpretations, the study readers did not agree as to whether the nodule seen at follow-up CT was present at the baseline examination or whether the nodule was at least 4.0 mm. The lack of uniform agreement as to the presence of a nodule at CT screening examinations for lung cancer was previously described (4,5). Because the purpose of the current study was to assess agreement with regard to change in a nodule, it was necessary to use a data set in which all readers identified the nodule on both scans and exclude some of the selected cases from the analysis. We did not specifically investigate the reasons for disagreement about the presence of the nodule at baseline. However, factors such as differences in section position were not responsible because the readers were asked to judge such and did not indicate their presence in any of the excluded cases. Our findings demonstrated that agreement on nodule growth was similar to agreement on interpretation of screening result on prevalence CT screening examinations (4). The κ values for reader agreement on nodule growth and CT screening result (positive category a screening result vs other screening result) of 0.55 and 0.51, respectively, were similar to the values of 0.58 and 0.61 found in a previous study (4) and may be considered indicative of moderate to substantial agreement (9). The κ values for changes in attenuation and margins (0.31 and 0.27, respectively) were considerably lower, in the range considered indicative of fair agreement (9). Moreover, the κ coefficient was higher for confidence in determining growth than for confidence in determining attenuation and margin changes, which implies that readers found judging change in nodule size to be more reliable than change in attenuation or margins. Therefore, most readers appear to have relied primarily on growth to judge the presence of change. Indeed, the κ value for screening result (positive category a screening result vs other screening result) of 0.51 was the same as that for growth of the nodule. The lower agreement on change in attenuation and/or margins likely prevented agreement on the screening result from being higher. It is reassuring that reader agreement for change among the small number of cancers was very high.
Previous studies have demonstrated that interobserver variability in bidimensional CT measurements of lung nodules may be substantial, particularly for nodules smaller than 10 mm and those with irregular or ground-glass attenuation (2,3,10,11). Our finding of suboptimal agreement on nodule growth is likely a reflection of this measurement variability at each time point. It has been suggested that computerized methods of volumetric measurements of lung nodules is superior to bidimensional measurements, and estimation of volume doubling time is reliable in differentiating benign from malignant nodules in intervals as short as 30 days (12,13). The NLST did not use computer-aided methods for the measurement of lung nodules because they were not universally available at the different trial centers and lacked thorough validation and Food and Drug Administration approval at the time the trial was designed. More recent evidence suggests that there is also variability in computerized volumetry, with variations resulting from several sources including computer algorithm, type of scanner used, scan pitch, and reconstruction algorithm (14). Even with use of the same scanner and technique, significant differences in the volume of lung nodules scanned more than 1 minute apart have been found, suggesting that automated serial measurements may be affected by factors such as differences in volume averaging and attenuation of the lung surrounding the nodule (15).
The radiologist’s follow-up recommendation is probably a more important end result of serial CT screening interpretation than is the assessment of change. Reader agreement on the three categories of follow-up recommendation (κ = 0.24) was lower than that for the assessment of change. However, agreement as to whether high-level follow-up was needed was substantial (κ = 0.66) and greater than agreement on changes. A possible explanation for these findings is that readers were most focused on the binary decision of whether high-level follow-up was needed. If high-level follow-up was deemed unnecessary, readers may have been less concerned about making a distinction between recommending low-level follow-up and no follow-up, knowing that another screening examination would be performed in 1 year even if no other diagnostic action is taken. Responses to the hypothetical scenarios suggest that the variation in follow-up recommendations is related to differences in underlying clinical approaches adopted by the various readers. Some readers appear to be generally aggressive; for example, reader 4 always recommended a more aggressive follow-up for all scenarios compared with more conservative readers 5 and 6. There was also variability in the choice of procedure in a given level of category; some readers favored biopsy, whereas others more readily suggested PET. Similar variability in radiologists’ threshold of concern and recommendation for high-level diagnostic follow-up has also been described with mammography (16–18).
The recommended diagnostic algorithms for small NCNs have changed over time owing to advances in CT technology (eg, increased use of multidetector CT and thin-section scanning) and increased experience with the natural history of subcentimeter NCNs (19,20). These changing guidelines may have contributed to less-consistent follow-up recommendations by readers. Although the implementation of specific diagnostic algorithms may reduce variability inherent in radiologists’ individual biases and practice styles, the choice of diagnostic algorithm is still based on detecting change in the lung nodule between two CT examinations, which may remain difficult to do consistently with the current state of technology.
This study has several limitations. The retrospective review of imaging studies is artificial, and readers may have behaved differently in a true clinical setting. Because readers traveled to a central reading location, time constraints limited the reading task to 1 day; although a pretest estimate of the time necessary to interpret one set of CT images was only 3–4 minutes, visual and mental fatigue may have been a factor. Additional postprocessing with use of maximum intensity projection and multiplanar reconstruction may have helped lower the reader variability. However, these postprocessing methods were not used in NLST and therefore such images were not part of the image library from which the study images were retrieved. In addition, the use of thinner sections in selected situations, automated computer-aided diagnosis measurements, training to follow a standard approach for selecting an image to measure, and image magnification may have helped reduce variability. However, because our study did not test potential methods with which to reduce variability, we can only speculate. Finally, the lack of an independent reference standard for true physical change in the nodules was also a limitation. Although this does not affect the ability to assess reader variability, it limited our ability to accurately define the characteristics of the set of test cases.
In conclusion, the reader performance and variability of interpretation of an NCN at 1-year follow-up CT is very similar to the variability in nodule classification at baseline CT. Reader agreement on nodule growth and screening results was moderate to substantial. Although the agreement between readers for follow-up recommendations was lower, it improved when those recommendations were dichotomized into high-level follow-up versus other forms of follow-up.
Advances in Knowledge.
In this study in which a selected set of CT scans obtained at baseline were compared with those at 1-year follow-up in lung cancer screening participants with noncalcified lung nodules measuring at least 4 mm, reader agreement on the presence or absence of nodule growth was moderate, with a κ coefficient of 0.55.
Agreement on the need for high-level follow-up was good, with a κ coefficient of 0.66.
Agreement on changes in a small subset of proved lung cancer cases was very high, with readers detecting change 97% of the time on average.
Implications for Patient Care.
In lung cancer screening, the presence or absence of a change in the size of noncalcified lung nodules appears to be the most important consideration in detecting change and making follow-up recommendations; reader agreement for those determinations seems acceptable but could be improved.
Improvements in detecting growth in nodule size may also improve choice of recommendations for diagnostic follow-up.
Disclosures of Potential Conflicts of Interest: S.S. Financial activities related to the present article: none to disclose. Financial activities not related to the present article: is on the GE Imaging in Healthcare Advisory Board. Other relationships: none to disclose. P.P. Financial activities related to the present article: none to disclose. Financial activities not related to the present article: none to disclose. Other relationships: none to disclose. N.S.F. Financial activities related to the present article: none to disclose. Financial activities not related to the present article: none to disclose. Other relationships: none to disclose. D.S.G. Financial activities related to the present article: none to disclose. Financial activities not related to the present article: none to disclose. Other relationships: none to disclose. K.G. Financial activities related to the present article: institution receives money for support for travel to meetings for the study or other purposes from the National Lung Screening Trial. Financial activities not related to the present article: none to disclose. Other relationships: none to disclose. Y.S. Financial activities related to the present article: none to disclose. Financial activities not related to the present article: none to disclose. Other relationships: none to disclose. P.H.N. Financial activities related to the present article: receives support for travel to meetings for the study or other purposes from COPD-NLST. Financial activities not related to the present article: none to disclose. Other relationships: none to disclose.
Supplementary Material
Received June 28, 2010; revision requested July 30; revision received September 8; accepted October 14; final version accepted November 9.
From the 2008 RSNA Annual Meeting.
Funding: This research was supported by the National Cancer Institute (contract N01-CN-25516).
Abbreviations:
- NCN
- noncalcified nodule
- NLST
- National Lung Screening Trial
References
- 1.Swensen SJ, Jett JR, Sloan JA, et al. Screening for lung cancer with low-dose spiral computed tomography. Am J Respir Crit Care Med 2002;165(4):508–513 [DOI] [PubMed] [Google Scholar]
- 2.Erasmus JJ, Gladish GW, Broemeling L, et al. Interobserver and intraobserver variability in measurement of non-small-cell carcinoma lung lesions: implications for assessment of tumor response. J Clin Oncol 2003;21(13):2574–2582 [DOI] [PubMed] [Google Scholar]
- 3.Bogot NR, Kazerooni EA, Kelly AM, Quint LE, Desjardins B, Nan B. Interobserver and intraobserver variability in the assessment of pulmonary nodule size on CT using film and computer display methods. Acad Radiol 2005;12(8):948–956 [DOI] [PubMed] [Google Scholar]
- 4.Gierada DS, Pilgram TK, Ford M, et al. Lung cancer: interobserver agreement on interpretation of pulmonary findings at low-dose CT screening. Radiology 2008;246(1):265–272 [DOI] [PubMed] [Google Scholar]
- 5.Leader JK, Warfel TE, Fuhrman CR, et al. Pulmonary nodule detection with low-dose CT of the lung: agreement among radiologists. AJR Am J Roentgenol 2005;185(4):973–978 [DOI] [PubMed] [Google Scholar]
- 6.Church TR; National Lung Screening Trial Executive Committee Chest radiography as the comparison for spiral CT in the National Lung Screening Trial. Acad Radiol 2003;10(6):713–715 [DOI] [PubMed] [Google Scholar]
- 7.Gohagan J, Marcus P, Fagerstrom R, et al. Baseline findings of a randomized feasibility trial of lung cancer screening with spiral CT scan vs chest radiograph: the Lung Screening Study of the National Cancer Institute. Chest 2004;126(1):114–121 [DOI] [PubMed] [Google Scholar]
- 8.Fleiss JL. Measuring nominal scale agreement among many raters. Psychol Bull 1971;76(5):378–382 [Google Scholar]
- 9.Landis JR, Koch GG. An application of hierarchical kappa-type statistics in the assessment of majority agreement among multiple observers. Biometrics 1977;33(2):363–374 [PubMed] [Google Scholar]
- 10.Reeves AP, Biancardi AM, Apanasovich TV, et al. The Lung Image Database Consortium (LIDC): a comparison of different size metrics for pulmonary nodule measurements. Acad Radiol 2007;14(12):1475–1485 [DOI] [PMC free article] [PubMed] [Google Scholar]
- 11.Revel MP, Bissery A, Bienvenu M, Aycard L, Lefort C, Frija G. Are two-dimensional CT measurements of small noncalcified pulmonary nodules reliable? Radiology 2004;231(2):453–458 [DOI] [PubMed] [Google Scholar]
- 12.Yankelevitz DF, Gupta R, Zhao B, Henschke CI. Small pulmonary nodules: evaluation with repeat CT—preliminary experience. Radiology 1999;212(2):561–566 [DOI] [PubMed] [Google Scholar]
- 13.Yankelevitz DF, Reeves AP, Kostis WJ, Zhao B, Henschke CI. Small pulmonary nodules: volumetrically determined growth rates based on CT evaluation. Radiology 2000;217(1):251–256 [DOI] [PubMed] [Google Scholar]
- 14.Gavrielides MA, Kinnard LM, Myers KJ, Petrick N. Noncalcified lung nodules: volumetric assessment with thoracic CT. Radiology 2009;251(1):26–37 [DOI] [PMC free article] [PubMed] [Google Scholar]
- 15.Goodman LR, Gulsun M, Washington L, Nagy PG, Piacsek KL. Inherent variability of CT lung nodule measurements in vivo using semiautomated volumetric measurements. AJR Am J Roentgenol 2006;186(4):989–994 [DOI] [PubMed] [Google Scholar]
- 16.Elmore JG, Wells CK, Lee CH, Howard DH, Feinstein AR. Variability in radiologists’ interpretations of mammograms. N Engl J Med 1994;331(22):1493–1499 [DOI] [PubMed] [Google Scholar]
- 17.Kerlikowske K, Grady D, Barclay J, et al. Variability and accuracy in mammographic interpretation using the American College of Radiology Breast Imaging Reporting and Data System. J Natl Cancer Inst 1998;90(23):1801–1809 [DOI] [PubMed] [Google Scholar]
- 18.Ciccone G, Vineis P, Frigerio A, Segnan N. Inter-observer and intra-observer variability of mammogram interpretation: a field study. Eur J Cancer 1992;28(6-7):1054–1058 [DOI] [PubMed] [Google Scholar]
- 19.Henschke CI, Yankelevitz DF, Naidich DP, et al. CT screening for lung cancer: suspiciousness of nodules according to size on baseline scans. Radiology 2004;231(1):164–168 [DOI] [PubMed] [Google Scholar]
- 20.MacMahon H, Austin JH, Gamsu G, et al. Guidelines for management of small pulmonary nodules detected on CT scans: a statement from the Fleischner Society. Radiology 2005;237(2):395–400 [DOI] [PubMed] [Google Scholar]
Associated Data
This section collects any data citations, data availability statements, or supplementary materials included in this article.