Radiologists with higher annual volumes had clinically and statistically significantly lower false-positive rates with similar sensitivities as their colleagues with lower annual volumes.
Abstract
Purpose:
To examine whether U.S. radiologists’ interpretive volume affects their screening mammography performance.
Materials and Methods:
Annual interpretive volume measures (total, screening, diagnostic, and screening focus [ratio of screening to diagnostic mammograms]) were collected for 120 radiologists in the Breast Cancer Surveillance Consortium (BCSC) who interpreted 783 965 screening mammograms from 2002 to 2006. Volume measures in 1 year were examined by using multivariate logistic regression relative to screening sensitivity, false-positive rates, and cancer detection rate the next year. BCSC registries and the Statistical Coordinating Center received institutional review board approval for active or passive consenting processes and a Federal Certificate of Confidentiality and other protections for participating women, physicians, and facilities. All procedures were compliant with the terms of the Health Insurance Portability and Accountability Act.
Results:
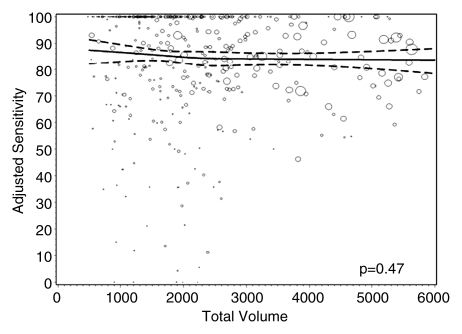
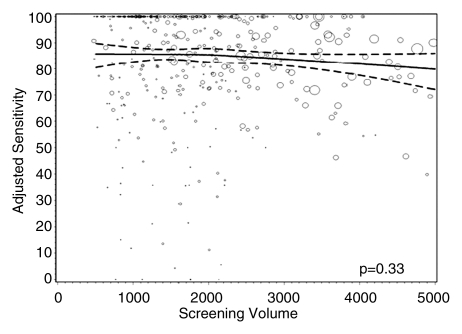
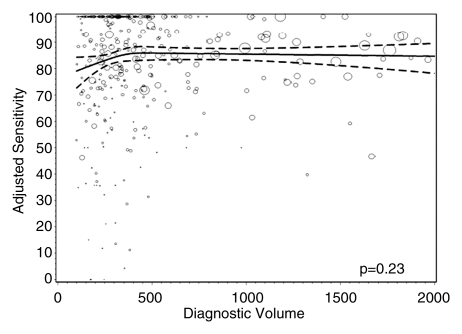
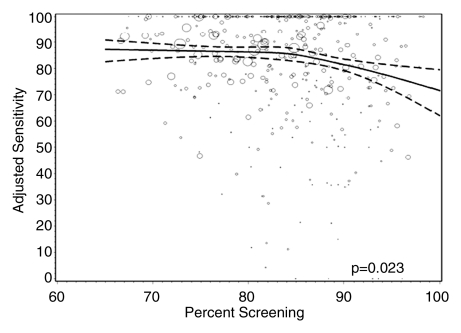
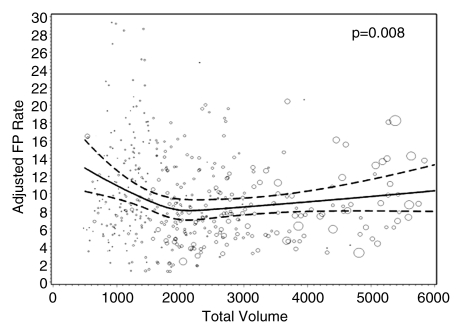
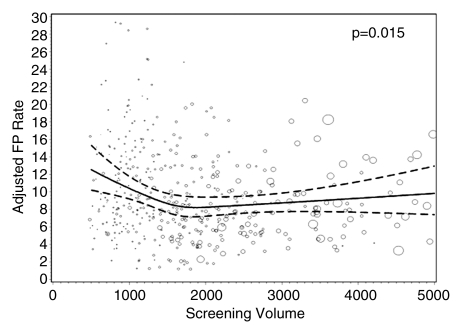
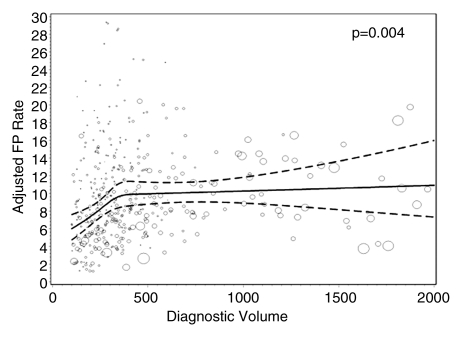
Mean sensitivity was 85.2% (95% confidence interval [CI]: 83.7%, 86.6%) and was significantly lower for radiologists with a greater screening focus (P = .023) but did not significantly differ by total (P = .47), screening (P = .33), or diagnostic (P = .23) volume. The mean false-positive rate was 9.1% (95% CI: 8.1%, 10.1%), with rates significantly higher for radiologists who had the lowest total (P = .008) and screening (P = .015) volumes. Radiologists with low diagnostic volume (P = .004 and P = .008) and a greater screening focus (P = .003 and P = .002) had significantly lower false-positive and cancer detection rates, respectively. Median invasive tumor size and proportion of cancers detected at early stages did not vary by volume.
Conclusion:
Increasing minimum interpretive volume requirements in the United States while adding a minimal requirement for diagnostic interpretation could reduce the number of false-positive work-ups without hindering cancer detection. These results provide detailed associations between mammography volumes and performance for policymakers to consider along with workforce, practice organization, and access issues and radiologist experience when reevaluating requirements.
© RSNA, 2011
Supplemental material: http://radiology.rsna.org/lookup/suppl/doi:10.1148/radiol.10101698/-/DC1
Introduction
Mammography is the only screening test that has been demonstrated in trials to reduce breast cancer mortality (1). An Institute of Medicine report (2) noted that while the technical quality of mammography has improved since implementation of the Mammography Quality Standards Act of 1992 (MQSA), optimal sensitivity and specificity have not yet been achieved (3). The report called for additional research on the relationship between interpretive volume and performance (2).
Compared with the United States, other countries with established screening mammography programs have lower false-positive rates but comparable cancer detection rates (CDRs) (4–6). Hypothesized reasons include the shorter screening intervals and the lower interpretive volume requirements in the United States (960 mammograms every 2 years—five- to 10-fold lower than in other countries) (7–9).
Mammography performance and volume findings, though inconsistent (10), generally suggest that higher-volume readers have lower false-positive rates with no sensitivity difference. Prior studies had limitations that could account for the inconsistencies, including different approaches for measuring volume (self report vs observational data), study designs, and settings (test set vs clinical practice), performance measures, covariates, and modeling methods. In a small Canadian study (11), abnormal interpretations were lower and CDRs were higher for radiologists performing between 2000 and 3999 interpretations annually compared with those for radiologists performing fewer than 2000 interpretations annually. Two conflicting studies used overlapping populations from the Breast Cancer Surveillance Consortium (BCSC) (12,13). Barlow et al (14) found that higher self-reported volume was associated with greater sensitivity and higher false-positive rates. Smith-Bindman et al (15) defined volume by measured number of BCSC examinations and found that higher volume was associated with lower false-positive rates, with no impact on sensitivity. Barlow et al included no validation of self-reported volume, and Smith-Bindman et al did not capture volume from mammograms interpreted at non-BCSC facilities. Inconsistent findings with overlapping study populations highlight how different conclusions may be drawn by using different analytic methods and measures.
Our purpose was to examine whether U.S. radiologists’ interpretive volume affects their screening mammography performance.
Materials and Methods
BCSC registries and the Statistical Coordinating Center have received institutional review board approval for active or passive consenting processes and a Federal Certificate of Confidentiality and other protections for participating women, physicians, and facilities. All procedures are compliant with the terms of the Health Insurance Portability and Accountability Act (16).
Sample Group
This study included six BCSC mammography registries (in California, North Carolina, New Hampshire, Vermont, Washington, and New Mexico) that have previously been described (12,13). BCSC registries collect information on mammography examinations performed at participating facilities in their defined catchment areas and link this information to state tumor registries or regional Surveillance Epidemiology and End Results programs to obtain population-based cancer data. Demographic and breast cancer risk factor data are collected by using a self-reported questionnaire completed at each mammography examination.
BCSC radiologists who interpreted screening mammograms between 2005 and 2006 were invited to complete a self-administered mailed survey, as previously described (17); 214 radiologists completed it. The survey asked radiologists to indicate all facilities (outside the BCSC) at which they interpreted mammograms between 2001 and 2005. Registry staff members contacted non-BCSC facilities and collected complete volume information for all radiologists. Our final study sample included 120 radiologists with a mean of 4.0 years of volume measures, resulting in 481 total reader-years of data for the analytic sample; 91% of radiologists (109 of 120) interpreted mammograms at only BCSC facilities. The demographic characteristics, time spent in breast imaging, and experience of the radiologists included in the analytic sample were similar to those of the radiologists included in the original sample (Table E1 [online]).
Interpretive volume, collected for each radiologist by facility and examination year, was summed across all facilities to obtain the annual volume for each radiologist. We collected total, screening, and diagnostic volumes for each year. We included mammograms in the volume estimate only if the radiologist was the primary reader. The radiologist’s indication for the examination was used to categorize screening and diagnostic volumes. Diagnostic examinations included additional evaluation of a prior mammogram, short-interval follow-up, or evaluation of a breast symptom or mammographic abnormality. Total volume included all screening and diagnostic examinations, with screening and diagnostic mammograms interpreted by the same radiologist on the same day counted as one examination. The latter definition differs from that used in the Breast Imaging Reporting and Data System audits (18), where mammograms performed on the same day contribute independently to volume. These two approaches yielded little difference in calculating total volume. For the 2.5% of mammograms with missing indications, we attributed their indication to screening or diagnostic volume on the basis of the proportion of screening mammograms where indications were observed for that reader.
For each year, we also computed the “screening focus” for each reader, defined as the percentage of total mammograms that were screening examinations.
All volume measures for each year were linked to screening performance in the following year (eg, volume in 2005 was linked to performance in 2006). Performance data were based solely on screening mammograms interpreted within BCSC facilities, because although volume data were available from non-BCSC facilities, linkage to cancer follow-up data was not possible for mammograms interpreted at non-BCSC facilities. Only 4% (19 of 481) of our study’s reader-years included radiologists who interpreted at non-BCSC facilities; among these readers, a mean of 54% of their total volume comprised non-BCSC mammograms.
Women given a diagnosis of invasive carcinoma or ductal carcinoma in situ (DCIS) within 1 year of the screening mammogram and before their next screening mammogram were included as representing breast cancer cases (19). Tumor characteristics were collected from tumor registries and pathology databases. We defined early stage cancers in three ways (19): (a) DCIS or invasive cancer that was 10 mm or smaller, (b) node-negative invasive cancer or DCIS that was 10 mm or smaller, and (c) node-negative invasive cancer or DCIS that was smaller than 15 mm.
Performance measures included sensitivity, false-positive rate, and CDR. Sensitivity was defined as the proportion of screening examinations interpreted as positive (defined as Breast Imaging Reporting and Data System category 0 [needs additional assessment], category 4 [suspicious abnormality], or category 5 [highly suggestive of malignancy]) among all women who were given a diagnosis of breast cancer within the 1-year follow-up period. False-positive rate was defined as the proportion of positive screening examinations among all women without a breast cancer diagnosis within the follow-up period. CDR was defined as the number of cancers detected per 1000 screening mammograms interpreted. Performance measures were derived from 783 965 screening examinations (in 476 079 unique women) interpreted between 2002 and 2006; these included mammograms in asymptomatic women with a routine screening indication.
Analysis
We calculated crude performance measures according to categoric versions of the four continuous volume measures. The association between continuous volume measures and screening performance was modeled by using restricted cubic smoothing splines (20), which permit a flexible shape while avoiding arbitrary cutpoints. We computed the smoothing splines with three knots placed at the 33rd, 50th, and 67th percentiles of the volume distribution. Volume distributions were heavily skewed with sparse information in the tails; therefore, we restricted each volume range before fitting the logistic regression models. Estimations were limited to a total volume of 6000 or fewer mammograms, a screening volume of 5000 or fewer mammograms, a diagnostic volume of 2000 or fewer mammograms, and a screening focus of 65% or greater to ensure that we had adequate information for stable estimates for model parameters.
To measure the potential tradeoff between sensitivity and false-positive rates, we calculated the number of women recalled for each cancer detected. To adjust for differing case-mix distributions across radiologists, we computed adjusted performance measures by using internal standardization (21). Internal standardization works by reweighting each mammogram according to the relative difference between the radiologist-specific distribution of potential confounders (age and time since last mammogram) and the corresponding distribution in the overall analytic sample. Intuitively, this process results in calculated performance measures for radiologists had their case mixes been the same as that in the overall population. Standardizing removes differences in the potential confounders across radiologists and therefore removes the potential impact of confounding. We then used generalized estimating equations to model the marginal association between the continuous adjusted performance measures and volume (20). Given the flexibility provided by the restricted cubic spline framework, the estimated mean adjusted performance is presented graphically, along with pointwise 95% confidence intervals (CIs), with the curves being interpreted directly as the mean adjusted performance as a function of the volume measure. P values for the estimated curves correspond to omnibus tests of whether there is any association between mean adjusted performance and volume. Under the null hypothesis, there would be no association, and the estimated relationship would be a flat line. We stratified by cancer status, fitting separate models for each performance measure by using a binary outcome based on the radiologist’s initial mammogram assessment of positive or negative. Robust sandwich standard error estimates were calculated to ensure appropriate accounting of correlation by the same radiologist (22).
Sensitivity analyses to examine the robustness of our results to various data and modeling assumptions included varying the number and location of the smoothing splines knots and individually excluding each registry to ensure that none overly influenced results.
All analyses were performed by using software (SAS, version 9.2; SAS Institute, Cary, NC), including the restricted cubic splines programming (23). Two-sided P values less than .05 were considered to indicate a statistically significant difference.
We simulated the effect of increasing minimum interpretive volume in the United States on the basis of an estimated 34 million women aged 40–79 years undergoing screening each year (24–26) by using software (Stata, version 11; Stata, College Station, Tex). Cancer status was assigned on the basis of a cancer rate of 5.0 cancers per 1000 mammograms. Each woman was randomly assigned to one of the study radiologists, with the selection probability proportional to the reader’s observed volume. We used our primary multivariate model results to obtain the estimated probability of recall, on the basis of the woman’s cancer status and the reader’s observed volume, then randomly generated a mammogram result on the basis of the estimated probability of a recall. To simulate increasing the volume requirements, we generated a second mammogram result for each woman. If the woman’s originally assigned radiologist had a volume greater than the threshold (ie, screening volume > 1500 mammograms), then the estimated probability of recall remained unchanged. If the original reader had a volume below the threshold, then the woman was randomly assigned to a reader with a volume above the threshold. We compared the simulated test results against cancer status to estimate the number of cancers that were correctly recalled and the number of false-positive tests before and after reader reassignment. We based cost estimates on the mean Medicare reimbursement (27) of $107 per screening examination. We were unable to provide any estimates of cost savings for fewer missed cancers, because these costs are not well documented.
Results
We studied 120 radiologists with a median age of 54 years (range, 37–74 years); most worked full time (75%), had 20 or more years of experience (53%), and had no fellowship training in breast imaging (92%) (Table 1). Time spent in breast imaging varied, with 26% of radiologists working less than 20% and 33% working 80%–100% of their time in breast imaging. Most (61%) interpreted 1000–2999 mammograms annually, with 9% interpreting 5000 or more mammograms. The highest-volume readers had a lower screening focus and were more likely to have been in clinical practice for 20 or more years and to have completed a breast imaging fellowship.
Table 1.
Characteristics of Radiologists according to Total Interpretive Volume
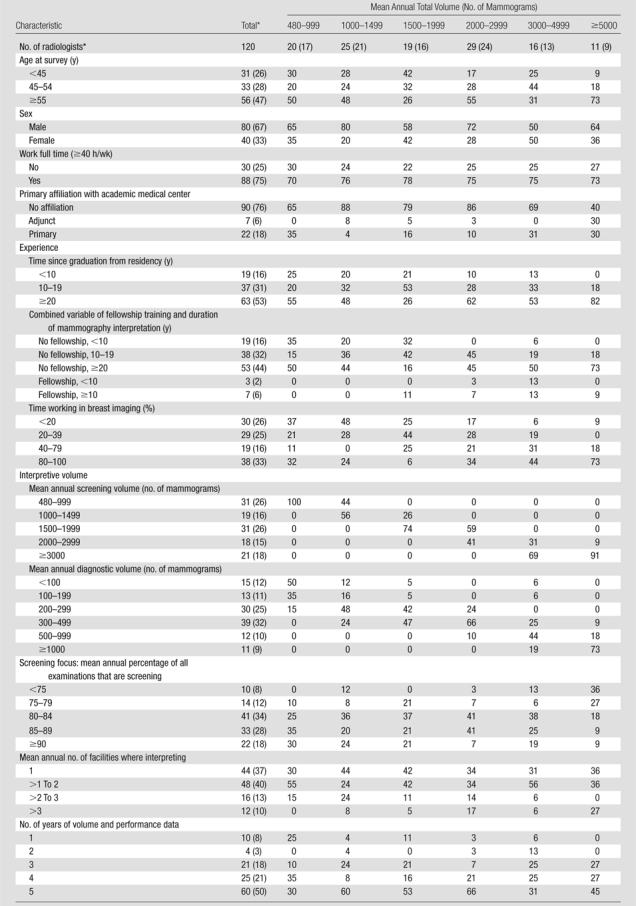
Note.—Unless otherwise specified, data are column percentages. There were missing values for the work full time question (n = 2), the primary affiliation with an academic medical center question (n = 1), the time since graduation from residency question (n = 1), and the time working in breast imaging question (n = 4).
Data are numbers of radiologists, with percentages in parentheses.
Mean annual screening volume ranged from 474 to 6255 mammograms (median, 1640 mammograms), and mean annual diagnostic volume ranged from 41 to 3315 mammograms (median, 305 mammograms). Mean annual screening volume was distributed as follows: 26% (31 of 120) of radiologists interpreted fewer than 1000 screening mammograms, 16% (19 of 120) of radiologists interpreted 1000–1499 screening mammograms, 26% (31 of 120) of radiologists interpreted 1500–1999 screening mammograms, 15% (18 of 120) of radiologists interpreted 2000–2999 screening mammograms, and 18% (21 of 120) of radiologists interpreted 3000 or more screening mammograms. Approximately 10% of radiologists interpreted fewer than 100 (15 of 120) or 1000 or more (11 of 120) diagnostic mammograms annually. Approximately 20% (24 of 120) of radiologists had a lower screening focus (<80% screening), and 18% (22 of 120) had a greater screening focus (≥90% screening). Radiologists with a lower screening focus had a higher total volume and were more commonly women, older, and more likely to have completed a breast imaging fellowship (Table E2 [online]).
Most of the screening mammograms included in the performance outcome measures had been obtained in women aged 40–59 years (60%), with fewer than 3% obtained in women younger than 40 years and fewer than 5% obtained in women 80 years of age or older (Table 2). Sixteen percent of women had a first-degree family history. Fewer than 5% of the mammograms were first mammograms, and comparison films were available for 86% of examinations. Characteristics of women with screening mammograms did not differ by radiologist total volume (Table 2). Characteristics of women with screening mammograms are detailed according to their radiologists’ screening volume, diagnostic volume, and screening focus in Tables E3–E5 (online), respectively.
Table 2.
Characteristics of Women with Screening Mammograms between 2002 and 2006 in Relation to their Radiologists’ Mean Annual Total Interpretive Volume
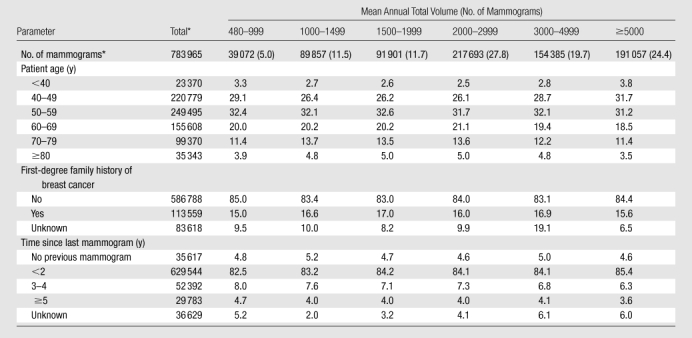
Note.—Unless otherwise specified, data are column percentages. Unknown percentages are not included in column percentages.
Data are numbers of mammograms, and numbers in parentheses are percentages.
A total of 3321 cancers were detected (Table 3). Radiologists detected a median of 25 cancers (interquartile range, 11–46) over the study period. Among invasive cancers, median tumor size did not vary by radiologists’ volume; overall median tumor size was 13 mm (range, <1 to 130 mm). The proportion of cancers detected at early stages did not vary across radiologist volume. Of 575 missed cancers, 507 (88%) were invasive, with a median size of 19 mm.
Table 3.
Characteristics of Detected Tumors according to Radiologist Total Interpretive Volume
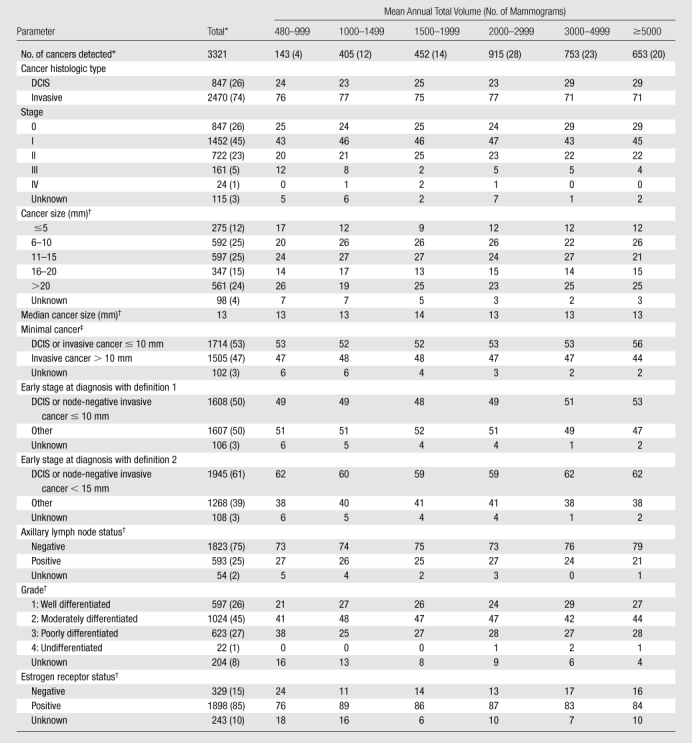
Note.—Unless otherwise specified, data are column percentages. Unknown percentages are not included in column percentages.
Data are numbers of cancers, with percentages in parentheses.
Invasive cancers only.
Defined as in the report by Rosenberg et al (19).
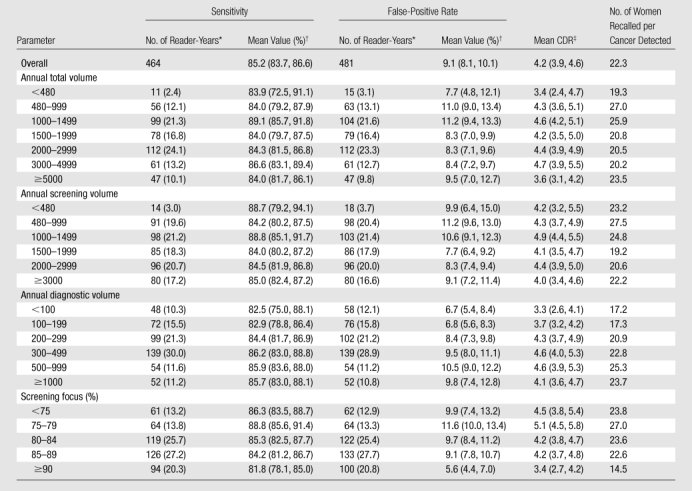
Unadjusted mean sensitivity was 85.2% (95% CI: 83.7%, 86.6%), false-positive rate was 9.1% (95% CI: 8.1%, 10.1%), and CDR was 4.2 cancers per 1000 mammograms (95% CI: 3.9, 4.6). Unadjusted screening sensitivity showed no consistent trends with any volume measure (Table 4), except that sensitivity decreased with higher screening percentage.
Table 4.
Screening Performance Measures of False-Positive Rate, Sensitivity, and Number of Women Recalled per Cancer Detected according to Radiologist Interpretive Volume
Note.—Volume represents number of mammograms.
Data in parentheses are percentages. Seventeen reader-years were not associated with any cancers and therefore did not contribute to the sensitivity estimate.
Data in parentheses are 95% CIs.
Number of cancers detected per 1000 screening mammograms.
Radiologists with lower screening volumes had higher false-positive rates, except radiologists who interpreted fewer than 480 mammograms annually, whose false-positive rates were lower but had wide 95% CIs. Interpreters with the highest diagnostic volume had higher false-positive rates. The lowest false-positive rates were among radiologists with a screening focus of 90% or greater (5.6% [95% CI: 4.4%, 7.0%]), and this same group had the lowest CDRs (3.4 [95% CI: 2.7, 4.2]). The highest false-positive rates and CDRs were among radiologists with a screening focus of less than 80% (10.7% [95% CI: 8.9%, 12.7%] and 4.8 [95% CI: 4.2, 5.4], respectively).
Overall, 22.3 women were recalled for each cancer detected—slightly fewer for radiologists with lower diagnostic volume and higher total and screening volumes. Radiologists with a screening focus of 90% or greater recalled a mean of 14.5 women for each cancer detected but had lower sensitivity than radiologists with lower screening focus percentages. Radiologists with a screening focus of less than 80% had higher sensitivity but recalled 23.8–27.0 women per cancer detected.
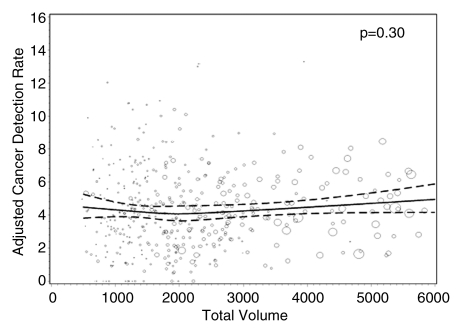
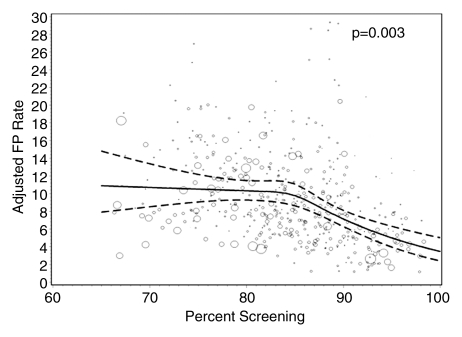
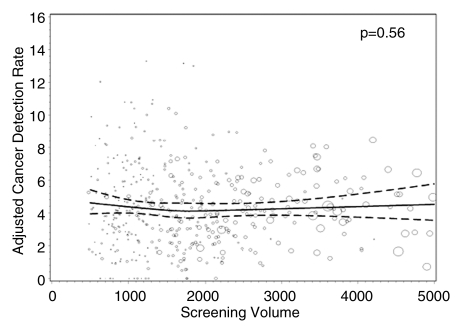
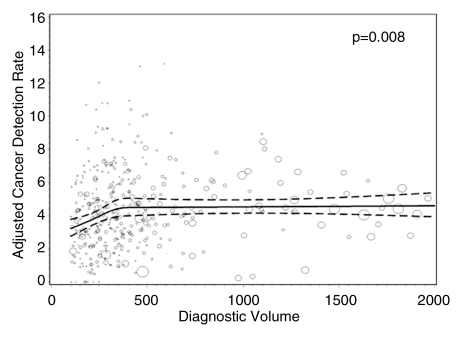
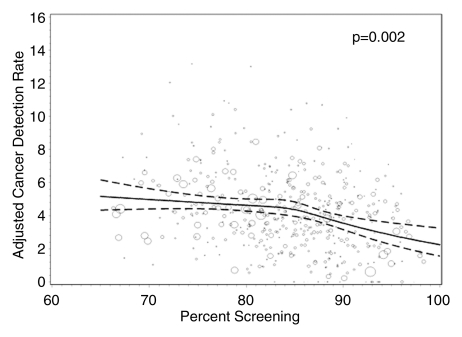
Figures 1–3 show the adjusted screening performance measures according to volume. Radiologists with lower volume and a greater screening focus had greater variability in all performance outcomes. Sensitivity estimates varied little across volume, with the exception of a lower sensitivity for radiologists with a greater screening focus (P = .023). False-positive rates were significantly lower for radiologists at neither the high nor the low extreme (mean, approximately 1500–4000 mammograms per year) for total (P = .008) and screening (P = .015) volumes. Radiologists with the lowest diagnostic volume also had lower false-positive rates (P = .004). Screening CDR was lower for low-volume diagnostic interpreters (P = .008) and for radiologists with greater screening focus (P = .002), but did not differ across total (P = .30) or screening volumes (P = .56).
Figure 1a:
Graphs show adjusted sensitivity according to interpretive volume, in terms of (a) total volume, (b) screening volume, (c) diagnostic volume, and (d) percentage of total mammograms that represented screening examinations. Sensitivity was adjusted for age and time since last mammogram. Lines = regression spline fit to adjusted rates; dashed lines = 95% CIs; and ○ = adjusted sensitivity, with size proportional to the number of total cancers. Smoothing splines had three knots placed at the 33rd, 50th, and 67th percentiles of the volume distribution; estimations were limited to total volume of 6000 or fewer mammograms, screening volume of 5000 or fewer mammograms, diagnostic volume of 2000 or fewer mammograms, and a screening focus of 65% or greater. Estimated mean adjusted performance is presented graphically, along with pointwise 95% CIs, with the curves being interpreted directly as the mean adjusted performance as a function of the volume measure. P values for the estimated curves correspond to omnibus tests of whether there is any association between mean adjusted performance and volume.
Figure 3a:
Graphs show adjusted CDRs according to interpretive volume, in terms of (a) total volume, (b) screening volume, (c) diagnostic volume, and (d) percentage of total mammograms that represented screening examinations. CDRs were adjusted for age and time since last mammogram. Lines = regression spline fit to adjusted rates; dashed lines = 95% CIs; and ○ = adjusted CDR, with size proportional to the number of screening mammograms used to measure performance. Smoothing splines had three knots placed at the 33rd, 50th, and 67th percentiles of the volume distribution; estimations were limited to total volume of 6000 or fewer mammograms, screening volume of 5000 or fewer mammograms, diagnostic volume of 2000 or fewer mammograms, and a screening focus of 65% or greater. Estimated mean adjusted performance is presented graphically, along with pointwise 95% CIs, with the curves being interpreted directly as the mean adjusted performance as a function of the volume measure. P values for the estimated curves correspond to omnibus tests of whether there is any association between mean adjusted performance and volume.
Figure 1b:
Graphs show adjusted sensitivity according to interpretive volume, in terms of (a) total volume, (b) screening volume, (c) diagnostic volume, and (d) percentage of total mammograms that represented screening examinations. Sensitivity was adjusted for age and time since last mammogram. Lines = regression spline fit to adjusted rates; dashed lines = 95% CIs; and ○ = adjusted sensitivity, with size proportional to the number of total cancers. Smoothing splines had three knots placed at the 33rd, 50th, and 67th percentiles of the volume distribution; estimations were limited to total volume of 6000 or fewer mammograms, screening volume of 5000 or fewer mammograms, diagnostic volume of 2000 or fewer mammograms, and a screening focus of 65% or greater. Estimated mean adjusted performance is presented graphically, along with pointwise 95% CIs, with the curves being interpreted directly as the mean adjusted performance as a function of the volume measure. P values for the estimated curves correspond to omnibus tests of whether there is any association between mean adjusted performance and volume.
Figure 1c:
Graphs show adjusted sensitivity according to interpretive volume, in terms of (a) total volume, (b) screening volume, (c) diagnostic volume, and (d) percentage of total mammograms that represented screening examinations. Sensitivity was adjusted for age and time since last mammogram. Lines = regression spline fit to adjusted rates; dashed lines = 95% CIs; and ○ = adjusted sensitivity, with size proportional to the number of total cancers. Smoothing splines had three knots placed at the 33rd, 50th, and 67th percentiles of the volume distribution; estimations were limited to total volume of 6000 or fewer mammograms, screening volume of 5000 or fewer mammograms, diagnostic volume of 2000 or fewer mammograms, and a screening focus of 65% or greater. Estimated mean adjusted performance is presented graphically, along with pointwise 95% CIs, with the curves being interpreted directly as the mean adjusted performance as a function of the volume measure. P values for the estimated curves correspond to omnibus tests of whether there is any association between mean adjusted performance and volume.
Figure 1d:
Graphs show adjusted sensitivity according to interpretive volume, in terms of (a) total volume, (b) screening volume, (c) diagnostic volume, and (d) percentage of total mammograms that represented screening examinations. Sensitivity was adjusted for age and time since last mammogram. Lines = regression spline fit to adjusted rates; dashed lines = 95% CIs; and ○ = adjusted sensitivity, with size proportional to the number of total cancers. Smoothing splines had three knots placed at the 33rd, 50th, and 67th percentiles of the volume distribution; estimations were limited to total volume of 6000 or fewer mammograms, screening volume of 5000 or fewer mammograms, diagnostic volume of 2000 or fewer mammograms, and a screening focus of 65% or greater. Estimated mean adjusted performance is presented graphically, along with pointwise 95% CIs, with the curves being interpreted directly as the mean adjusted performance as a function of the volume measure. P values for the estimated curves correspond to omnibus tests of whether there is any association between mean adjusted performance and volume.
Figure 2a:
Graphs show adjusted false-positive rates according to interpretive volume, in terms of (a) total volume, (b) screening volume, (c) diagnostic volume, and (d) percentage of total mammograms that represented screening examinations. False-positive rates were adjusted for age and time since last mammogram. Lines = regression spline fit to adjusted rates; dashed lines = 95% CIs; and ○ = adjusted false-positive rate, with size proportional to the number of screening mammograms used to measure performance. Smoothing splines had three knots placed at the 33rd, 50th, and 67th percentiles of the volume distribution; estimations were limited to total volume of 6000 or fewer mammograms, screening volume of 5000 or fewer mammograms, diagnostic volume of 2000 or fewer mammograms, and a screening focus of 65% or greater. Estimated mean adjusted performance is presented graphically, along with pointwise 95% CIs, with the curves being interpreted directly as the mean adjusted performance as a function of the volume measure. P values for the estimated curves correspond to omnibus tests of whether there is any association between mean adjusted performance and volume.
Figure 2b:
Graphs show adjusted false-positive rates according to interpretive volume, in terms of (a) total volume, (b) screening volume, (c) diagnostic volume, and (d) percentage of total mammograms that represented screening examinations. False-positive rates were adjusted for age and time since last mammogram. Lines = regression spline fit to adjusted rates; dashed lines = 95% CIs; and ○ = adjusted false-positive rate, with size proportional to the number of screening mammograms used to measure performance. Smoothing splines had three knots placed at the 33rd, 50th, and 67th percentiles of the volume distribution; estimations were limited to total volume of 6000 or fewer mammograms, screening volume of 5000 or fewer mammograms, diagnostic volume of 2000 or fewer mammograms, and a screening focus of 65% or greater. Estimated mean adjusted performance is presented graphically, along with pointwise 95% CIs, with the curves being interpreted directly as the mean adjusted performance as a function of the volume measure. P values for the estimated curves correspond to omnibus tests of whether there is any association between mean adjusted performance and volume.
Figure 2c:
Graphs show adjusted false-positive rates according to interpretive volume, in terms of (a) total volume, (b) screening volume, (c) diagnostic volume, and (d) percentage of total mammograms that represented screening examinations. False-positive rates were adjusted for age and time since last mammogram. Lines = regression spline fit to adjusted rates; dashed lines = 95% CIs; and ○ = adjusted false-positive rate, with size proportional to the number of screening mammograms used to measure performance. Smoothing splines had three knots placed at the 33rd, 50th, and 67th percentiles of the volume distribution; estimations were limited to total volume of 6000 or fewer mammograms, screening volume of 5000 or fewer mammograms, diagnostic volume of 2000 or fewer mammograms, and a screening focus of 65% or greater. Estimated mean adjusted performance is presented graphically, along with pointwise 95% CIs, with the curves being interpreted directly as the mean adjusted performance as a function of the volume measure. P values for the estimated curves correspond to omnibus tests of whether there is any association between mean adjusted performance and volume.
Figure 2d:
Graphs show adjusted false-positive rates according to interpretive volume, in terms of (a) total volume, (b) screening volume, (c) diagnostic volume, and (d) percentage of total mammograms that represented screening examinations. False-positive rates were adjusted for age and time since last mammogram. Lines = regression spline fit to adjusted rates; dashed lines = 95% CIs; and ○ = adjusted false-positive rate, with size proportional to the number of screening mammograms used to measure performance. Smoothing splines had three knots placed at the 33rd, 50th, and 67th percentiles of the volume distribution; estimations were limited to total volume of 6000 or fewer mammograms, screening volume of 5000 or fewer mammograms, diagnostic volume of 2000 or fewer mammograms, and a screening focus of 65% or greater. Estimated mean adjusted performance is presented graphically, along with pointwise 95% CIs, with the curves being interpreted directly as the mean adjusted performance as a function of the volume measure. P values for the estimated curves correspond to omnibus tests of whether there is any association between mean adjusted performance and volume.
Figure 3b:
Graphs show adjusted CDRs according to interpretive volume, in terms of (a) total volume, (b) screening volume, (c) diagnostic volume, and (d) percentage of total mammograms that represented screening examinations. CDRs were adjusted for age and time since last mammogram. Lines = regression spline fit to adjusted rates; dashed lines = 95% CIs; and ○ = adjusted CDR, with size proportional to the number of screening mammograms used to measure performance. Smoothing splines had three knots placed at the 33rd, 50th, and 67th percentiles of the volume distribution; estimations were limited to total volume of 6000 or fewer mammograms, screening volume of 5000 or fewer mammograms, diagnostic volume of 2000 or fewer mammograms, and a screening focus of 65% or greater. Estimated mean adjusted performance is presented graphically, along with pointwise 95% CIs, with the curves being interpreted directly as the mean adjusted performance as a function of the volume measure. P values for the estimated curves correspond to omnibus tests of whether there is any association between mean adjusted performance and volume.
Figure 3c:
Graphs show adjusted CDRs according to interpretive volume, in terms of (a) total volume, (b) screening volume, (c) diagnostic volume, and (d) percentage of total mammograms that represented screening examinations. CDRs were adjusted for age and time since last mammogram. Lines = regression spline fit to adjusted rates; dashed lines = 95% CIs; and ○ = adjusted CDR, with size proportional to the number of screening mammograms used to measure performance. Smoothing splines had three knots placed at the 33rd, 50th, and 67th percentiles of the volume distribution; estimations were limited to total volume of 6000 or fewer mammograms, screening volume of 5000 or fewer mammograms, diagnostic volume of 2000 or fewer mammograms, and a screening focus of 65% or greater. Estimated mean adjusted performance is presented graphically, along with pointwise 95% CIs, with the curves being interpreted directly as the mean adjusted performance as a function of the volume measure. P values for the estimated curves correspond to omnibus tests of whether there is any association between mean adjusted performance and volume.
Figure 3d:
Graphs show adjusted CDRs according to interpretive volume, in terms of (a) total volume, (b) screening volume, (c) diagnostic volume, and (d) percentage of total mammograms that represented screening examinations. CDRs were adjusted for age and time since last mammogram. Lines = regression spline fit to adjusted rates; dashed lines = 95% CIs; and ○ = adjusted CDR, with size proportional to the number of screening mammograms used to measure performance. Smoothing splines had three knots placed at the 33rd, 50th, and 67th percentiles of the volume distribution; estimations were limited to total volume of 6000 or fewer mammograms, screening volume of 5000 or fewer mammograms, diagnostic volume of 2000 or fewer mammograms, and a screening focus of 65% or greater. Estimated mean adjusted performance is presented graphically, along with pointwise 95% CIs, with the curves being interpreted directly as the mean adjusted performance as a function of the volume measure. P values for the estimated curves correspond to omnibus tests of whether there is any association between mean adjusted performance and volume.
In our simulation, on the basis of an estimated 34 million women aged 40–79 years undergoing screening each year (24–26), we found that increasing volume requirements could reduce the number of work-ups with a very small reduction in cancer detection. We estimate that increasing the annual minimum total volume requirements to at least 1000 mammograms would result in 43 629 fewer women being recalled, at the expense of missing 40 cancers while detecting 143 215 cancers. Shifting annual total volume requirements to at least 1500 mammograms would result in 92 838 fewer women being recalled, at the expense of missing 761 cancers while detecting 142 494 cancers. Basing volume requirements on annual screening volume and changing the minimum to at least 1000 mammograms would result in 71 110 fewer women being recalled, at the expense of missing 415 cancers while detecting 141 413 cancers; and changing the minimum to at least 1500 would result in 117 187 fewer women being recalled, at the expense of missing 361 cancers while detecting 141 467 cancers.
The direction and clinical interpretation of results did not change after we completed the sensitivity analyses described above.
Discussion
Current Food and Drug Administration regulations state that U.S. physicians interpreting mammograms must interpret 960 mammograms within the previous 24 months to meet continuing experience requirements. There has been interest in increasing radiologists’ continuing experience requirements on the assumption that higher volume requirements would improve overall interpretive performance, particularly sensitivity. However, the Institute of Medicine evaluated approaches to improving the quality of mammographic interpretation and concluded that data were insufficient to justify regulatory changes to the MQSA volume requirement and called for new studies (2).
Our study was designed to examine various measures of mammography interpretive volume in relation to screening performance outcomes. Contrary to our expectations, we observed no clear association between volume and sensitivity. We found that higher interpretive volume was associated with clinically and statistically important lower rates of false-positive results and numbers of women recalled per cancer detected—without a corresponding decrease in sensitivity or CDR. We also observed lower CDRs in radiologists with low diagnostic volumes. Performance across radiologists within volume levels had wide, unexplained variability, reinforcing the ideas that the volume-performance relationship is complex and several factors may influence it.
Screening performance is unlikely to be affected by volume alone, but rather by a balance in the interpreted examination composition. Radiologists with greater screening focus had significantly lower sensitivities and CDRs and significantly lower false-positive rates. We expected that radiologists performing more diagnostic work-ups would have better performance, because of their involvement in seeing a case from screening through work-up, including possible involvement with interventional procedures (22,28). Many large groups decentralize their screening: General partners interpret screening mammograms in office practices where they also interpret other types of imaging studies, while designated breast imagers focus on screening and diagnostic breast imaging examinations. Although our results suggest clinically important differences for radiologists with greater diagnostic volumes, we cannot establish cause and effect and did not evaluate the additional potential influence of performing interventional procedures.
The techniques and skills required for interpreting different images differ and will also generate different performance measures—for example, recognizing normal and benign variants is important for false-positive rates, whereas detecting subtle cancer findings is important for sensitivity. Screening is performed to accurately identify individuals who need additional work-up, whereas diagnostic imaging is performed to accurately evaluate areas of suspicion. A previous study (15) found that radiologists with a greater diagnostic focus have higher screening false-positive rates, perhaps because they are more accustomed to higher cancer prevalence. Interpretive volume collection and reporting would be required to change if volume requirements included minimal diagnostic interpretations.
The complexity of so many factors (eg, years of experience, number of cancers interpreted, screening vs diagnostic volume, training, and the innate skills of the interpreter) will continue to challenge researchers and policymakers. Does experience at high interpretive volume improve performance, or do radiologists who interpret more accurately choose to interpret high volumes? Radiologists who take 4 years to interpret 5000 screening mammograms may vary importantly in performance compared with radiologists who attain this volume in 1 year (22). Subspecialty training may also influence the experience-and-volume interplay. Our highest-volume radiologists included a mix of some with many years of experience and newer graduates with fellowship training, and within this group were varying volumes of screening and diagnostic interpretations.
Our results and conclusions are specific to screening performance, which comprises 80% of U.S. mammography. Whereas most prior studies examined only screening, we examined different volume measures and collected volume across all facilities where radiologists interpreted over 5 years. We modeled the association between volume interpreted in the prior year with performance in the following year, as opposed to including future volume measures in association with past performance. We based performance measures on actual practice, not test-set performance.
Statistical variability issues complicate measuring volume-performance outcomes. Cancer is rare in screening settings. In our study, radiologists detected a mean of 4.2 cancers per 1000 mammograms with a sensitivity of 85.2%. Because false-negative cases are rare (one per 1000 mammograms) and some are visible only in retrospect (29–32), it could take many years for a low-volume reader to miss a finding that an expert might identify. This is a smaller problem for high-volume readers. Low-volume radiologists see only a few cancers each year, which makes it difficult to measure sensitivity accurately in this group (33). Additionally, many believe that regular feedback improves performance, and radiologists who interpret any screening examination without the opportunity to see the results of their abnormal interpretations could not build on that experience. We could not explore the influence of feedback.
Breast cancer screening costs $3.6 billion annually in the United States (27). This does not include the costs of false-positive examination work-ups, which amount to approximately $1.6 billion per year, or avoid time, trouble, and anxiety for women. Our simulation estimated that the costs of false-positive findings would be reduced by $21.8 and $46.4 million (34,35) if the Food and Drug Administration required annual total volume requirements of greater than 1000 or fewer than 1500 mammograms, respectively. Basing volume requirements on annual screening volume and changing the minimum to greater than 1000 or fewer than 1500 mammograms would lower false-positive work-up costs by $35.6 million and $58.6 million, respectively.
There is no single “best” performance metric that can be used to help set policy. Our simulation results demonstrate that changing MQSA volume requirements or adding minimum numbers of screening and diagnostic examinations could result in modest improvements in some screening outcomes at a cost to others. An estimated 20% of radiologists interpret fewer than 1000 mammograms per year, but these account for only 6% of all U.S. mammograms (2). In our study, 17% of radiologists interpreted fewer than 1000 mammograms annually, and 38% interpreted fewer than 1500 mammograms annually. Workforce issues are crucial when considering interpretation requirements, because raising the minimum number of interpretations might cause some lower-volume radiologists to stop interpreting mammograms.
In conclusion, radiologists with higher annual volumes had clinically and statistically significantly lower false-positive rates with similar sensitivities as their colleagues with lower volumes. Radiologists with a greater screening focus had significantly lower sensitivities and CDRs and significantly lower false-positive rates. Recommending any increase in U.S. volume requirements will entail crucial decisions about the relative importance of cancer detection versus false-positive examinations and workforce issues, because changes could curtail workforce supply and women’s access to mammography. To achieve higher sensitivity while lowering false-positive rates, further studies need to elucidate the interrelationships between training, experience, volume, and performance measures. Several requirements may need to be considered simultaneously, such as minimum volume in addition to combined minimum performance requirements (36).
Advances in Knowledge.
We found no clear association between interpretive volume and sensitivity.
Performance across radiologists within volume levels had wide, unexplained variability, reinforcing the ideas that the volume-performance relationship is complex and several factors may influence it.
Screening performance is unlikely to be affected by volume alone, but rather by a balance in the interpreted examination composition; radiologists with a greater screening focus had significantly lower sensitivity (P = .023), cancer detection (P = .002), and false-positive rates (P = .003).
Radiologists with higher annual volumes had clinically and statistically significantly lower false-positive rates with similar sensitivities as their colleagues with lower annual volumes.
Implication for Patient Care.
Our results provide detailed associations between mammography volumes and performance for policymakers to consider along with workforce, practice organization, and access issues and radiologist experience when reevaluating requirements.
Disclosures of Potential Conflicts of Interest: D.S.M.B. No potential conflicts of interest to disclose. M.L.A. No potential conflicts of interest to disclose. S.J.P.A.H. No potential conflicts of interest to disclose. E.A.S. No potential conflicts of interest to disclose. R.A.S. No potential conflicts of interest to disclose. P.A.C. No potential conflicts of interest to disclose. S.H.T. No potential conflicts of interest to disclose. R.D.R. No potential conflicts of interest to disclose. B.M.G. No potential conflicts of interest to disclose. T.L.O. No potential conflicts of interest to disclose. B.S.M. Financial activities related to the present article: none to disclose. Financial activities not related to the present article: is a paid consultant on the Hologic Medical Advisory Board; institution received a grant from the National Institutes of Health for photoacoustic breast imaging; and received an honorarium from the University of Alabama at Birmingham as payment for lectures. Other relationships: none to disclose. L.W.B. No potential conflicts of interest to disclose. B.C.Y. No potential conflicts of interest to disclose. J.G.E. No potential conflicts of interest to disclose. K.K. No potential conflicts of interest to disclose. D.L.M. No potential conflicts of interest to disclose.
Supplementary Material
Acknowledgments
The collection of cancer incidence data this study used was supported in part by several state public health departments and cancer registries throughout the United States. For a full description of these sources, please see http://breastscreening.cancer.gov/work/acknowledgement.html. We thank the participating women, mammography facilities, and radiologists for the data they have provided for this study. We also thank Melissa Rabelhofer, BA, and Rebecca Hughes, BA, for their assistance in manuscript preparation and editing. A list of the BCSC investigators and procedures for requesting BCSC data for research purposes are provided at http://breastscreening.cancer.gov/.
Received August 24, 2010; revision requested October 19; revision received October 29; accepted November 10; final version accepted November 22.
Supported in part by the American Cancer Society and made possible by a generous donation from the Longaberger Company’s Horizon of Hope Campaign (grants SIRGS-07-271-01, SIRGS-07-272-01, SIRGS-07-274-01, SIRGS-07-275-01, SIRGS-06-281-01, and ACS A1-07-362), the Breast Cancer Stamp Fund, the Agency for Healthcare Research and Quality and National Cancer Institute (grant CA107623), and the National Cancer Institute Breast Cancer Surveillance Consortium (grants U01CA63740, U01CA86076, U01CA86082, U01CA63736, U01CA70013, U01CA69976, U01CA63731, and U01CA70040).
Funding: This research was supported by the Agency for Healthcare Research and Quality and National Cancer Institute (grant CA107623) and the National Cancer Institute Breast Cancer Surveillance Consortium (grants U01CA63740, U01CA86076, U01CA86082, U01CA63736, U01CA70013, U01CA69976, U01CA63731, and U01CA70040).
Abbreviations:
- BCSC
- Breast Cancer Surveillance Consortium
- CDR
- cancer detection rate
- CI
- confidence interval
- DCIS
- ductal carcinoma in situ
- MQSA
- Mammography Quality Standards Act of 1992
References
- 1.IARC Working Group on the Evaluation of Cancer-Preventive Strategies Breast cancer screening Lyon, France: IARC Press, 2002 [Google Scholar]
- 2.Institute of Medicine Improving breast imaging quality standards Washington, DC: National Academies Press, 2005 [Google Scholar]
- 3.Ichikawa LE, Barlow WE, Anderson ML, et al. Time trends in radiologists’ interpretive performance at screening mammography from the community-based Breast Cancer Surveillance Consortium, 1996-2004. Radiology 2010;256(1):74–82 [DOI] [PMC free article] [PubMed] [Google Scholar]
- 4.Smith-Bindman R, Chu PW, Miglioretti DL, et al. Comparison of screening mammography in the United States and the United kingdom. JAMA 2003;290(16):2129–2137 [DOI] [PubMed] [Google Scholar]
- 5.Elmore JG, Nakano CY, Koepsell TD, Desnick LM, D’Orsi CJ, Ransohoff DF. International variation in screening mammography interpretations in community-based programs. J Natl Cancer Inst 2003;95(18):1384–1393 [DOI] [PMC free article] [PubMed] [Google Scholar]
- 6.Hofvind S, Vacek PM, Skelly J, Weaver DL, Geller BM. Comparing screening mammography for early breast cancer detection in Vermont and Norway. J Natl Cancer Inst 2008;100(15):1082–1091 [DOI] [PMC free article] [PubMed] [Google Scholar]
- 7.Department of Health UK Breast Screening Programme, England: 1999-2000. http://www.dh.gov.uk/en/Publicationsandstatistics/Statistics/StatisticalWorkAreas/Statisticalhealthcare/DH_4015755. Updated February 8, 2007. Accessed August 25, 2009
- 8.Warren Burhenne L. Screening Mammography Program of British Columbia standardized test for screening radiologists. Semin Breast Dis 2003;6(3):140–147 [Google Scholar]
- 9.Perry N, Broeders M, de Wolf C, Törnberg S, Holland R, von Karsa L. European guidelines for quality assurance in breast cancer screening and diagnosis. Fourth edition—summary document. Ann Oncol 2008;19(4):614–622 [DOI] [PubMed] [Google Scholar]
- 10.Hébert-Croteau N, Roberge D, Brisson J. Provider’s volume and quality of breast cancer detection and treatment. Breast Cancer Res Treat 2007;105(2):117–132 [DOI] [PubMed] [Google Scholar]
- 11.Kan L, Olivotto IA, Warren Burhenne LJ, Sickles EA, Coldman AJ. Standardized abnormal interpretation and cancer detection ratios to assess reading volume and reader performance in a breast screening program. Radiology 2000;215(2):563–567 [DOI] [PubMed] [Google Scholar]
- 12.Ballard-Barbash R, Taplin SH, Yankaskas BC, et al. Breast Cancer Surveillance Consortium: a national mammography screening and outcomes database. AJR Am J Roentgenol 1997;169(4):1001–1008 [DOI] [PubMed] [Google Scholar]
- 13.National Cancer Institute Breast Cancer Surveillance Consortium Homepage. http://breastscreening.cancer.gov/. Updated November 16, 2009. Accessed March 5, 2010
- 14.Barlow WE, Chi C, Carney PA, et al. Accuracy of screening mammography interpretation by characteristics of radiologists. J Natl Cancer Inst 2004;96(24):1840–1850 [DOI] [PMC free article] [PubMed] [Google Scholar]
- 15.Smith-Bindman R, Chu P, Miglioretti DL, et al. Physician predictors of mammographic accuracy. J Natl Cancer Inst 2005;97(5):358–367 [DOI] [PubMed] [Google Scholar]
- 16.Carney PA, Miglioretti DL, Yankaskas BC, et al. Individual and combined effects of age, breast density, and hormone replacement therapy use on the accuracy of screening mammography. Ann Intern Med 2003;138(3):168–175 [DOI] [PubMed] [Google Scholar]
- 17.Elmore JG, Jackson SL, Abraham L, et al. Variability in interpretive performance at screening mammography and radiologists’ characteristics associated with accuracy. Radiology 2009;253(3):641–651 [DOI] [PMC free article] [PubMed] [Google Scholar]
- 18.American College of Radiology 1998 MQSA (Mammography Quality Standards Act) final rule released. Radiol Manage 1998;20(4):51–55 [PubMed] [Google Scholar]
- 19.Rosenberg RD, Yankaskas BC, Abraham LA, et al. Performance benchmarks for screening mammography. Radiology 2006;241(1):55–66 [DOI] [PubMed] [Google Scholar]
- 20.Hastie T, Tibshirani R, Friedman J. Basis expansions and regularization. In: The elements of statistical learning: data mining, inference and prediction New York, NY: Springer-Verlag, 2001; 127–133 [Google Scholar]
- 21.Greenland S. Introduction to regression modeling. In: Rothman KJ, Greenland S, eds. Modern epidemiology. 2nd ed. Philadelphia, Pa: Lippincott-Raven, 1998; 401–434 [Google Scholar]
- 22.Miglioretti DL, Haneuse SJ, Anderson ML. Statistical approaches for modeling radiologists’ interpretive performance. Acad Radiol 2009;16(2):227–238 [DOI] [PMC free article] [PubMed] [Google Scholar]
- 23.Harrell FE. General aspects of fitting regression models. In: Regression modeling strategies New York, NY: Springer-Verlag, 2001; 18–24 [Google Scholar]
- 24.US Census Bureau Table 1. Total Population by Age and Sex for the United States: 2000. http://www.census.gov/population/cen2000/phc-t08/phc-t-08.xls. Updated February 25, 2002. Accessed March 23, 2010
- 25.Carney PA, Dietrich AJ, Freeman DH, Jr, Mott LA. The periodic health examination provided to asymptomatic older women: an assessment using standardized patients. Ann Intern Med 1993;119(2):129–135 [DOI] [PubMed] [Google Scholar]
- 26.Centers for Medicare & Medicaid Services In the Medicare population in the year 2005, 11.4 million non-HMO women between the ages of 50 to 79 years of age received a reimbursed screening mammogram. http://www.cms.hhs.gov/PrevntionGenInfo/Downloads/mammography_age_2005.pdf. Accessed June 18, 2008
- 27.GE Healthcare Medicare reimbursement for mammography services. http://www.gehealthcare.com/usen/community/reimbursement/docs/MammographyOverview.pdf. Updated December 12, 2006. Accessed June 13, 2010
- 28.Beam CA, Conant EF, Sickles EA. Association of volume and volume-independent factors with accuracy in screening mammogram interpretation. J Natl Cancer Inst 2003;95(4):282–290 [DOI] [PubMed] [Google Scholar]
- 29.Moberg K, Grundström H, Lundquist H, Svane G, Havervall E, Muren C. Radiological review of incidence breast cancers. J Med Screen 2000;7(4):177–183 [DOI] [PubMed] [Google Scholar]
- 30.Britton PD, McCann J, O’Driscoll D, Hunnam G, Warren RM. Interval cancer peer review in East Anglia: implications for monitoring doctors as well as the NHS breast screening programme. Clin Radiol 2001;56(1):44–49 [DOI] [PubMed] [Google Scholar]
- 31.Saarenmaa I, Salminen T, Geiger U, et al. The visibility of cancer on previous mammograms in retrospective review. Clin Radiol 2001;56(1):40–43 [DOI] [PubMed] [Google Scholar]
- 32.Birdwell RL, Ikeda DM, O’Shaughnessy KF, Sickles EA. Mammographic characteristics of 115 missed cancers later detected with screening mammography and the potential utility of computer-aided detection. Radiology 2001;219(1):192–202 [DOI] [PubMed] [Google Scholar]
- 33.Drye EE, Chen J. Evaluating quality in small-volume hospitals. Arch Intern Med 2008;168(12):1249–1251 [DOI] [PubMed] [Google Scholar]
- 34.Burnside E, Belkora J, Esserman L. The impact of alternative practices on the cost and quality of mammographic screening in the United States. Clin Breast Cancer 2001;2(2):145–152 [DOI] [PubMed] [Google Scholar]
- 35.Esserman L, Cowley H, Eberle C, et al. Improving the accuracy of mammography: volume and outcome relationships. J Natl Cancer Inst 2002;94(5):369–375 [DOI] [PubMed] [Google Scholar]
- 36.Carney PA, Sickles EA, Monsees BS, et al. Identifying minimally acceptable interpretive performance criteria for screening mammography. Radiology 2010;255(2):354–361 [DOI] [PMC free article] [PubMed] [Google Scholar]
Associated Data
This section collects any data citations, data availability statements, or supplementary materials included in this article.


