

Abstract
We have assembled a nonredundant set of 144 protein–protein complexes that have high-resolution structures available for both the complexes and their unbound components, and for which dissociation constants have been measured by biophysical methods. The set is diverse in terms of the biological functions it represents, with complexes that involve G-proteins and receptor extracellular domains, as well as antigen/antibody, enzyme/inhibitor, and enzyme/substrate complexes. It is also diverse in terms of the partners' affinity for each other, with Kd ranging between 10−5 and 10−14M. Nine pairs of entries represent closely related complexes that have a similar structure, but a very different affinity, each pair comprising a cognate and a noncognate assembly. The unbound structures of the component proteins being available, conformation changes can be assessed. They are significant in most of the complexes, and large movements or disorder-to-order transitions are frequently observed. The set may be used to benchmark biophysical models aiming to relate affinity to structure in protein–protein interactions, taking into account the reactants and the conformation changes that accompany the association reaction, instead of just the final product.
Keywords: protein–protein interaction, molecular recognition, binding free energy, conformation changes, allostery
Introduction
Relating structure to function is a major objective of structural biology. The noncovalent interactions many proteins make with other biomolecules are essential to their function. Protein–protein interactions build assemblies that are as diverse as life itself.1–3 When a high-resolution structure is available, the interaction can be described in atomic details, but it is the affinity of the components for each other that determines whether the assembly actually exists under a given condition of temperature, pH, and protein concentration, and whether it is transient or permanent. For a binary complex, the binding affinity translates in physical–chemical terms into an equilibrium dissociation constant (Kd), which may be measured at equilibrium or derived from the reaction kinetics, and the related Gibbs free energy of dissociation ΔG. Kd measurements have been performed on many protein–protein complexes that also have a X-ray structure, and several models have attempted to correlate affinity to features observed in these structures. Although some have been very successful on small training sets,4,5 the published models did far less well on larger sets,6–10 and their predictive value remains poor.11
The bearing of such studies depends on the quality as well as the size of the set of experimental data on which the models are tested, and on the diversity of the biological systems they represent. Whereas early structural data concerned almost exclusively protease/inhibitor and antigen/antibody complexes, many more structures are now available, and the recent sets are more diverse. However, associating a crystal structure to biophysical measurements done in solution is an error-prone process, and the published sets contain many incorrect affinity data.11 Moreover, the structural data in these sets represent the complexes (the “bound” structures), but not their free components (the “unbound” structures). Therefore, the models based on them describe the thermodynamics of association reaction by its product only, ignoring the reactants and the structure changes they may undergo.
A benchmark set of validated Kd and ΔG data that can be reliably assigned to the bound and unbound structures of a complex should be of great value when modeling recognition. The one we present here is the product of collaboration between four research groups, checking each other's data. It contains 144 entries that represent many different biological systems with affinities that cover nine orders of magnitude in Kd, and structures that display a wide variety of conformation changes.
Results
The data
The starting point of the present study was the docking benchmark Version 4.0 (DB4.0), which contains protein data bank (PDB12) entries for 176 protein–protein complexes and their unbound components.13 The complexes are nonredundant, they have a X-ray structure solved at better than 3.25 Å resolution, and with the exception of a few antibodies, their unbound components have either a X-ray or a NMR structure.
We found affinity data in the literature for 144 protein–protein complexes; 130 are from DB4.0, and the rest is closely related to entries in it; seven replace entries for which we could not find a Kd, and seven are new. The experimental methods used to determine the Kd are highly dependent on the proteins and on their affinities. Surface plasmon resonance (SPR), isothermal calorimetry (ITC), and titration by fluorescence or other spectroscopic methods are all applicable if the Kd is in the micromolar to nanomolar range. Together, they yielded 75% of the data we retained; enzymatic inhibition studies yielded 14%. Kd values are usually reported in publications with standard errors of 20–50%, equivalent to 0.1–0.25 kcal mol−1 for ΔG. When Kd is below nanomolar, ITC is limited by its sensitivity, and SPR by the slow reaction kinetics that make the measurements less reliable. Moreover, each method has specific drawbacks and requirements, such as a reporter group in fluorimetry, protein immobilization in SPR, or the kinetic model of the reaction needed to convert an inhibition constant (Ki) into a Kd. About half of the entries in our set have corroborating values determined by two or more methods under similar conditions. They commonly differ by a factor of 2 for Kd, or 0.4 kcal mol−1 for ΔG, which is a more realistic estimate of the standard error than that obtained with a single method.
The discrepancy can be much greater when the experimental conditions differ. The dependence of Kd on temperature, ionic strength, and pH has been checked in a number of cases, which we will assume to be representative of the whole set. All the measurements we report except three have been done in the temperature range 18–35°C. The data on the dissociation enthalpy ΔH, determined either by ITC or the van't Hoff equation, suggest that the correction does not exceed a factor of 2 in this range (e.g., |ΔH| < 10 kcal mol−1). Changing the ionic strength in the range 0.1–0.5M can have a larger effect, but in general, pH is the most significant environmental factor. If ligand binding induces a pK shift in an acid or base group that has a pK near the pH of the experiment, that group will take or release protons as the complex forms, and thus, Kd will depend on the proton concentration. Changing the pH in the range 5.5–8.5, which covers 96% of our data, can change Kd by a factor of 10–50, and ΔG by 1.4–2.3 kcal mol−1, which largely exceeds any effect of temperature or ionic strength. Moreover, the dependence of Kd on pH is just one example of allosteric effects discussed below, by which the concentration of one ligand, proton in this case, changes the affinity of a protein for another ligand.
Classes of complexes and affinities
Of the 144 protein–protein complexes of our set, all but 7 fulfill the condition initially set for the docking benchmark, that the PDB should contain entries for both the assembly and its unbound components. The exceptions are antigen/antibody complexes that were included in DB4.0 even though the antibody has no unbound structure. In Table I, the set is broken into the same three functional classes as in the docking benchmark: (A) antibody/antigen, (E) enzyme containing, and (O) other complexes; subclasses are introduced in the latter two. In addition, the set is split into three categories based on Kd: high (Kd < 0.1 nM), medium (0.1 nM to 1 μM), and low affinity (>1 μM). They represent 14%, 63%, and 23%, respectively, of the cases. In addition, Table I mentions the presence of 9 noncognate complexes (see below) and provides the mean values of ΔG and their standard deviations in each class, calculated on the cognate complexes only.
Table I.
Classes of Complexes
| Number | Affinity classa | ΔG (kcal mol−1)b | ||||||
|---|---|---|---|---|---|---|---|---|
| Class | All | Noncognate | High | Medium | Low | Mean | S.D. | Large conformation changesc |
| A | ||||||||
| Antigen-antibody | 19 | 2 | 2 | 16 | 1 | 12.2 | 1.3 | 0 |
| E | ||||||||
| Enzyme/inhibitor | 40 | 4 | 17 | 22 | 1 | 13.8 | 2.3 | 7 |
| Other enzyme complexes | 21 | 1 | 0 | 12 | 9 | 9.2 | 1.9 | 7 |
| O | ||||||||
| G-proteins | 17 | — | 1 | 6 | 10 | 8.9 | 2.5 | 6 |
| Receptors | 13 | — | 1 | 11 | 1 | 11.5 | 2.1 | 4 |
| Miscellaneous | 34 | 2 | 0 | 22 | 12 | 9.3 | 2.2 | 11 |
| All | 144 | 9 | 20 | 90 | 34 | 11.0 | 2.9 | 35 |
High Kd < 10−10M, medium 10−6 to 10−10M, and low Kd > 10−6M.
Mean value and standard deviation excluding the noncognate complexes.
Complexes with I_rmsd > 1.5 Å.
Class A contains monoclonal antibodies, fairly similar in terms of their affinity for the protein antigens they were raised against. All but three of the 19 class A complexes are in the medium-affinity category; their Kd's are in the range 0.1–70 nM. The exceptions are the noncognate complex 2VIS (see below), which is of low-affinity, and two complexes with a high affinity. Fab BO2C11, which has a picomolar Kd for Factor VIII (1IQD), was not obtained by clonal selection in hybridoma cell cultures like the other antibodies in our sample; it is the product of a cell line derived from the memory B-cell repertoire of a patient with hemophilia A.14
Class E, enzyme-containing complexes, is highly heterogeneous in comparison to class A. However, when the complexes with inhibitors are set apart from those with substrates or regulatory subunits (“other enzyme complexes” in Table I), it becomes obvious that the former have a much higher affinity. Indeed, all but four of the high-affinity complexes are enzyme/inhibitor. Five have a Kd below 0.1 pM, at the lower limit of what can be reliably measured given the very low dissociation rate that such a Kd implies. These complexes, stable on a time scale of days or even months, implicate the protease trypsin, three nucleases, and uracyl-DNA glycosylase.
Class O (“other”) was introduced in the docking benchmark for convenience at a time where most of the available structural data concerned antigen/antibody and enzyme/inhibitor complexes.15 It has greatly expanded since then, and now comprises 64 complexes that perform all sorts of biological functions. Among them, 17 form a subclass that contains G-proteins. These proteins bind GTP and hydrolyze it to GDP; they play a central role in signal transduction, membrane traffic, and other cellular processes. They have many partners: GTPase activating proteins (GAPs) that enhance their GTPase activity, guanine nucleotide exchange factors that allow the GDP product to be released, protein kinases, etc. Only one of the complexes of this subclass is high-affinity (1I2M, Ran/RCC1); the others have Kd in the nanomolar to low micromolar range, consistent with functions that require the interaction to be transient on a time scale of seconds to minutes. Another subclass, with 13 members, contains cell surface receptors, present mostly as the extra cellular domain binding a cytokine or protein hormone. All but two are of medium-affinity. The 34 “miscellaneous” complexes that remain carry highly diverse functions: 12 are low-affinity, and two have Kd > 0.1 mM, at the upper limit of what can be reliably measured. These very low affinity complexes implicate ubiquitin (1S1Q) and the T-cell receptor (1AKJ). Two other low affinity complexes (1XD3, 2OOB) contain ubiquitin.
Cognate and noncognate protein–protein association
Table II lists nine pairs of entries representing closely related proteins that form complexes of a similar geometry, but with a very different Kd. The more affine in each pair is labeled as cognate, because in most cases, it is the one of biological relevance. Thus, the cognate partner of the Bacillus amyloliquefaciens inhibitor barstar, is the nuclease barnase produced by that bacterium, for which it has femtomolar affinity26; barstar also inhibits RNase SA from Streptomyces aureofaciens, but with nanomolar affinity only. The colicin/immunity protein system provides some remarkable examples of cognate vs. noncognate assemblies,27 one of which is cited in Table II and illustrated by Figure 1. The strain of Escherichia coli that makes colicin E9, endowed with a DNase activity, also produces the Im9 immunity protein that inhibits it very efficiently; a different strain produces the Im2 immunity protein, which has a much lower affinity for E9.29 Like the immunity proteins, the bovine pancreatic trypsin inhibitor (BPTI) has a femtomolar Kd for the cognate serine protease trypsin. BPTI also binds trypsinogen, the inactive precursor of trypsin,30 and it inhibits chymotrypsin, a related protease with a different specificity, but its affinity for these two proteins is five to eight orders of magnitude less than for trypsin. In all four pairs of enzyme/inhibitor complexes, sequence changes introduce several residue substitutions at the interface. In cytochrome peroxidase/cytochrome c, an enzyme/substrate complex, Kd changes by a factor of 6 only, when horse cytochrome c replaces the cognate yeast substrate, even though the sequence identity is only 35%. Perhaps more significantly, the stoichiometry of the crystalline complex changes from 1:1 to 2:1.31
Table II.
Cognate vs. Noncognate Complexes
| Cognate | Noncognate | ||||||
|---|---|---|---|---|---|---|---|
| PDB entry | Kd (M) | PDB entry | Kd (M) | ΔΔG (kcal mol−1) | References | ||
| Enzyme/inhibitor | |||||||
| 1BRS | Barnase/barstar | 5.0E−14 | 1AY7 | RNase SA/barstar | 1.0E−10 | 4.1 | 16 |
| 1EMV | Colicin E9/Im9 | 2.4E−14 | 2WPT | Colicin E9/Im2 | 1.5E−8 | 7.9 | 17 |
| 2PTC | Trypsin/BPTI | 6.0E−14 | 1CBW | Chymotrypsin/BPTI | 9.0E−9 | 7.3 | 18 |
| 2PTC | Trypsin/BPTI | 6.0E−14 | 2TGP | Trypsinogen/BPTI | 2.3E−6 | 10.5 | 19 |
| Enzyme/substrate | |||||||
| 2PCC | Yeast peroxidase/ yeast cyt c | 1.6E−6 | 2PCB | Yeast peroxidase/ horse cyt c | 1.0E−5 | 1.1 | 20,21 |
| Antigen/antibody | |||||||
| 2VIR | Flu hemagglutinin/ Fab HC19 | 1.0E−9 | 2VIS | Flu HA (T131I)/Fab HC19 | 4.0E−6 | 4.9 | 22 |
| 1P2C | Fab F10.6.6 | 1.0E−10 | 1MLC | Fab D44.1/lysozyme | 7E−8 | 3.9 | 23 |
| Miscellaneous | |||||||
| 1EFN | HIV-1 Nef/Fyn SH3 (R96I) | 3.8E−8 | 1AVZ | HIV-1 Nef/wild type Fyn SH3 | 1.6E−5 | 3.6 | 24 |
| 3BZD | TCR-Vβ/SEC3-1A4 variant | 9.6E−8 | 2AQ3 | TCR-Vβ/wt SEC3 | 1.2E−5 | 2.9 | 25 |
Figure 1.
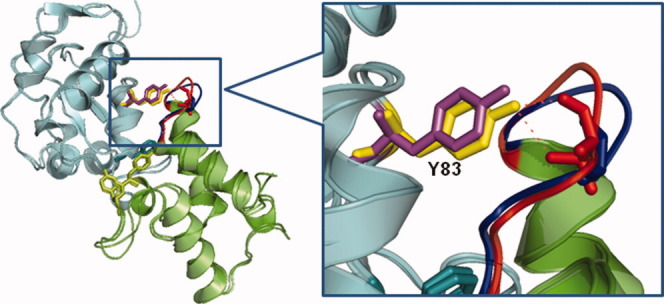
Cognate and noncognate colicin/immunity protein complexes. The DNase domain of colicin E9 (cyan) has a very high affinity for the Im9 immunity protein produced by the same E. coli strain (green), and a 106-fold lower affinity for Im2, produced by a different strain.17 The crystal structures of the cognate E9/Im9 (1EMV) and the noncognate E9/Im2 (2WPT) complexes indicate that the mode of assembly is essentially the same. The insert shows that, nevertheless, segment 22–30 of Im9 (red) interacting with Tyr83 of E9 undergoes a significant movement in Im2 (blue), where it has a different sequence.28
Table II also cites two systems in which a single residue substitution leads to a large change in Kd. Antibody HC19, raised against flu hemagglutinin, has a high affinity for the wild type protein, and a much lower one for a point mutant that allows the virus to escape neutralization by the antibody in cell cultures.22 Protein Nef of HIV-1 forms a complex with both the SH3 domain of Fyn, a tyrosine kinase that binds Nef poorly, and a variant in which a point substitution has been introduced to mimic Hck, which binds Nef much more tightly than Fyn.32 Here again, the stoichiometry in the crystal changes from 1:1 to 2:1 between the higher and the lower affinity complex. The mutation in Fyn was introduced by site-directed mutagenesis, which has been a standard method to study recognition and specificity for more than 20 years.33,34 Most of the substitutions made at a protein–protein interface in this way cause a loss of affinity, locating “hot spots” at the interface when the effect is large.35 However, a change in affinity can also point to a change in conformation, which can be assessed if the mutant structure has been determined in both the unbound and the bound state. This has been done for a few systems that are represented in this benchmark by the wild-type only: barnase/barstar, TEM1-BLIP, lysozyme/antibody, complement C3/Efb-C.36–39 For the mutants, we refer the reader to the publications, and to databases such as PINT, ASEdb, and PDBbind.40–42
Mutations that improve affinity as in Fyn SH3 are much less common, and therefore of particular interest. They play an essential part in the maturation of antibodies by allowing the affinity for the antigen to increase beyond the initial clonal selection step.43 The high affinity of antibody BO2C11 for Factor VIII mentioned above can be explained in this way.14 The effect of maturation on affinity has been analyzed in many systems, and its effect on structure, in several antibody/lysozyme complexes.23,44,45 One is cited in Table II: the low-affinity D44.1 and the high-affinity F10.6.6 monoclonal antibodies derive from the same germ-line genes, but F10.6.6 was raised after long-term exposure to the antigen.23 Table II contains another pair of complexes that is relevant to the immune system. When the superantigen SEC3 (Streptococcus exotoxin C3) binds to the Vβ chain of the T-cell receptor, the wild type protein has Kd > 1 μM; the 1A4 variant and other variants selected by phage display have a much better affinity.25
Allostery
A number of the proteins in the benchmark are allosteric in the original sense of the term.46 They carry other binding sites than the one for which we report a Kd and have several partners: metal ions, small molecules, nucleic acids or proteins. If a conformation change accompanies the binding of one ligand, the affinity for other ligands may be greatly affected.
Trypsinogen is a remarkable example. This precursor of trypsin is catalytically inactive, yet it binds BPTI in the same way as trypsin, albeit with a Kd that is orders of magnitude higher19 (Table II). The structures of the trypsin/BPTI and trypsinogen/BPTI complexes are very similar,30 and they offer no explanation for the change in affinity. That of unbound trypsinogen does: the inactive precursor contains disordered loops that become ordered when it is activated to trypsin, and also when it binds BPTI. The activation involves the proteolytic cleavage of a peptide bond. This releases a free amino group that can interact with the aspartate residue adjacent to the catalytic serine on the opposite face of the protein, triggering the conformation change. Adding the IleVal dipeptide, which mimics the N-terminal sequence of active trypsin, allows the same interaction to occur, and greatly increases the trypsinogen affinity for BPTI. The trypsinogen/IleVal/BPTI ternary complex has again the same structure as trypsin/BPTI.19 In the reaction scheme of Figure 2, inspired from,19 only K1 and K2 have effectively been measured. The value of K3 assumes that trypsinogen/IleVal has the same affinity as trypsin for BPTI, and K4 is derived from it through the linkage equation. If trypsinogen/IleVal has less affinity for BPTI than trypsin, which is likely, K4 may be less than calculated, but it is too high in any case to be measured or allow an X-ray structure to be determined for the binary trypsinogen/IleVal complex. As a consequence, the ternary complex cannot be included in the benchmark.
Figure 2.
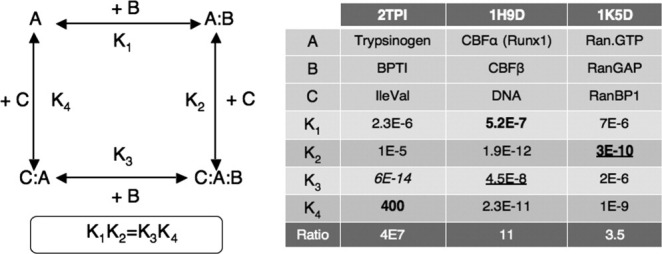
Allostery and ligand affinity. Protein A binds ligands B and C at two distinct sites that have different affinities in the binary and the ternary complexes. The ratio K1/K3 = K4/K2 is a measure of the cooperative interaction between the ligands. The table reports dissociation constants (in molar units); they are from experiment, except for K3 in 2TPI, which is an estimate based on trypsin, and the three values in bold face, calculated from the linkage equation; the values retained for the benchmark are underlined. References: 2TPI,19 1H9D,47,48 and 1K5D.49
A few ternary complexes are nevertheless present. In the complex of the Ras G-protein with the Son of Sevenless exchange factor (1NVU), two Ras molecules occupy two noninteracting sites on the exchange factor. Kd's being available for each site,50 we made two entries for this complex. Two other ternary complexes are cited in Figure 2. Their sites do interact, albeit not as strongly as in trypsinogen. One (1H9D) contains the α subunit of the core-binding factor (CBFα), the β subunit (CBFβ), and DNA.51 The affinity of CBFα for DNA has been measured both in the absence of CBFβ and in its presence, where it goes up 11-fold. The Kd reported in the benchmark is K3, measured by titrating CBFα/DNA with CBFβ47; the linkage equation predicts that K1 must be less by the same factor in the absence of DNA. The other ternary complex (1K5D) involves the Ras related G-protein Ran, bound to RanGAP and to RanBP1.52 Seewald et al.49 report Kd's for RanGAP in complex with Ran and with Ran/RanBP1; they differ by a factor of 3.5. The Kd in the benchmark is K2, calculated by dividing the experimental value of K4 by that factor. This system contains another very important component: the nucleotide. It is a GTP analog in these Ran structures and in the Kd measurements reported in Table II. K4 changes by four orders of magnitude if GDP replaces GTP.49 In the high-affinity complex with RCC1 (1I2M), Ran contains no nucleotide. The Ran affinity for RCC1 is much less when it binds GDP, and the difference contributes to the nucleotide exchange mechanism.
In all G-proteins, the presence and nature (GDP or GTP) of the nucleotide affects both the protein conformation and its affinity for its partners. Metal ions, especially Ca++, play a similar role in other systems. We therefore checked that the Kd's have been measured in the presence (or absence) of the same nucleotide or metal ion, as the X-ray structures.
Conformation changes
Ligand binding can affect the protein conformation in many ways. Side chain rotations and small local adjustments of the main chain always take place, and large movements of surface loops are common. On a more global scale, whole domains or whole subunits may rotate or shift, and part of the polypeptide chain may change secondary structure or undergo a disorder-to-order transition.53,54 Examples of all those are present in the benchmark, and can be identified by comparing the unbound proteins to the complexes.
In line with the docking benchmark,13 we use the I_rmsd (interface Cα root-mean-square displacement) parameter to detect conformation changes and estimate their amplitude. In our set, only 26 (18%) of the complexes have I_rmsd < 0.5 Å, which warrants that the main chain has essentially the same conformation bound and unbound, and thus, that the components associate as rigid bodies; two-thirds of those are antigen/antibody or enzyme/inhibitor complexes. In all the antigen/antibody complexes, the antigen moiety undergoes changes of limited amplitude only; the antibody does too, at least in the 12 complexes where its unbound structure is known.
A majority of the complexes (83%, or 58%) have I_rmsd values in the range 0.5–1.5 Å, meaning that significant movements take place at the interface, but no large scale ones. Then, 35 complexes (24%) have I_rmsd > 1.5 Å (Table I), and they display major conformation changes. Whereas many protein inhibitors bind the enzyme as a rigid body, several enzyme/inhibitor complexes undergo large changes. In trypsinogen/BPTI (2PTC), BPTI is rigid, but trypsinogen undergoes a disorder-to-order transition that affects several surface loops.55 In four other systems (1JIW, 1ZLI, 2O3B, and 4CPA), the inhibitor interacts with the enzyme through N- or C-terminal segments that are disordered in NMR structures of the unbound protein, and become ordered in the complex. In the ClpA/ClpS complex (1R6Q), the N-terminal segment of ClpS makes up much of the contact with ClpA, yet it remains partly disordered even in the bound state.56,57
Major changes are even more frequent in the other functional classes. They affect 7 of the 21 enzyme complexes with substrates or regulatory subunits. In thioredoxin reductase (1F6M), substrate binding affects the relative orientation of two domains in the enzyme; in HPr kinase (1KKL), it affects the orientation of a C-terminal α-helix. Caspase-9/BIR3 (1NW9) is a remarkable system in which the interaction changes the quaternary structure. The active protease is a homodimer; it becomes inactive and monomeric in the complex, and BIR3 binds at the homodimer interface.58 In complexes involving G-proteins, the G-protein contains “switch” segments that move, change secondary structure, or undergo disorder-to-order transitions when GTP or GDP binds, and often also when the G-protein interacts with another protein.59 In the complexes involving receptors, the entire assembly of the receptor extracellular domains may be affected. For example, large domain rotations take place in the urokinase receptor, and the EPO receptor dimer rearranges completely when it binds erythropoietin.60
Discussion
Since the early days of protein–protein interaction studies, relating structure to affinity has been a matter of concern to crystallographers as well as to biochemists and biophysicists.61,62 However, these studies dealt mostly with individual systems, and the first attempt to associate binding affinities with a set of structures is due to Horton and Lewis,4 who collected from the literature 15 ΔG values, and showed that they could be fitted by summing contributions of the interface polar and nonpolar groups. The fit had just three adjustable coefficients, and it was remarkably good, yielding a linear regression coefficient R = 0.96, and a mean absolute difference of 0.8 kcal mol−1 between the calculated and observed ΔG values. However, most of the data concerned protease/inhibitor complexes, and some of it was spurious. Trypsinogen/IleVal was given the same affinity for BPTI as trypsin, and a Kd was assigned to a hemoglobin S dimer (1HBS) that exists only in the crystal. Moreover, the authors noted that, whereas their formula fitted the ΔG of trypsin/BPTI reasonably well, it was off by as much as 10 kcal mol−1 in the case of trypsinogen/BPTI. They attributed the discrepancy to the conformation change in trypsinogen, in line with Bode's analysis of the system.19
Later reports have used more diverse data sets, together with more elaborate models and more adjustable parameters.5–10 None has achieved as good a fit to the data as Horton and Lewis,4 and we can see at least two reasons for that. The first is the poor quality of the data sets, which contain many Kd values that are incorrect or associated with the wrong PDB entries, and others that cannot be traced to an actual measurement. The second reason is basic: the models rely on structural features of the complex alone. Thus, they represent the association reaction by its product, and ignore the reactants or the changes their structure may undergo. Whereas Horton and Lewis4 had discussed the role of conformation changes, several recent reports do no not mention them at all.8,10 Audie and Scarlata5 do, before stating that their contribution to ΔG must be negligible. Their model fits very well a training set of 24 values, mostly for enzyme/inhibitor complexes, but it achieves about the same statistics as the other studies just cited (R = 0.73, root-mean-square ΔG discrepancy = 2.4 kcal mol−1), on a more diverse control set of other 35 complexes.
A model of the association reaction based entirely on its final product is a plausible approximation if the components are known to behave as rigid bodies. The availability of the unbound structures in our benchmark allows us to state that this is incorrect except in a minority of cases, mostly antigen/antibody or enzyme/inhibitor complexes. In other systems, local, but significant, main chain movements take place at the interface, and one out four of the complexes displays large movements and/or disorder-to-order transitions. Their enthalpic and entropic costs contribute to the thermodynamic balance, lowering ΔG by 10 kcal mol−1 in the case of trypsinogen binding BPTI. Figure 3 extends this remark to the whole dataset: when the main chain movements are of limited amplitude (I_rmsd < 1 Å), a ΔG prediction scheme that only uses the interface area achieves performances similar to more elaborate empirical models used in the past; when the movements are large (I_rmsd < 1.5 Å), the same scheme systematically overestimates the binding free energy by a large amount.
Figure 3.
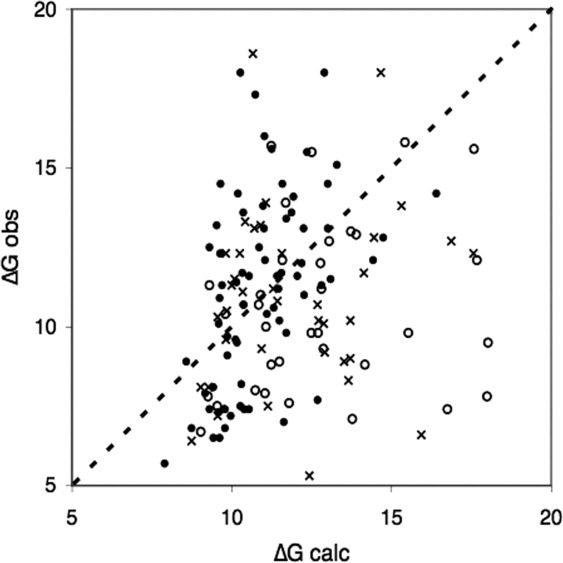
Conformation changes and binding free energy. Assuming ΔGcalc = α ΔASA + β, a linear regression of the observed ΔG's vs. the interface area ΔASA was performed on 70 complexes with I_rmsd < 1 Å (filled circles) excluding two (1BRS and 2PTC). The regression yields R = 0.54 and a RMS discrepancy between ΔGcalc and ΔGobs of 2.4 kcal mol−1. When I_rmsd > 1 Å, the correlation with ΔASA vanishes, and 70% of the points are below the diagonal, meaning that observed ΔG values are less than calculated ones (with P < 10−4). The average value of ΔGcalc − ΔGobs is 1.2 kcal mol−1 for 39 complexes with I_rmsd in the range 1–1.5 Å (crosses), and 2.7 kcal mol−1 for 35 complexes with I_rmsd > 1.5 Å (empty circles).
Prediction methods rely on experimental data to train and test procedures, and their performance critically depends on the quality and accuracy of those data. Collecting Kd from publications has proved to be a demanding task, validated in successive steps involving each of our groups. We did our best to ensure that the values we report are relevant to the PDB entries associated with them, and we expect them to be accurate to within a factor of 2–10 for Kd, or 0.4–1.4 kcal mol−1 for ΔG. Nevertheless, they are valid only within a range of temperature, ionic strength and pH, and that range can be narrow, especially for pH. As a consequence, it makes little sense to model or predict a Kd to within better than an order of magnitude, unless one is also prepared to model its dependence on pH, and possibly also on ionic strength and temperature. This is particularly true of the low-affinity complexes, which were very few in early data sets, and are still under-represented, due in part to the difficulty in preparing crystals for structural studies.
In spite of some obvious limitations, like the absence of membrane proteins, the benchmark set of protein–protein complexes presented here covers a wide variety of functions and affinities. It should be an invaluable resource to computational structural biologists who attempt to predict binding affinity from structure, and stimulate the development of novel methods dealing with conformational changes. We found the collection of reliable binding affinity data to be a daunting task, and now hope to keep extending this dataset. As such, we call upon the community to provide binding affinity data, properly documented and when possible, associated with the deposition in the PDB of the structure of new protein–protein complexes.
Methods
Information on the binding affinities was manually procured from literature. When it was ambiguous or incomplete, it was supplemented by personal communication with the authors. To maximize their reliability, the data were curated independently by each of the collaborating groups and compared to each other, so that all reported values have been checked in triplicate. Values from previously published sets,5,6,8,63–66 including those collected for the complexes of the docking benchmark Version 3.0,11 were used and controlled by checking primary citations. Data from publicly available databases (PINT40 and ASEdb41) were also considered. Table S1 (Supporting Information) lists primary citations for all the final values.
Except when they were reported in the same publication as the structure itself, the affinity measurements have been done on protein samples, and possibly genetic constructs, that were different than the X-ray study, and under different experimental conditions. In cases where multiple sources were available, we selected those that most closely reproduced the content and the conditions of the crystal structure in terms of cofactors, ions, and pH, under which it was obtained. We then retained either the consensus value (the one that was found in more than one reference), or the value that we deemed to be most accurate, based on the measurement method or a personal communication with the authors. Most values were derived from direct physical measurements: SPR, ITC, and titration by fluorescence or other spectroscopic methods. They appear in publications in the form of equilibrium constants (Kd / Ka = 1/Kd), or as the ratio Kd = kd/ka of rate constants issued from SPR and other kinetic measurements. For enzyme inhibitors, Ki values were assimilated to a Kd if they had been corrected for competition with the substrate and (when applicable) for slow binding kinetics.67
The temperature, pH, and experimental conditions were recorded when available. Taking the temperature to be as stated (in 104 cases out of 144), or 25°C in other cases (room temperature, or no indication), we calculated the dissociation Gibbs free energy (in the c° = 1M standard state) as:
For each complex in the benchmark, Supporting Information Table S1 reports the PDB entry codes and chain codes for the complex and its components, the Kd value and derived ΔG, the reference to the publication reporting the measurement, the temperature, the pH, and method it used. The table also contains values of ΔASA and I_rmsd, consistent with the docking benchmark.13 ΔASA is the accessible surface area (ASA) lost in the complex relative to its components in bound conformation; the ASA is calculated with program NACCESS68 and a 1.4 Å probe. I_rmsd is the root-mean-square displacement of the C-alpha atoms of interface residues in the two partners, after the unbound and the bound interface residues have been superimposed by least-square.
A version of Supporting Information Table S1 with additional information on the affinity measurements and corroborating data is available online at http://bmm.cancerresearchuk.org/~bmmadmin/Affinity.
Acknowledgments
J.J. acknowledges discussions with Dr. Charles Robert and M. Guharoy (Paris). P.B. and I.M. thank Raphael Chaleil for help with the MySQL web interface.
References
- 1.Jones S, Thornton JM. Principles of protein-protein interactions. Proc Natl Acad Sci USA. 1996;93:13–20. doi: 10.1073/pnas.93.1.13. [DOI] [PMC free article] [PubMed] [Google Scholar]
- 2.Nooren IM, Thornton JM. Diversity of protein-protein interactions. EMBO J. 2003;22:3486–3492. doi: 10.1093/emboj/cdg359. [DOI] [PMC free article] [PubMed] [Google Scholar]
- 3.Janin J, Bahadur RP, Chakrabarti P. Protein-protein interaction and quaternary structure. Q Rev Biophys. 2008;41:133–180. doi: 10.1017/S0033583508004708. [DOI] [PubMed] [Google Scholar]
- 4.Horton N, Lewis M. Calculation of the free energy of association for protein complexes. Protein Sci. 1992;1:169–181. doi: 10.1002/pro.5560010117. [DOI] [PMC free article] [PubMed] [Google Scholar]
- 5.Audie J, Scarlata S. A novel empirical free energy function that explains and predicts protein-protein binding affinities. Biophys Chem. 2007;129:198–211. doi: 10.1016/j.bpc.2007.05.021. [DOI] [PubMed] [Google Scholar]
- 6.Jiang L, Gao Y, Mao F, Liu Z, Lai L. Potential of mean force for protein-protein interaction studies. Proteins. 2002;46:190–196. doi: 10.1002/prot.10031. [DOI] [PubMed] [Google Scholar]
- 7.Ma XH, Wang CX, Li CH, Chen WZ. A fast empirical approach to binding free energy calculations based on protein interface information. Protein Eng. 2002;15:677–681. doi: 10.1093/protein/15.8.677. [DOI] [PubMed] [Google Scholar]
- 8.Zhang C, Liu S, Zhu Q, Zhou Y. A knowledge-based energy function for protein-ligand, protein-protein, and protein-DNA complexes. J Med Chem. 2005;48:2325–2335. doi: 10.1021/jm049314d. [DOI] [PubMed] [Google Scholar]
- 9.Liang S, Liu S, Zhang C, Zhou Y. A simple reference state makes a significant improvement in near-native selections from structurally refined docking decoys. Proteins. 2007;69:244–253. doi: 10.1002/prot.21498. [DOI] [PMC free article] [PubMed] [Google Scholar]
- 10.Su Y, Zhou A, Xia X, Li W, Sun Z. Quantitative prediction of protein-protein binding affinity with a potential of mean force considering volume correction. Protein Sci. 2009;18:2550–2558. doi: 10.1002/pro.257. [DOI] [PMC free article] [PubMed] [Google Scholar]
- 11.Kastritis PL, Bonvin AM. Are scoring functions in protein-protein docking ready to predict interactomes? Clues from a novel binding affinity benchmark. J Proteome Res. 2010;9:2216–2225. doi: 10.1021/pr9009854. http://haddock.chem.uu.nl/services/affinity Corrigendum (in press). Available at. [DOI] [PubMed] [Google Scholar]
- 12.Berman HM, Battistuz T, Bhat TN, Bluhm WF, Bourne PE, Burkhardt K, Feng Z, Gilliland GL, Iype L, Jain S, Fagan P, Marvin J, Padilla D, Ravichandran V, Schneider B, Thanki N, Weissig H, Westbrook JD, Zardecki C. The protein data bank. Acta Crystallogr Sect D. 2002;58:899–907. doi: 10.1107/s0907444902003451. [DOI] [PubMed] [Google Scholar]
- 13.Hwang H, Vreven T, Janin J, Weng Z. Protein-protein docking benchmark version 4.0. Proteins. 2010;78:3111–3114. doi: 10.1002/prot.22830. [DOI] [PMC free article] [PubMed] [Google Scholar]
- 14.Spiegel PC, Jacquemin M, Saint-Remy JM, Stoddard BL, Pratt KP. Structure of a factor VIII C2 domain-immunoglobulin G4kappa Fab complex: identification of an inhibitory antibody epitope on the surface of factor VIII. Blood. 2001;98:13–19. doi: 10.1182/blood.v98.1.13. [DOI] [PubMed] [Google Scholar]
- 15.Chen R, Mintseris J, Janin J, Weng Z. A protein-protein docking benchmark. Proteins. 2003;52:88–91. doi: 10.1002/prot.10390. [DOI] [PubMed] [Google Scholar]
- 16.Hartley RW. Directed mutagenesis and barnase-barstar recognition. Biochemistry. 1993;32:5978–5984. doi: 10.1021/bi00074a008. [DOI] [PubMed] [Google Scholar]
- 17.Li W, Hamill SJ, Hemmings AM, Moore GR, James R, Kleanthous C. Dual recognition and the role of specificity-determining residues in colicin E9 DNase-immunity protein interactions. Biochemistry. 1998;37:11771–11779. doi: 10.1021/bi9808621. [DOI] [PubMed] [Google Scholar]
- 18.Vincent JP, Lazdunski M. Trypsin-pancreatic trypsin inhibitor association. Dynamics of the interaction and role of disulfide bridges. Biochemistry. 1972;11:2967–2977. doi: 10.1021/bi00766a007. [DOI] [PubMed] [Google Scholar]
- 19.Bode W. The transition of bovine trypsinogen to a trypsin-like state upon strong ligand binding. II. The binding of the pancreatic trypsin inhibitor and of isoleucine-valine and of sequentially related peptides to trypsinogen and to p-guanidinobenzoate-trypsinogen. J Mol Biol. 1979;127:357–374. doi: 10.1016/0022-2836(79)90227-4. [DOI] [PubMed] [Google Scholar]
- 20.Erman JE, Kresheck GC, Vitello LB, Miller MA. Cytochrome c/cytochrome c peroxidase complex: effect of binding-site mutations on the thermodynamics of complex formation. Biochemistry. 1997;36:4054–4060. doi: 10.1021/bi962632x. [DOI] [PubMed] [Google Scholar]
- 21.Pielak GJ, Wang X. Interactions between yeast iso-1-cytochrome c and its peroxidase. Biochemistry. 2001;40:422–428. doi: 10.1021/bi002124u. [DOI] [PubMed] [Google Scholar]
- 22.Fleury D, Wharton SA, Skehel JJ, Knossow M, Bizebard T. Antigen distortion allows influenza virus to escape neutralization. Nat Struct Biol. 1998;5:119–123. doi: 10.1038/nsb0298-119. [DOI] [PubMed] [Google Scholar]
- 23.Cauerhff A, Goldbaum FA, Braden BC. Structural mechanism for affinity maturation of an anti-lysozyme antibody. Proc Natl Acad Sci USA. 2004;101:3539–3544. doi: 10.1073/pnas.0400060101. [DOI] [PMC free article] [PubMed] [Google Scholar]
- 24.Arold S, O'Brien R, Franken P, Strub MP, Hoh F, Dumas C, Ladbury JE. RT loop flexibility enhances the specificity of Src family SH3 domains for HIV-1 Nef. Biochemistry. 1998;37:14683–14691. doi: 10.1021/bi980989q. [DOI] [PubMed] [Google Scholar]
- 25.Cho S, Swaminathan CP, Bonsor DA, Kerzic MC, Guan R, Yang J, Kieke MC, Andersen PS, Kranz DM, Mariuzza RA, Sundberg EJ. Assessing energetic contributions to binding from a disordered region in a protein-protein interaction. Biochemistry. 2010;49:9256–9268. doi: 10.1021/bi1008968. [DOI] [PMC free article] [PubMed] [Google Scholar]
- 26.Hartley RW. Barnase and barstar: two small proteins to fold and fit together. Trends Biochem Sci. 1989;14:450–454. doi: 10.1016/0968-0004(89)90104-7. [DOI] [PubMed] [Google Scholar]
- 27.Kleanthous C, Hemmings AM, Moore GR, James R. Immunity proteins and their specificity for endonuclease colicins: telling right from wrong in protein-protein recognition. Mol Microbiol. 1998;28:227–233. doi: 10.1046/j.1365-2958.1998.00811.x. [DOI] [PubMed] [Google Scholar]
- 28.Meenan NA, Sharma A, Fleishman SJ, Macdonald CJ, Morel B, Boetzel R, Moore GR, Baker D, Kleanthous C. The structural and energetic basis for high selectivity in a high-affinity protein-protein interaction. Proc Natl Acad Sci USA. 2010;107:10080–10085. doi: 10.1073/pnas.0910756107. [DOI] [PMC free article] [PubMed] [Google Scholar]
- 29.Keeble AH, Kirkpatrick N, Shimizu S, Kleanthous C. Calorimetric dissection of colicin DNase—immunity protein complex specificity. Biochemistry. 2006;45:3243–3254. doi: 10.1021/bi052373o. [DOI] [PubMed] [Google Scholar]
- 30.Bode W, Schwager P, Huber R. The transition of bovine trypsinogen to a trypsin-like state upon strong ligand binding. The refined crystal structures of the bovine trypsinogen-pancreatic trypsin inhibitor complex and of its ternary complex with Ile-Val at 1.9 A resolution. J Mol Biol. 1978;118:99–112. doi: 10.1016/0022-2836(78)90246-2. [DOI] [PubMed] [Google Scholar]
- 31.Pelletier H, Kraut J. Crystal structure of a complex between electron transfer partners, cytochrome c peroxidase and cytochrome c. Science. 1992;258:1748–1755. doi: 10.1126/science.1334573. [DOI] [PubMed] [Google Scholar]
- 32.Lee CH, Saksela K, Mirza UA, Chait BT, Kuriyan J. Crystal structure of the conserved core of HIV-1 Nef complexed with a Src family SH3 domain. Cell. 1996;85:931–942. doi: 10.1016/s0092-8674(00)81276-3. [DOI] [PubMed] [Google Scholar]
- 33.Leatherbarrow RJ, Fersht AR. Protein engineering. Protein Eng. 1986;1:7–1. doi: 10.1093/protein/1.1.7. [DOI] [PubMed] [Google Scholar]
- 34.Bass SH, Mulkerrin MG, Wells JA. A systematic mutational analysis of hormone-binding determinants in the human growth hormone receptor. Proc Natl Acad Sci USA. 1991;88:4498–4502. doi: 10.1073/pnas.88.10.4498. [DOI] [PMC free article] [PubMed] [Google Scholar]
- 35.Clackson T, Wells JA. A hot spot of binding energy in a hormone-receptor interface. Science. 1995;267:383–386. doi: 10.1126/science.7529940. [DOI] [PubMed] [Google Scholar]
- 36.Vaughan CK, Buckle AM, Fersht AR. Structural response to mutation at a protein-protein interface. J Mol Biol. 1999;286:1487–1506. doi: 10.1006/jmbi.1998.2559. [DOI] [PubMed] [Google Scholar]
- 37.Wang J, Palzkill T, Chow DC. Structural insight into the kinetics and DeltaCp of interactions between TEM-1 beta-lactamase and beta-lactamase inhibitory protein (BLIP) J Biol Chem. 2009;284:595–609. doi: 10.1074/jbc.M804089200. [DOI] [PMC free article] [PubMed] [Google Scholar]
- 38.Chitarra V, Alzari PM, Bentley GA, Bhat TN, Eisele JL, Houdusse A, Lescar J, Souchon H, Poljak RJ. Three-dimensional structure of a heteroclitic antigen-antibody cross-reaction complex. Proc Natl Acad Sci USA. 1993;90:7711–7715. doi: 10.1073/pnas.90.16.7711. [DOI] [PMC free article] [PubMed] [Google Scholar]
- 39.Hammel M, Sfyroera G, Ricklin D, Magotti P, Lambris JD, Geisbrecht BV. A structural basis for complement inhibition by Staphylococcus aureus. Nat Immunol. 2007;8:430–437. doi: 10.1038/ni1450. [DOI] [PubMed] [Google Scholar]
- 40.Kumar MD, Gromiha MM. PINT: protein-protein interactions thermodynamic database. Nucleic Acids Res. 2006;34:D195–D198. doi: 10.1093/nar/gkj017. [DOI] [PMC free article] [PubMed] [Google Scholar]
- 41.Thorn KS, Bogan AA. ASEdb: a database of alanine mutations and their effects on the free energy of binding in protein interactions. Bioinformatics. 2001;17:284–285. doi: 10.1093/bioinformatics/17.3.284. [DOI] [PubMed] [Google Scholar]
- 42.Wang R, Fang X, Lu Y, Wang S. The PDBbind database: collection of binding affinities for protein-ligand complexes with known three-dimensional structures. J Med Chem. 2004;47:2977–2980. doi: 10.1021/jm030580l. [DOI] [PubMed] [Google Scholar]
- 43.Foote J, Eisen HN. Breaking the affinity ceiling for antibodies and T cell receptors. Proc Natl Acad Sci USA. 2000;97:10679–10681. doi: 10.1073/pnas.97.20.10679. [DOI] [PMC free article] [PubMed] [Google Scholar]
- 44.Li Y, Li H, Yang F, Smith-Gill SJ, Mariuzza RA. X-ray snapshots of the maturation of an antibody response to a protein antigen. Nat Struct Biol. 2003;10:482–488. doi: 10.1038/nsb930. [DOI] [PubMed] [Google Scholar]
- 45.Acchione M, Lipschultz CA, DeSantis ME, Shanmuganathan A, Li M, Wlodawer A, Tarasov S, Smith-Gill SJ. Light chain somatic mutations change thermodynamics of binding and water coordination in the HyHEL-10 family of antibodies. Mol Immunol. 2009;47:457–464. doi: 10.1016/j.molimm.2009.08.018. [DOI] [PMC free article] [PubMed] [Google Scholar]
- 46.Monod J, Changeux JP, Jacob F. Allosteric proteins and cellular control systems. J Mol Biol. 1963;6:306–329. doi: 10.1016/s0022-2836(63)80091-1. [DOI] [PubMed] [Google Scholar]
- 47.Huang X, Crute BE, Sun C, Tang YY, Kelley JJ, Lewis AF, Hartman KL, Laue TM, Speck NA, Bushweller JH. Overexpression, purification, and biophysical characterization of the heterodimerization domain of the core-binding factor beta subunit. J Biol Chem. 1998;273:2480–2487. doi: 10.1074/jbc.273.4.2480. [DOI] [PubMed] [Google Scholar]
- 48.Tang YY, Shi J, Zhang L, Davis A, Bravo J, Warren AJ, Speck NA, Bushweller JH. Energetic and functional contribution of residues in the core binding factor beta (CBFbeta) subunit to heterodimerization with CBFalpha. J Biol Chem. 2000;275:39579–39588. doi: 10.1074/jbc.M007350200. [DOI] [PubMed] [Google Scholar]
- 49.Seewald MJ, Kraemer A, Farkasovsky M, Korner C, Wittinghofer A, Vetter IR. Biochemical characterization of the Ran-RanBP1-RanGAP system: are RanBP proteins and the acidic tail of RanGAP required for the Ran-RanGAP GTPase reaction? Mol Cell Biol. 2003;23:8124–8136. doi: 10.1128/MCB.23.22.8124-8136.2003. [DOI] [PMC free article] [PubMed] [Google Scholar]
- 50.Margarit SM, Sondermann H, Hall BE, Nagar B, Hoelz A, Pirruccello M, Bar-Sagi D, Kuriyan J. Structural evidence for feedback activation by Ras. GTP of the Ras-specific nucleotide exchange factor SOS. Cell. 2003;112:685–695. doi: 10.1016/s0092-8674(03)00149-1. [DOI] [PubMed] [Google Scholar]
- 51.Bravo J, Li Z, Speck NA, Warren AJ. The leukemia-associated AML1 (Runx1)—CBF beta complex functions as a DNA-induced molecular clamp. Nat Struct Biol. 2001;8:371–378. doi: 10.1038/86264. [DOI] [PubMed] [Google Scholar]
- 52.Seewald MJ, Korner C, Wittinghofer A, Vetter IR. RanGAP mediates GTP hydrolysis without an arginine finger. Nature. 2002;415:662–666. doi: 10.1038/415662a. [DOI] [PubMed] [Google Scholar]
- 53.Bonvin AM. Flexible protein-protein docking. Curr Opin Struct Biol. 2006;16:194–200. doi: 10.1016/j.sbi.2006.02.002. [DOI] [PubMed] [Google Scholar]
- 54.Zacharias M. Accounting for conformational changes during protein-protein docking. Curr Opin Struct Biol. 2010;20:180–186. doi: 10.1016/j.sbi.2010.02.001. [DOI] [PubMed] [Google Scholar]
- 55.Fehlhammer H, Bode W, Huber R. Crystal structure of bovine trypsinogen at 1–8 A resolution. II. Crystallographic refinement, refined crystal structure and comparison with bovine trypsin. J Mol Biol. 1977;111:415–438. doi: 10.1016/s0022-2836(77)80062-4. [DOI] [PubMed] [Google Scholar]
- 56.Xia D, Esser L, Singh SK, Guo F, Maurizi MR. Crystallographic investigation of peptide binding sites in the N-domain of the ClpA chaperone. J Struct Biol. 2004;146:166–117. doi: 10.1016/j.jsb.2003.11.025. [DOI] [PubMed] [Google Scholar]
- 57.Zeth K, Ravelli RB, Paal K, Cusack S, Bukau B, Dougan DA. Structural analysis of the adaptor protein ClpS in complex with the N-terminal domain of ClpA. Nat Struct Biol. 2002;9:906–911. doi: 10.1038/nsb869. [DOI] [PubMed] [Google Scholar]
- 58.Shiozaki EN, Chai J, Rigotti DJ, Riedl SJ, Li P, Srinivasula SM, Alnemri ES, Fairman R, Shi Y. Mechanism of XIAP-mediated inhibition of caspase-9. Mol Cell. 2003;11:519–527. doi: 10.1016/s1097-2765(03)00054-6. [DOI] [PubMed] [Google Scholar]
- 59.Grant BJ, Gorfe AA, McCammon JA. Large conformational changes in proteins: signaling and other functions. Curr Opin Struct Biol. 2010;20:142–147. doi: 10.1016/j.sbi.2009.12.004. [DOI] [PMC free article] [PubMed] [Google Scholar]
- 60.Livnah O, Stura EA, Middleton SA, Johnson DL, Jolliffe LK, Wilson IA. Crystallographic evidence for preformed dimers of erythropoietin receptor before ligand activation. Science. 1999;283:987–990. doi: 10.1126/science.283.5404.987. [DOI] [PubMed] [Google Scholar]
- 61.Blow DM, Wright CS, Kukla D, Ruhlmann A, Steigemann W, Huber R. A model for the association of bovine pancreatic trypsin inhibitor with chymotrypsin and trypsin. J Mol Biol. 1972;69:137–144. doi: 10.1016/0022-2836(72)90028-9. [DOI] [PubMed] [Google Scholar]
- 62.Chothia C, Janin J. Principles of protein-protein recognition. Nature. 1975;256:705–708. doi: 10.1038/256705a0. [DOI] [PubMed] [Google Scholar]
- 63.Stites WE. Proteinminus signProtein interactions: interface structure, binding thermodynamics, and mutational analysis. Chem Rev. 1997;97:1233–1250. doi: 10.1021/cr960387h. [DOI] [PubMed] [Google Scholar]
- 64.Gray JJ, Moughon S, Wang C, Schueler-Furman O, Kuhlman B, Rohl CA, Baker D. Protein-protein docking with simultaneous optimization of rigid-body displacement and side-chain conformations. J Mol Biol. 2003;331:281–299. doi: 10.1016/s0022-2836(03)00670-3. [DOI] [PubMed] [Google Scholar]
- 65.Xu D, Lin SL, Nussinov R. Protein binding versus protein folding: the role of hydrophilic bridges in protein associations. J Mol Biol. 1997;265:68–84. doi: 10.1006/jmbi.1996.0712. [DOI] [PubMed] [Google Scholar]
- 66.Zhang C, Vasmatzis G, Cornette JL, DeLisi C. Determination of atomic desolvation energies from the structures of crystallized proteins. J Mol Biol. 1997;267:707–726. doi: 10.1006/jmbi.1996.0859. [DOI] [PubMed] [Google Scholar]
- 67.Laskowski M, Jr, Sealock RW. Protein proteinase inhibitors—Molecular aspects. In: Boyer PD, editor. New York. Vol. 3. Academic Press; 1971. pp. 375–473. The enzymes. [Google Scholar]
- 68.Hubbard SJ, Thornton JM. 1993. “NACCESS”, computer program. Department of Biochemistry and Molecular Biology, University College London.