Vapors of small molecules are under widespread study in natural signalling, environmental monitoring, industrial quality control, and in medicine.[1–3] In the last few decades, advances in chemistry and material science have enabled the development of chemical sensors of such volatile organics,[4–7] in which conjugated polymers and cross-reactive chemical sensor arrays are the most widespread sensor types. Among them, optical vapor sensing arrays based on luminescence (including fluorescence) and absorbance have become essential.[8–13] In the recent past, colorimetric detection of volatile organics using cross-reactive chemical sensors have been demonstrated in multiple applications.[14–16]
Although absorbance–based methods for vapor detection have shown good success, fluorescence-based methods may offer some advantages, such as high sensitivity and low background. For example, the detection of vapors of nitroaromatics with conjugated polymers and bio-polymers has showed very high sensitivity.[17–23] Notably, much of the power of fluorescence-based detection still remains unharnessed, since most current approaches involve the use of only one type or a few types of sensor molecules, resulting in a limited diversity of sensing (i.e., quenching).[19, 20] Additionally, in most current approaches the difficulty of synthesis of a set of sensor molecules and the lack of flexibility in conjugating them to supports can restrict their general utility.
We envisioned that sensor molecules built by assembling multiple fluorophores on a DNA backbone could address some of these limitations. Such DNA-like oligomers can be synthesized rapidly in widely varied sequences and lengths on an automated instrument, and the iterative synthesis makes the preparation of large combinatorial libraries straightforward.[24, 25] In addition, the resulting oligomers are water-soluble and are readily conjugated both to small molecules and to solid supports. Most importantly for sensing, such oligodeoxyfluorosides (ODFs) undergo multiple forms of electronic interactions among the closely spaced chromophores, resulting in complex fluorescence emission properties that are quite distinct from the component monomers.[26–28] We considered the possibility that interaction with a small molecule analyte might well alter such electronic interactions selectively, resulting in changes in emission, including quenching,[27, 29] but also possibly enhancement and/or shifts in wavelength as well.
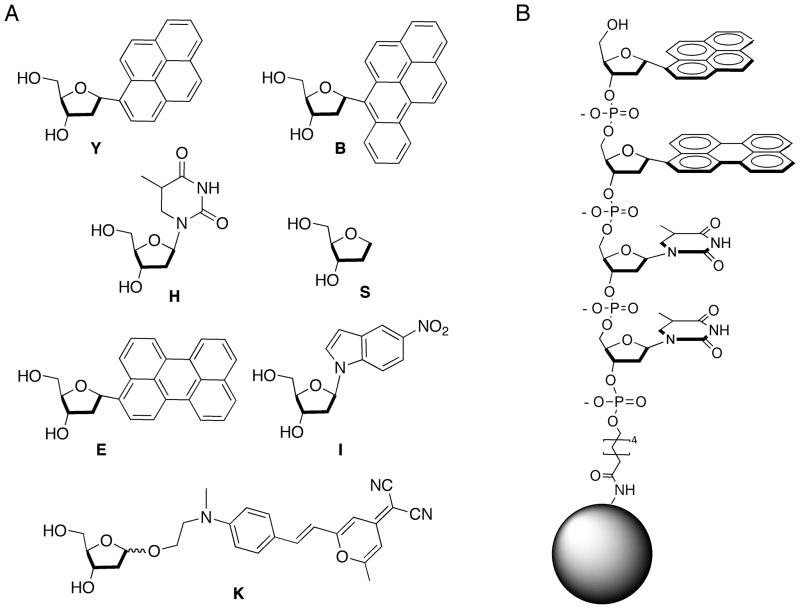
To test this possibility, we constructed a library of 2401 tetramer ODFs conjugated to PEG-polystyrene beads by a stable amide linkage. Standard split-and-pool methods yielded a library in which each bead contained one specific tetramer structure. The sensor candidates were constructed in all possible sequences of seven monomer deoxyribosides (Figure 1); these included four fluorophores (Y,E,B,K),[28] a potential quencher (I), an abasic spacer (S), and a spacer / hydrogen bonding element (dihydrothymidine, H). Sequences were encoded by the tagging method of Still, readable on the single bead level by electron-capture GC.[30]
Figure 1.
A) Fluorescent and non-fluorescent monomers employed as components of the library; B) Example of sensor (5′-Y-E-H-H-3′), attached by an amide linkage to a PEG-PS bead.
Our initial qualitative tests of sensing capabilities among library members were directed to vapors of four distinct small molecules. Acrolein (an example of an unsaturated aldehyde), mesitylene (electron-rich aromatic), propionic acid (aliphatic carboxylic acid) and nitrobenzene (electron-poor aromatic) were selected to represent diverse structural and electronic properties. A closed chamber was designed using quartz fluorescence cell in which beads from the library were placed onto a small microscope slide. The beads were exposed to one adjacent drop (4μL) of analyte inside the cell, which was then capped. Fluorescence was monitored under an epifluorescence microscope using excitation 340–380 nm and observing all visible emission (long-pass filter, > 400 nm). Images were taken before and after 2 min, 7 min, and 30 min of exposure to the vapor in the chamber at 23 °C.
To analyze possible changes in emission in response to analytes, we first constructed graphical 50% gray-based difference maps of the beads by inverting color/intensity of the image before exposure (i.e. making a photonegative) and merging it with the image taken after 30 min of exposure using 50% transparency (see Table 1 and details in SI). This difference image enables an easy visualization of the effect of the small-molecule vapor on the library of tetramers. Any part of the image that is 50% gray (including background and beads) indicates no change, while beads that are darker than 50% gray background reveal quenching, brighter beads show emission enhancement, and colors reflect a combination of the original ODF emission color and any wavelength shifts that occur on sensing. In addition to this, for selected sequences we determined a quantitative color change profile, a 3-dimensional vector (ΔR, ΔG, ΔB), by substracting the RGB values of the image before exposure from the values of the image after exposure. The color-change maps were then analyzed by chemometric and statistical methods.[31]
Table 1.
Summary of cross-screening results, listing ODF sequences and their qualitative responses to analyte vapors (as shown by actual blended difference images of beads containing sensor molecules)
| Entry | Sensor Sequences | AC[a] | MS[b] | PA[c] | NB[d] |
|---|---|---|---|---|---|
| 1 | 5′-H-I-E-H | ||||
| 2 | 5′-Y-E-H-H | ||||
| 3 | 5′-S-S-Y-E | ||||
| 4 | 5′-Y-Y-S-B | ||||
| 5 | 5′-S-H-E-S | ||||
| 6 | 5′-B-K-H-H | ||||
| 7 | 5′-Y-S-E-S | ||||
| 8 | 5′-Y-Y-E-K |
Acrolein
Mesitylene
Propionic Acid
Nitrobenzene.
During screening we observed marked fluorescence responses for many of the ODF library members upon exposure to analytes, as indicated by color-shifted beads in the difference map (see SI, Figures S2–S5). Two strongly-responding examples for each analyte were selected, resynthesized, characterized by MALDI-MS, measured for absorption and emission spectra, and retested for sensing responses on beads. All beads reproduced the trends observed during the screening process (see SI, Table S2) with the exception of sequence 2; in this case it is possible that we mistakenly picked up a different bead than the one that was observed in the difference image. However, even this sequence showed good sensing properties that were distinct from the other sensor ODFs (Table 1).
While the selected sequences were able to detect the analytes they were chosen for quite clearly, we wished to see whether there was selectivity: did a given ODF respond the same to its selected analyte as to the other analytes? To answer this question we performed a cross-screening study of all eight ODF sequences against the four small molecules. The qualitative results are shown in Table 1. Importantly, most of the sensors showed widely varied responses to the four vapors, establishing that differences in sequence and monomer composition affect the responses markedly. Interestingly, sequences selected for their responses to individual analytes demonstrated (in the majority of cases) fluorescence responses to the other three others analytes as well. Of the eight different sequences there were two or three distinct response patterns to the four analytes, as exemplified by sequences 2, 4, and 7. For example, 5′-Y-E-H-H (2) gave a blue shift for acrolein and a bright maroon difference image for nitrobenzene (Table 1). In contrast, 5′-Y-Y-S-B (4) gave a marked red difference response and a light brown response for these same two analytes respectively. Notably, the data showed multiple clear cases of wavelength shifts in emission rather than simple quenching. Examples include 5′-Y-E-H-H (2), whose green emission shifts to turquoise upon exposure to acrolein (see SI, Table S2), and 5′-S-H-E-S (5), which switches from green to cyan emission in the presence of propionic acid.
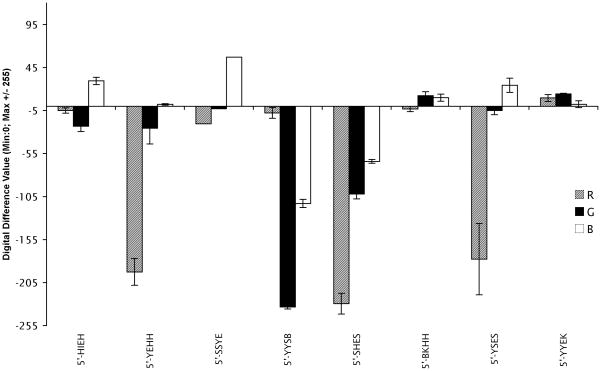
The responses and reproducibility were further investigated quantitatively using the RGB color change profiles. The color change plots (Figure 2 and SI) reflected multiple strong responses, including those of the sequences 2, 4, and 7. Indeed, recognition patterns were observed even for sequences that differed by only one component. Thus, 5′-Y-E-H-H (2) and 5′-Y-S-E-S (7) exhibited a strong red and a slight green quenching upon exposure to acrolein, while the blue wavelengths remained unchanged or slightly increased. Notably, these sequences contain the same two chromophores, and differ only in non-fluorescent components. Sequence 5′-S-H-E-S (5) showed a decrease of all three RGB values with acrolein, while 5′-Y-Y-S-B (4) exhibited mainly a green and blue quenching. The same tetramers showed a relative quenching in response of mesitylene vapors, but with a different pattern and a stronger general quenching in presence of nitrobenzene vapors. Interestingly, in the presence of propionic acid vapors, an increase in the blue and green channels is observed for (1), (3), and (6), and red and green for (8), demonstrating “light up” responses in those cases.
Figure 2.
Quantitative color change profile of sensor sequences upon exposure to acrolein. Profiles for other analytes are in the SI file.
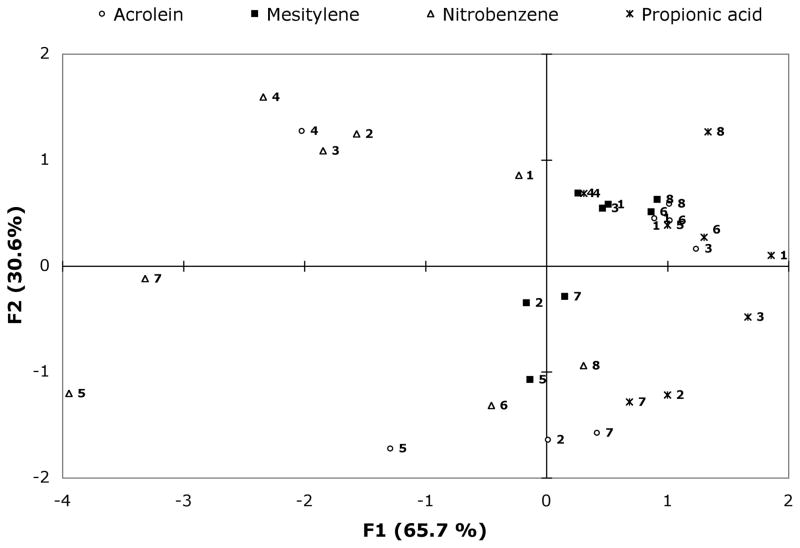
To better understand the relationships in the data, we performed principal component analysis (PCA) on the full cross-screening data (Figure 3 and SI). The first component F1 accounts for 65.7% of variance and the second component F2 accounts for 30.6 %. The sum of the variances is equal to 96.3%. Two main clusters of sensor behavior are revealed; one is centered along the first component axis and the other along the second component axis. Sequences within a cluster act similarly upon exposure to the analytes. Interestingly, the data for acrolein and nitrobenzene vapors show the largest spread in component values. For example, the responses of 5′-S-H-E-S (5), 5′-Y-Y-S-B (4), and 5′-Y-Y-E-K (8) are very well separated in the presence of nitrobenzene vapor. The plot of those sequences upon exposure to acrolein and mesitylene also produces a good separation. Their pattern responses in the presence of propionic acid are similar to one another but very distinct from the patterns for the other three analytes. Notably, the difference images (Table 1) and color change profiles (see SI, Figure S6) showed that even a single sensor could be used to distinguish between the four analytes (sensor 5 for example).
Figure 3.
Principal component analysis plot of ODF sensor responses upon exposure to the four analytes. Sensors 1–8 are listed in Table 1 and are shown by number here, with colors denoting the analyte for each data point. Each data point represents an average from 5–6 sensor beads.
In addition, the AHC analysis was performed (see SI, Figures S9-10 and Table S3), providing clusters of sensor responses by the single linkage method. The clustering scheme is based on the squared Euclidean distance between the centroids of the clusters of sensor response. The data generated a dendrogram in which classes of tetramers can be identified based on their pattern responses. The quantitative PCA and AHC methods taken together allowed us to select a small set of distinct sensors that could be used in a pattern response for these analytes. Importantly, using these analytic methods, a combination of three sensor molecules, 5′-S-H-E-S (5), 5′-Y-Y-S-B (4), and 5′-Y-Y-E-K (8), was shown to clearly discriminate the four analyte vapors with greater confidence than a single sensor.
The results show clearly that ODFs on beads can act as selective fluorescence sensors of a range of chemically distinct organic analytes in the vapor phase. We hypothesize that the varied responses arise from distinct electronic interactions between the analytes and each ODF, which has its own sequence-based electronic interactions initially. The specific mechanisms underlying such interactions are not yet clear, and further studies will be required to clarify the origins of the fluorescence changes. Future work is also needed to evaluate the sensitivity of responses to these analytes in low concentrations, and the selectivity among more closely related analytes.
Also of interest but not yet known is the mechanism of association between the analyte molecules and the ODFs. We note that some but not all of the observed responses were reversible upon opening the chamber to air (data not shown), implicating weak noncovalent attractions in some cases but possibly stronger bonds in others. Possible noncovalent contributions may include hydrogen bonding to the dihydrothymidine monomer (present in half of the selected sensors), electrostatic attractions to the phosphate anion backbone and its counterion, and/or van der Waals/stacking interactions with the large aromatic chromophores. It is also possible that the PEG-PS bead itself helps absorb and concentrate the vapor near the sensors; some bead swelling was noted with selected analytes (see SI, Figures S2–S4).
Overall, the results are significant on multiple counts. First, they establish that oligomeric fluorophores can behave as vapor sensors with varied responses beyond simple quenching, which has been the main response observed to date in most previous fluorescent gas-phase sensors. Second, the data show sequence-based responses that are distinct for multiple classes of analytes, thus broadening fluorescent vapor sensing far beyond detection of simple nitroaromatics. Third, the described library-based synthesis and screening approach enables facile evaluation of thousands of potential sensors for many analytes, rather than the previous one-at-a-time approach. Finally, the ODF sensor molecules are rapidly and easily synthesized in automated fashion using a small set of monomer components. Future work in this class of sensors will be directed to testing a broader array of analytes, and to investigating the mechanisms and limits of these sensor molecules.
Footnotes
We thank the U.S. National Institutes of Health (GM067201) for support. F.S. acknowledges a fellowship from the Swiss National Science Foundation. Y.N.T. ackowledges an A*STAR fellowship. We thank Dr. N. Dai for contributing to synthesis of monomers.
Supporting information for this article is available on the WWW under http://www.angewandte.org or from the author.
References
- 1.Spichiger-Keller UE. Chemical Sensors and Biosensors for Medical and Biological Applications. Wiley-VCH; Weinheim: 1998. [Google Scholar]
- 2.Simon P, Kvanik F. Optical Sensors for Industrial, Environmental and clinical Applications. Springer; Heidelberg: 2003. [Google Scholar]
- 3.Walt DR. ACS Nano. 2009;3:2876. doi: 10.1021/nn901295n. [DOI] [PubMed] [Google Scholar]
- 4.Albert KJ, Lewis NS, Schauer CL, Sotzing GA, Stitzel SE, Vaid TP, Walt DR. Chem Rev. 2000;100:2595. doi: 10.1021/cr980102w. [DOI] [PubMed] [Google Scholar]
- 5.Hulanicki A, Glab S, Ingman F. Pure Appl Chem. 1991;63:1247. [Google Scholar]
- 6.McQuade DT, Pullen AE, Swager TM. Chem Rev. 2000;100:2537. doi: 10.1021/cr9801014. [DOI] [PubMed] [Google Scholar]
- 7.a) Hopkins AR, Lewis NS. Anal Chem. 2001;73:884. doi: 10.1021/ac0008439. [DOI] [PubMed] [Google Scholar]; b) Hughes AD, Glenn IC, Patrick AD, Ellington A, Anslyn EV. Chem Eur J. 2008;14:1822. doi: 10.1002/chem.200701546. [DOI] [PubMed] [Google Scholar]; c) Wang Z, Palacios MA, Anzenbacher P., Jr Anal Chem. 2008;80:7451. doi: 10.1021/ac801165v. [DOI] [PubMed] [Google Scholar]; d) Dale TJ, Rebek J., Jr Angew Chem Int Ed. 2009;48:7850. doi: 10.1002/anie.200902820. [DOI] [PubMed] [Google Scholar]
- 8.Meaney MS, McGuffin VL. Anal Bioanal Chem. 2008;391:2557. doi: 10.1007/s00216-008-2194-6. [DOI] [PubMed] [Google Scholar]
- 9.Goodey A, Lavigne JJ, Savoy SM, Rodriguez MD, Curey T, Tsao A, Simmons G, Wright J, Yoo SJ, Sohn Y, Anslyn EV, Shear JB, Neikirk DP, McDevitt JT. J Am Chem Soc. 2001;123:2559. doi: 10.1021/ja003341l. [DOI] [PubMed] [Google Scholar]
- 10.Rakow NA, Suslick KS. Nature. 2000;406:710. doi: 10.1038/35021028. [DOI] [PubMed] [Google Scholar]
- 11.Epstein JR, Walt DR. Chem Soc Rev. 2003;32:203. doi: 10.1039/b300617d. [DOI] [PubMed] [Google Scholar]
- 12.Lewis NS. Acc Chem Res. 2004;37:663. doi: 10.1021/ar030120m. [DOI] [PubMed] [Google Scholar]
- 13.Hewage HS, Wallace KJ, Anslyn EV. Chem Commun. 2007:3909. doi: 10.1039/b706624d. [DOI] [PubMed] [Google Scholar]
- 14.Lim SH, Feng L, Kemling JW, Musto CJ, Suslick KS. Nat Chem. 2009;1:562. doi: 10.1038/nchem.360. [DOI] [PMC free article] [PubMed] [Google Scholar]
- 15.Feng L, Musto CJ, Kemling JW, Lim SH, Suslick KS. Chem Commun. 2010;46:2037. doi: 10.1039/b926848k. [DOI] [PMC free article] [PubMed] [Google Scholar]
- 16.Walt DR. Chem Soc Rev. 2010;39:38. doi: 10.1039/b809339n. [DOI] [PubMed] [Google Scholar]
- 17.White J, Truesdell K, Williams LB, Atkisson MS, Kauer JS. PLoS Biol. 2008;6:e9. doi: 10.1371/journal.pbio.0060009. [DOI] [PMC free article] [PubMed] [Google Scholar]
- 18.He G, Zhang G, Lu F, Fang Y. Chem Mater. 2009;21:1494. [Google Scholar]
- 19.Bai H, Li C, Shi G. Sens Actuators B. 2008;130:777. [Google Scholar]
- 20.Burattini S, Colquhoun HM, Greenland BW, Hayes W, Wade M. Macromol Rapid Commun. 2009;30:459. doi: 10.1002/marc.200800630. [DOI] [PubMed] [Google Scholar]
- 21.Zyryanov GV, Palacios MA, Anzenbacher P., Jr Org Lett. 2008;10:3681. doi: 10.1021/ol801030u. [DOI] [PubMed] [Google Scholar]
- 22.Narayanan A, Varnavski OP, Swager TM, TG J Phys Chem. 2008;112:881. [Google Scholar]
- 23.Yang JS, Swager TM. J Am Chem Soc. 1998;120:5321. [Google Scholar]
- 24.Gao J, Strassler C, Tahmassebi D, Kool ET. J Am Chem Soc. 2002;124:11590. doi: 10.1021/ja027197a. [DOI] [PubMed] [Google Scholar]
- 25.Gao J, Watanabe S, Kool ET. J Am Chem Soc. 2004;126:12748. doi: 10.1021/ja046910o. [DOI] [PubMed] [Google Scholar]
- 26.Teo YN, Kool ET. Bioconj Chem. 2009;20:2371. doi: 10.1021/bc9003926. [DOI] [PMC free article] [PubMed] [Google Scholar]
- 27.Teo YN, Wilson JN, Kool ET. Chem Eur J. 2009;15:11551. doi: 10.1002/chem.200901607. [DOI] [PMC free article] [PubMed] [Google Scholar]
- 28.Teo YN, Wilson JN, Kool ET. J Am Chem Soc. 2009;131:3923. doi: 10.1021/ja805502k. [DOI] [PMC free article] [PubMed] [Google Scholar]
- 29.Wilson JN, Teo YN, Kool ET. J Am Chem Soc. 2007;129:15426. doi: 10.1021/ja075968a. [DOI] [PMC free article] [PubMed] [Google Scholar]
- 30.Ohlmeyer MH, Swanson RN, Dillard LW, Reader JC, Asouline G, Kobayashi R, Wigler M, Still WC. Proc Natl Acad Sci USA. 1993;90:10922. doi: 10.1073/pnas.90.23.10922. [DOI] [PMC free article] [PubMed] [Google Scholar]
- 31.Jurs PC, Bakken GA, McClelland HE. Chem Rev. 2000;100:2649. doi: 10.1021/cr9800964. [DOI] [PubMed] [Google Scholar]


