

Abstract
In recent years, mass spectrometry has become one of the core technologies for high throughput proteomic profiling in biomedical research. However, reproducibility of the results using this technology was in question. It has been realized that sophisticated automatic signal processing algorithms using advanced statistical procedures are needed to analyze high resolution and high dimensional proteomic data, e.g., Matrix-Assisted Laser Desorption/Ionization Time-of-Flight (MALDI-TOF) data. In this paper we present a software package-pkDACLASS based on R which provides a complete data analysis solution for users of MALDITOF raw data. Complete data analysis comprises data preprocessing, monoisotopic peak detection through statistical model fitting and testing, alignment of the monoisotopic peaks for multiple samples and classification of the normal and diseased samples through the detected peaks. The software provides flexibility to the users to accomplish the complete and integrated analysis in one step or conduct analysis as a flexible platform and reveal the results at each and every step of the analysis.
Availability
The database is available for free at http://cran.r-project.org/web/packages/pkDACLASS/index.html
Keywords: MALDI-TOF, proteome research, complete data analysis, R package
Background
In proteome research, high-throughput mass spectrometry (MS) establishes an effective framework for biomedical diagnosis and protein identification [1]. The novel biotechnology of high-throughput and high-resolution Matrix- Assisted Laser Desorption/Ionization Time-of-Flight mass spectrometry (MALDI-TOF MS) makes it promising to explore the low-molecular-weight region of proteins in bodily fluids like blood, serum, plasma, urine, for the diagnosis of significant patterns for various diseases [2]. High resolution MALDI-TOF MS is capable of collecting proteomic samples over a broad mass range in a single acquisition and has less measurement error; which also results in high accuracy measurement in terms of signal-to-noise ratio [3]. Thus, high-resolution MALDI-TOF MS has increasingly been used for early detection of disease, monitoring disease progression and measuring therapeutic effects of drugs [4]. Although, mass spectrometry has become one of the core technologies for high throughput proteomic profiling for biomedical research the reproducibility of the end results using this technology was in question. To discover and identify unique biomarker patterns hidden in complex and highdimensional mass spectra, robust computational algorithms have to be developed [3]. Moreover, it has been realized that sophisticated automatic signal processing algorithms using advanced statistical procedures [2] are needed to analyze such data. It is expected that manufacturer-independent open source software packages using R [5] framework will be the way to analyze these massive gigabytes of data. Scientists have already learnt the usefulness of the R software packages through Bioconductor for the microarray data analysis and so it is anticipated that this will also be the trend of quantitative proteomic research as well.
In this manuscript a software package named pkDACLASS based on open source R [5] language is introduced and presented. The R language for the software was chosen as a basis for the code as it is free, open source, easily available, widely supported and possible to implement modern statistical methods. In addition, it has many functions and packages that support the development of this open source package. Uniqueness of this software lies in its peak detection method. We introduce a statistical approach to identify the monoisotopic peaks of the peptide molecules following our recent publication [6]. Peak detection is one of the most important preprocessing steps in MSbased proteomic data analysis. The performance of peak detection directly affects the subsequent process, biomarker detection/protein identification and disease classification [4]. The novelty of the software is threefold. Not only does it provides improved statistical methods for peak detection following the chemistry of the peptide molecules for analyzing mass spectrometry proteomic data, but also integrates the other existing preprocessing protocols of baseline correction, denoising and introduces a simple alignment method to align multiple samples in the software. Lastly, it also integrates important existing classification algorithm to classify the diseased and non-diseased samples. Hence the software package pkDACLASS provides a complete data analysis solution for the users of MALDI-TOF MS proteomics raw data especially biomedical researchers with no statistics background. Complete data analysis comprises preprocessing of raw spectrum, monoisotopic peak detection, alignment of detected peaks from multiple samples and classification. The software provides flexibility to the users to accomplish the complete and integrated analysis in one step or conduct analysis as a flexible platform and reveal the results at each and every step of the analysis.
Monoisotopic Peak Detection
As stated earlier the uniqueness of this software lies in its peak detection method. The algorithmic details of the monoisotopic peak detection method for this software have been described in a recent research paper by [6]. For the sake of completeness we reintroduce the method here briefly. A basic preprocessing is done to the data to identify the monoisotopic peaks. Basic preprocessing of the raw data entails baseline correction, denoising and binning while the monoisotopic peak detection entails extraction of cluster of features defining possible isotopic distribution of the peptide molecules, modeling the isotopic distribution and goodness of fit test for checking the model. Baseline subtraction uses an algorithm to remove the baseline slope and offset from a spectrum by interactively calculating the best-fit straight line through a set of estimated baseline points. The baseline correction scheme relies on a method that has been implemented in PROcess package [7]. The baseline is subtracted by setting the bandwidth of “approx” method, in the routine bslnoff, to be 25%. The baseline was subtracted from each point and rescale intensity of all spectra to positive producing a baseline corrected spectrum. For denoising, a cutoff point h is chosen such that the features selected correspond to real peptide peak. The principle is based on keeping features with intensities greater than a certain threshold h. The threshold should be large enough to eliminate initial noisy region but small enough to retain any peak that could correspond to real observable proteins or peptides. Binning is applied to divide the m/z axis into intervals of desired length, which will help to extract meaningful isotopic patterns. The binning scheme works as follows: round all m/z values and within 1Da keep the one corresponding to the maximum intensity y. The method for extracting the isotopic distribution of peptides works as follows. We first identify clusters of features on a spectrum identified as possible isotopic distribution of peptide molecules. We assume that the features (m/z) in a peptide isotopic cluster are 1 Da apart for singly charged mass spectrometry data like MALDI-TOF data. Let a be the starting value for identifying a possible isotopic cluster in a spectrum. The isotopic cluster is identified by selecting features at a, a+1(±0.05), a+2(±0.05),… and stop if there is a gap. The gap exists when the distance between two consecutive features is greater than 1(±0.05) Da. The procedure is repeated from which all possible isotopic distribution patterns or clusters in the spectrum are formed. A mixture of location shifted Poisson model is fitted to each deamidated isotopically resolved peptide isotopic clusters. The parameters of the model are estimated by an EM algorithm. After fitting the model, a bootstrap test is used to check the adequacy of the model. In this scenario, we consider the problem of testing the goodness of fit of a location shifted Poisson model applied to the intensity values of a possible isotopic cluster. Record all the monoisotopic peaks by taking the mode of the Poisson distribution. If deamidation is involved then the maximum of the mode of the two Poisson distributions is taken. More details are provided in [6].
Peak Alignment
In terms of alignment of peaks from multiple samples with pkDACLASS, it is possible to align using either FLEC (our method) or the caMassClass R package [8]. The alignment algorithm (FLEC) for aligning multiple samples is as follows: align all spectra by adjusting intensities based on the corresponding m/z ratios. If the m/z values of multiple samples are all on the integer grid involving no decimal part then the corresponding initial intensities are maintained. If the m/z's are rational numbers then we consider that every rational m/z has a floor and ceiling denoted by the nearest integer larger and smaller than the corresponding rational number respectively. If the decimal part of m/z is 0.5, then the adjustment is such that 50% of the corresponding intensity goes to the ceiling and 50% goes to the floor. However, if the decimal part of the m/z value is greater than 0.5, then assign that proportion of the intensity to the ceiling of the corresponding rational m/z and assign ‘1- that proportion of the intensity to the floor’. The reverse is true if the decimal part is less than 0.5. All the denoised samples or the detected monoisotopic peaks of multiple samples can then be mapped to a matrix of integer m/z values and the corresponding sample intensities. In other words the first column of the matrix comprises the m/z values and the remaining columns are the respective sample intensities. In the example we worked with we aligned the peaks of multiple samples.
Peak Classification
To conclude, the software pkDACLASS classifies the samples based on the peaks using the randomForest R package [9] classifier in addition to considering equal numbers of cases and controls for the classification process. Optimal results are obtained when the number of peaks aligned is close to the highest number of peaks in the entire data set. The FLEC alignment algorithm is quite easy to implement and understand.
Data set used in this study
In the end, we analyze a proteomic data set in [10] to demonstrate the results and superiority of pkDACLASS. The data consists of MALDI-TOF MS spectra that extend from 800 to 10,000 Da obtained on serum samples from sixty-eight patients with Hepatocellular carcinoma (HCC) and sixty-eight controls. HCC or Hepatocellular carcinoma (also called malignant hepatoma) is a primary malignancy of the liver. Individuals with cirrhosis as described in [10] were not considered and some samples from the HCC and the control group were not used due to quality control issues.
Comparison with other existing software
The software allows flexibility in terms of aligning the samples. A flow chart of the algorithm is provided in Figure 1 above. To demonstrate the superiority of pkDACLASS using this dataset, a comparative study was carried out with two other existing peak detection methods namely LIMPIC [11] and Peak Harvester [12, 13]. The LIMPIC method proposed by [11] used a Kaiser digital moving window filter to obtain smoothed signal, then subtracted a signal trend for baseline removal. Once the baseline removal was completed, a local maxima is used to find the most significant peaks after eliminating the features with intensities lower than a non-uniform threshold proportional to the noise level. Then, the detected peaks are classified as either protein or noise peaks on the basis of their m/z values (see [11] for further details). On the other hand, the Peak Harvester [12, 13] method utilizes existing database knowledge to establish a linear equation between M the mean of a Poisson distribution and the peptide’s molecular weight m which is known. More details provided in [12, 13]. The number of peaks detected by pkDACLASS and the two other competing algorithms, number of peaks retained after alignment using our alignment algorithm FLEC, alignment algorithm of caMassClass and SpecAlign [14] and the results of the classification performances of the algorithms are reported in the supplementary document available through http://www.susmitadatta.org/Supp/pkDACLASS.
Figure 1.
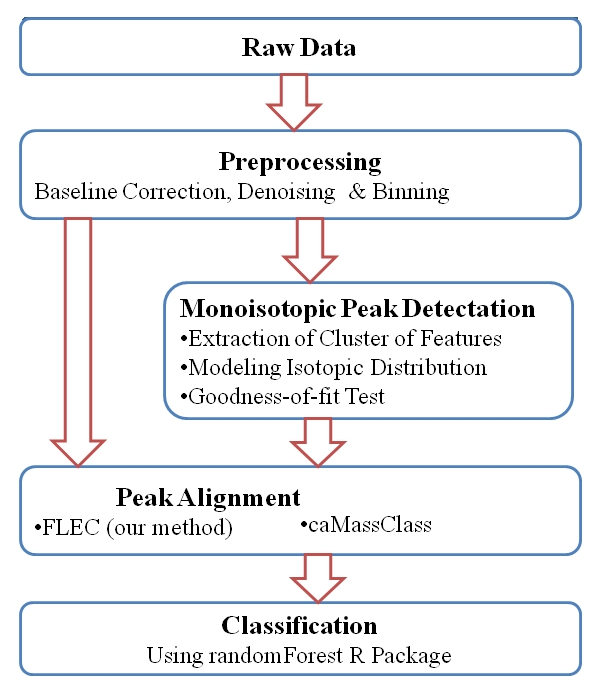
Flow chart of the algorithmic steps in pkDACLASS. The arrows indicate direction of analysis with input raw data as the start and classification as the last stage in the analysis.
Software Requirements
pkDACLASS is supported by the R [5] statistical framework version 2.12.0 and above. It is therefore supported by all frameworks that support R.
Software Input
In this package, users will have to provide the two dimensional data of raw mass to charge (m/z) ratio versus intensity (y) as the input data either in comma separated values (csv) or tab delimited text format. Because pkDACLASS is developed in R [5], any two dimensional file format of m/z versus intensity (y) supported by R [5] can serve as input data
Software Output
This software will provide the relevant monoisotopic peaks of peptides. Users are also able to plot the raw, baseline corrected, and the final denoised data. In addition, this software will align the detected monoisotopic peaks from multiple samples, classify the samples with these peaks and report the classification accuracy particularly and test performance measures in general. Finally, the software is able to conduct statistical test for differential analysis and report the differentially expressed monoisotopic peptide peaks for multiple samples along with multiple hypotheses correction. See the supplementary material (http://www.susmitadatta.org/Supp/pkDACLASS) to find the comparative performances of the classification (Area under the ROC curve) of our software opposed to similar software like LIMPIC [11] and Peak Harvester [12, 13] using the given dataset.
Workflow for pkDACLASS
Read input file into R [5] comprising raw mass to charge ratio (m/z) versus intensity (y) data which is then preprocessed. Thereafter, the data undergoes further analysis to obtain the unique monoisotopic peaks as described in the methodology section. Monoisotopic peaks from multiple samples can further be aligned. Alignment can be done using FLEC i.e., our alignment algorithm described above or using caMassClass R package [8] alignment algorithm. The last and final step is classification using the randomForest R package [9] classification algorithm which classifies the diseased and non-diseased samples.
Future Work
Currently, the software can support only MS-1 data. Further development will also include the MS/MS data and peptide mass fingerprinting for the identification of the associated proteins.
Acknowledgments
This work is funded by grants NIH-CA133844 (PI: Dr Susmita Datta), NSFDMS- 0805559 (PI: Dr. Susmita Datta) and the center grant 1P30ES014443.
Footnotes
Citation:Ndukum et al, Bioinformation 6(1): 45-47 (2011)
References
- 1.Q Liu, et al. BMC Genomics. 2009;10:S3. [Google Scholar]
- 2.JS Yu, et al. Bioinformatics. 2005;21:2200. [Google Scholar]
- 3.JH Oh, et al. Bioinformatics. 2008;24:1812. doi: 10.1093/bioinformatics/btn316. [DOI] [PubMed] [Google Scholar]
- 4.P Du, et al. Bioinformatics. 2006;22:2059. doi: 10.1093/bioinformatics/btl355. [DOI] [PubMed] [Google Scholar]
- 5. http://www.R-project.org/
- 6.M Atlas, S Datta. J Proteomics Bioinform. 2009;2:202. [Google Scholar]
- 7. http://www.bioconductor.org/help/bioc-views/release/bioc/html/PROcess.html.
- 8. http://CRAN.R-project.org/package=caMassClass.
- 9.A Liaw, M Wiener. R News. 2002;2(3):18. [Google Scholar]
- 10.HW Ressom, et al. Bioinformatics. 2007;23:619. [Google Scholar]
- 11.D Mantini, et al. BMC Bioinformatics. 2007;8:101. doi: 10.1186/1471-2105-8-101. [DOI] [PMC free article] [PubMed] [Google Scholar]
- 12.EJ Breen, et al. Electrophoresis. 2000;21:2243. doi: 10.1002/1522-2683(20000601)21:11<2243::AID-ELPS2243>3.0.CO;2-K. [DOI] [PubMed] [Google Scholar]
- 13.EJ Breen, et al. Spectroscopy. 2003;17:579. [Google Scholar]
- 14.JW Wong, et al. Bioinformatics. 2005;21(9):2088. doi: 10.1093/bioinformatics/bti300. [DOI] [PubMed] [Google Scholar]