

Abstract
Perinatal asphyxia is a leading cause of brain injury in infants, occurring in 2–4 per 1000 live births. The clinical response to asphyxia is variable and difficult to predict with current diagnostic tests. Reliable biomarkers are needed to help predict the timing and severity of asphyxia, as well as response to treatment. Two-dimensional gas chromatography-time-of-flight-mass spectrometry (GC x GC-TOFMS) was used herein, in conjunction with chemometric data analysis approaches for metabolomic analysis in order to identify significant metabolites affected by birth asphyxia. Blood was drawn before and after 15 or 18 minutes of cord occlusion in a Macaca nemestrina model of perinatal asphyxia. Postnatal samples were drawn at 5 minutes of age (n=20 subjects). Metabolomic profiles of asphyxiated animals were compared to four controls delivered at comparable gestational age. Fifty metabolites with the greatest change pre- to post-asphyxia were identified and quantified. The metabolic profile of post-asphyxia samples showed marked variability compared to the pre-asphyxia samples. Fifteen of the 50 metabolites showed significant elevation in response to asphyxia, ten of which remained significant upon comparison to the control animals. This metabolomic analysis confirmed lactate and creatinine as markers of asphyxia and discovered new metabolites including succinic acid and malate (intermediates in the Krebs cycle) and arachidonic acid (a brain fatty acid and inflammatory marker) as potential biomarkers. GC × GC-TOFMS coupled with chemometric data analysis are useful tools to identify acute biomarkers of brain injury. Further study is needed to correlate these metabolites with severity of disease, and response to treatment.
Keywords: Hypoxia-ischemia, chemometrics, GC x GC-TOFMS, neurodevelopment, metabolomics
1. Introduction
Perinatal asphyxia, defined as a severe lack of oxygen and perfusion to the fetus during labor and delivery, occurs in 2–4 of every 1000 live-born term infants and accounts for an estimated 23% (approximately 920,000) of neonatal deaths each year worldwide [1]. Some survivors sustain life-long neurodevelopmental handicaps that include mental retardation, cerebral palsy, seizures and learning disabilities, while others may be relatively unscathed [2–4]. The ability to differentiate those who will do well and those who will not is critical for parents, caretakers, and scientists studying neuroprotection. Many of the current approaches for the determination of prognosis rely on qualitative clinical markers. For example, Sarnat staging, the most commonly used stratification method, uses clinical indicators to separate infants into mild, moderate and severe encephalopathy stages [5]. The Thompson scale is another clinical staging tool [6]. More quantitative approaches have been investigated with the use of magnetic resonance imaging and spectroscopy [7,8], electroencephalography [9], and analysis of serum or CSF components such as lactate [10], but no definitive predictors or combination of predictors have been identified and validated.
The metabolome is the collection of all small metabolites in a biological cell, tissue, organ or organism, which are the end products of cellular processes. Because the metabolome is dynamic, perturbations such as birth asphyxia are likely to influence metabolite levels. Perinatal hypoxia-ischemia (another term for perinatal asphyxia) can lead to multisystem organ dysfunction [11,12], which in turn can result in large changes in the circulating metabolome. Identification of these altered metabolites, or biomarkers, might provide sensitive and specific information about severity of injury. Some potential markers such as neuron-specific enolase [13] and S100 [14,15] have been previously identified and are being investigated further, but it is important to continue searching for markers that can predict the timing and severity of the perinatal event and its neurologic outcome.
Metabolomics is the analysis of the metabolome, the unique chemical fingerprint that specific cellular processes leave behind [16,17]. There are many instrumentation approaches to metabolomic analysis, but separation techniques such as gas chromatography (GC), high performance liquid chromatography (HPLC), or capillary electrophoresis (CE) are generally required to determine specific metabolic biomarkers. Separation techniques coupled to mass spectrometry (MS) or nuclear magnetic resonance (NMR) spectroscopy have previously been shown to provide insight into the biochemical status of a biological system affected by specific conditions such as diabetes, cystic fibrosis, cancer, and preterm labor [18–23].
Two-dimensional gas chromatography coupled to time-of-flight mass spectrometry (GC × GC-TOFMS) is a powerful instrumentation approach that offers exceptional resolving power by spreading metabolites into two separation dimensions [24–31]. The benefits of a two dimensional separation include increased sensitivity and specificity to separate analytes from similar compounds. The search for biomarkers of asphyxia is further aided by the application of sophisticated data analysis software to find the class-distinguishing compounds within the data [32,33]. The state-of-the-art chemometric data analysis software, the Fisher ratio algorithm [34], is one approach that has been used to identify class-distinguishing compounds by calculating the between class ratio to the within class ratio [35,36].
In this report, GC × GC-TOFMS was used to analyze the pre- and post-asphyxia metabolome (i.e., forming two classes) of newborn Macaca nemestrina in an attempt to identify potential biomarkers. These metabolomes were compared to those from control animals. The Fisher ratio algorithm was used to identify metabolites that differed due to asphyxia. Statistical significance of these changes was determined by comparison to the control group. This approach to metabolomic analysis can identify metabolites affected by a hypoxic-ischemic insult to discover potential biomarkers of perinatal asphyxia in a non-human primate model of perinatal asphyxia [37].
2. Experimental
2.1 Primate delivery protocol
Time pregnant Macaca nemestrina were anesthetized for hysterotomy 5±2 days prior to term (172 days). Immediately after entering the uterus, the pre-birth blood sample was obtained by venipuncture from the umbilical cord. After obtaining this sample, the umbilical cord was clamped for 15 or 18 minutes prior to delivery to produce perinatal asphyxia (n=20) [37]. Prior to this period, a 2.5 French umbilical arterial catheter (Vygon, Montgomeryville, PA, USA) was placed into the ascending aorta via the umbilical cord. Animals in the control group (n=5) did not undergo cord clamping following the placement of the umbilical artery catheter. After delivery, all animals were stabilized by a team of neonatologists using standardized neonatal resuscitation principles. Apgar scores [38,39], vital signs, and serial laboratory parameters were collected. At 5 minutes of age, the post-birth blood sample was drawn from the umbilical catheter for metabolomic analysis. Blood samples were collected into heparinized containers, immediately centrifuged at 4°C, and plasma samples (200 μl) were snap frozen in liquid nitrogen and stored at −80°C until extraction.
2.2 Chemicals and Reagents
Millipore (Millipore Corp, Bedford, MA, USA) purified water and reagent grade methanol (Sigma Aldrich, St Louis, MO, USA) were used for the extraction protocol. For GC x GC-TOFMS sample preparation, derivatization chemistry was applied to make the sample extracts amenable to gas phase analysis. Reagent grade pyridine and methoxyamine hydrochloride (Sigma Aldrich, St Louis, MO, USA) were used in the preparation of a methoximation reagent. Trimethylsilation reagent (TMS) [N, O-bis(trimethylsilyl)trifluoroacetamide (BSTFA) + trimethylchlorosilane (TMCS)], 99:1) (Sigma Aldrich, St. Louis, MO, USA) was used in the second derivatization.
2.3 Metabolite extraction, derivatization, and instrumentation
To extract the metabolites from the plasma, a total of 450 μl of methanol: water (8:1 v/v) was added to each 50 μl sample. The samples were vortexed for 10 s, placed on ice for 10 min and then vigorously extracted using a Branson probe sonicator for 2 min. After brief incubation on ice, the samples were centrifuged at 15,000 g for 10 min [40]. Following this, 200 μl aliquots of the supernatant were transferred to a GC vial insert and evaporated to dryness. Derivatization entailed a two-step procedure that included methoximation and trimethylsilylation of the extracted samples, as previously reported [41]. A 1 μl sample of each derivatized sample was injected in triplicate to GC × GC-TOFMS. An Agilent 6890 gas chromatograph (Agilent Technologies, Palo Alto, CA, USA) was paired with a LECO Pegasus III TOFMS (LECO Corp., St. Joseph, MI, USA) [40]. The instrument was outfitted with the commercially available Agilent 7683 auto injector and 4D-thermal modulator ((LECO Corp., St. Joseph, MI, USA). The first column, 20 m × 250 μm i.d. × 0.5 μm Rtx-5MS (Restek, Bellefonte, PA, USA), separated the metabolites primarily by volatility. A temperature program was applied beginning at 60 °C for 0.25 min followed by a ramp of 8 °C/min to a final temperature of 280 °C. The carrier gas was helium with a flow rate of 1 ml/min, maintained at the head of the first column. At 1.5 s intervals, effluent from column one was transferred to a second column by thermal modulation with the modulator temperature 40 °C higher than the column one temperature throughout the chromatographic separation. The second column, 2 m × 180 μm i.d. × 0.2 μm Rtx-200MS (Restek, Bellefonte, PA, USA), separated primarily based on polarity and followed the same temperature program as column one, maintained 10°C higher throughout. After a 5 min solvent elution delay, effluent from column two was detected by the TOFMS where the ions generated by the electron beam were collected from m/z 40 to 600 at an acquisition rate of 100 spectra/s. The TOFMS ion source was set to 250 °C. Data were collected with the LECO ChromaTOF software v 3.32 (LECO, St. Joseph, MI, USA).
2.4 Data Analysis
The first 11 primates of the asphyxia group were processed at the same time and were used for metabolite discovery. Two time points from each animal (pre- and post-birth) were extracted and run in triplicate, providing a total of 66 chromatograms for use in determining class-distinguishing analytes (i.e., those that differ between sample groups). A mathematical algorithm, Fisher ratio analysis, was used to calculate a ratio of the between class variation to the within class variation at every point within the chromatograms on each mass channel (m/z) 40–600 [34]. This provided a list of retention times for analytes that differed between classes while controlling for within-class variation. Metabolites were primarily identified by matching the retention times and mass spectra of the discovered metabolite to those in an in-house library of derivatized metabolite standards that were injected and categorized using the same instrumentation. Tentative identifications were made on metabolites that were not found in the in-house library by comparing mass spectra from external libraries, including the NIST library and KEGG database. The analytes identified to differ were quantified for all 20 asphyxiated samples and 5 control samples using Parallel Factor Analysis (PARAFAC), a deconvolution algorithm that provides the signal volume-under-the-curve of each metabolite peak [42]. Significance of the elevation of metabolites was determined by the paired Student’s t-test (p<0.05). Principal Component Analysis (PCA) [32,33,35] was used on the peak signal volume data to demonstrate variability between groups using PLS toolbox version 5.2.2 for MatLab (Math Works, Natick, MA, USA). The unpaired Student’s t-test was used to identify significance of individual metabolite concentration changes pre- and post-birth between the asphyxia (n=20) and control groups (n=4 after exclusion of one primate) (p<0.05). Because of the substantial difference between experimental and control group size (20 vs. 4), equal variance could not be assumed during statistical analysis.
3. Results
3.1 Primate Characteristics
Twenty primates from the asphyxia group and 5 primates from the control group were included in this study. One of the control animals, primate C2, displayed clinical characteristics of asphyxia, including perinatal depression, initial blood gas with pH 6.85, base excess −22, peak lactate 16 mmol/l. Therefore, data from this primate was excluded from analysis because it did not exhibit characteristics of a true control primate. Table 1 illustrates characteristics of the control and asphyxia groups. There were no group differences in gender or birth weight between control and asphyxia groups. There was a significant difference between groups upon evaluation of Apgar scores at 1, 5, and 10 min. Additional differences were found in the initial blood gas measurements between groups, including initial pH, partial pressure of carbon dioxide (pCO2), and base excess (BE), as well as peak lactate level. These differences demonstrate the presence of perinatal asphyxia in the experimental group when compared to the control group.
Table 1.
Primate Demographics
| Control (n=4) | Asphyxia (n=20) | p-value | |
|---|---|---|---|
| Gender (male:female) | 3:1 | 10:10 | n/a |
| Birth weight (grams) | 559±71 | 584±81 | 0.551 |
| Apgar score* | |||
| 1 minute | 3.3±2.5 | 0.4±0.5 | 0.106 |
| 5 minute | 5±0.82 | 2.1±0.89 | 0.002 |
| 10 minute | 8±0 | 2.9±0.97 | <0.001 |
| Initial pH | 7.2±0.17 | 6.78±0.08 | 0.015 |
| Initial pCO2 (mmHg) | 58±18 | 111±27.6 | 0.002 |
| Initial BE | −6±5.3 | −19±3.7 | 0.010 |
| Peak Lactate (mmol/l) | 5.5±3.24 | 12.8±1.7 | 0.018 |
The Apgar score is a standard value to describe the clinical condition of a neonate shortly after birth [38]. It evaluates skin color, heart rate, reflex irritability, muscle tone, and breathing. Each category gives a score from 0–2 with a total Apgar score out of 10 at each time point. A score of 10 indicates the best clinical condition. A score of less than 4 at 5 minutes is strongly suggestive of perinatal asphyxia [39].
3.2 Plasma Metabolomics
For each plasma sample processed through GC × GC-TOFMS, a two-dimensional chromatogram was generated, with a third dimension of mass spectral data, an example of which is shown in Figure 1. During the trimethylsilylation reaction, hydrogen bonding sites of metabolites were replaced with a TMS group, which is represented by mass channel m/z 73. As demonstrated by the 2D (Figure 1a) and contour plots (Figure 1b) of m/z 73, which allow for visualization of all metabolites that have been derivatized, multiple analytes can be detected with this method. There is increased intensity of many analytes in the post-birth chromatogram when compared to the pre-birth chromatogram. This represents an increase in metabolites located at their respective retention times on the post-birth chromatogram.
Figure 1. A GC x GC-TOFMS chromatogram of a primate pre-birth and post-birth in the asphyxia group.
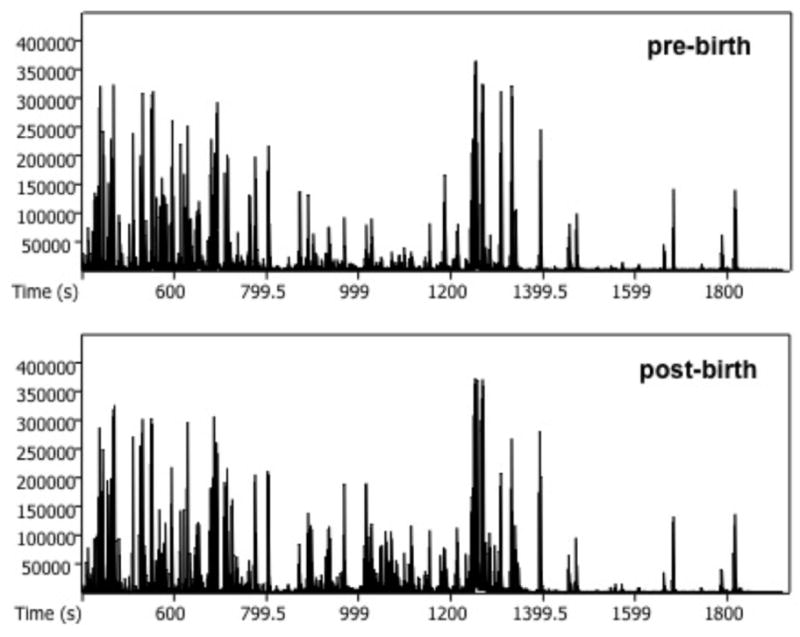
(a) Two-dimensional unfolded chromatogram showing increased signal of metabolite peaks in the post-birth sample compared to the pre-birth sample. The x-axis shows the unfolded retention times for the first and second columns. The y-axis shows signal intensity on m/z 73. (b) Contour plots of same pre- and post-birth samples showing increased signal post-birth in the asphyxia group. The x-axis shows column 1 retention time (s), and the y-axis shows column 2 retention time (s). The color bar demonstrates the signal intensity of each peak plotted on the chromatogram on m/z 73.
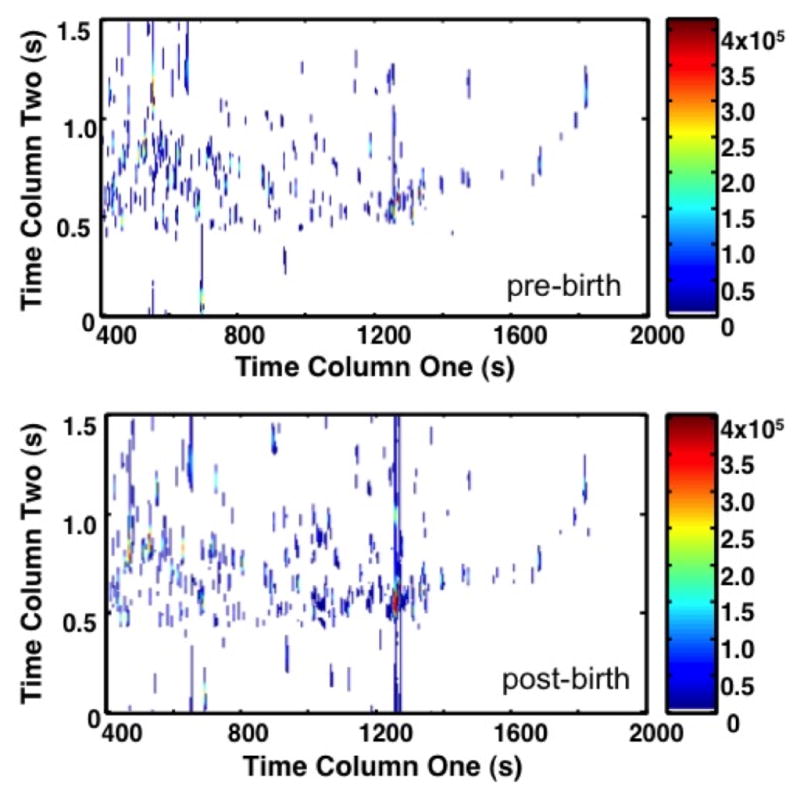
PCA and Fisher ratio analyses were applied to identify the areas of significant increased metabolite concentration (Figure 2). On both topographical views of the 2D plots (Figure 2a and b), only metabolites with the most variance in chemical information (ie; the between class variation) are highlighted between chromatograms. When comparing the PCA to the Fisher ratio plot, different metabolites are noted to have variance. PCA is unsupervised, thus by nature it will highlight metabolites that have variance both between classes and within classes. This approach leads to an increased number of false-positive results for significant metabolites. In fact, so many peaks are highlighted by PCA that Figure 2a has a similar appearance to the raw chromatogram data shown in Figure 1. In contrast, the Fisher ratio is supervised, which means that it controls for within-class variation (or the biological variation between primates) [34]. The metabolites highlighted by the Fisher ratio plot (Figure 2b) demonstrate only those metabolites that have high variance between the pre-birth samples and post-birth samples, representing those that have the most potential as diagnostic biomarkers. The Fisher ratio algorithm has been successfully applied to a wide range of sample types to reliably find differences between classes. [27,34,35]
Figure 2. Principal Component Analysis (PCA) Plot and Fisher Ratio Plot on all m/z for primates A1 through A11.
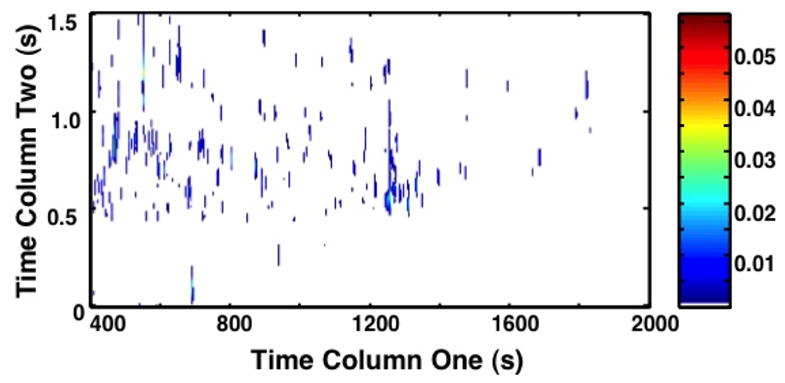
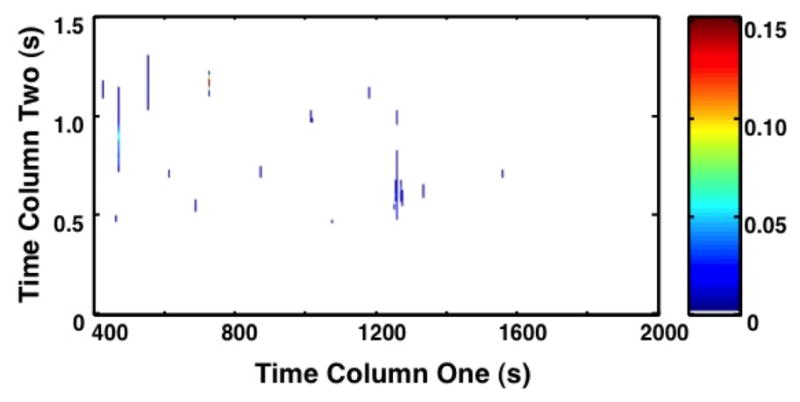
(a) The contour 2D plot of absolute values of PCA loadings. Peaks correspond with areas of the chromatograms with increased variance upon direct comparison. The x-axis shows the column 1 retention time (s), and the y-axis column 2 retention time (s). The color bar demonstrates the signal intensity of each peak plotted on the chromatogram. PCA plot demonstrates the peaks identified by PCA that have variance between samples without controlling for within group variation. (b) The contour 2D sum of Fisher ratio plots for m/z 40–600. The x-axis shows column 1 retention time (sec). The y-axis shows column 2 retention time (s). The color bar demonstrates the signal intensity of each peak plotted on the chromatogram. Peaks correspond with areas of the chromatograms with variance between sample groups (pre- versus post-birth) while controlling for within class variation (primate biological variance). The reduced number of peaks compared to (a) demonstrates a refined subset of data targeting specific areas of interest.
The Fisher ratio analysis generated coordinates on the original GC x GC-TOFMS chromatograms for subsequent data mining. We used the mass spectra from the original chromatograms to identify the metabolites of interest by comparison to standard metabolite databases. Further confirmation of metabolite identify was gained through matching retention times to standards, as noted. Table 2 contains the names and retention time coordinates of the top 15 metabolites with significant change between the two classes. The metabolites are listed in order of highest Fisher ratio with a corresponding match value (MV) provided. The metabolites listed in the table are those with significant elevation between pre-birth and post-birth time points using the paired Student’s t-test. All p-values are <0.05. The relative standard deviation (%RSD) of the triplicate injections was calculated for each metabolite and the average %RSD across all samples is displayed in the table, demonstrating the precision of the instrumentation. The %RSD ranged from 6.1 to 16.9% with a mean value of 13.5%. 9H-purine, creatinine, and butanoic acid are considered to have “tentative identification” because their identity was determined with an external mass spectral library instead of matching both retention time and mass spectra to the in-house library of standards. The total ion current (TIC) of each chromatogram is also included to demonstrate the change of intensity between the pre- and post-birth samples. It was noted that the absolute intensity of the TIC is 100–10,000 fold higher than the intensity of the individual metabolites. This demonstrates that although there are significantly large changes in each individual metabolite, this does not significantly impact the TIC. It was also noted that there is no significant change in the intensity of the TIC post-birth compared to pre-birth. This shows that approximately equal quantities of plasma were injected into the instrument per run. As demonstrated by previous studies [32], the TIC serves as a good internal standard, useful in supporting the significance of the elevations in key metabolites affected by birth and asphyxia. The %RSD is 3.83% further demonstrating the precision of the instrument.
Table 2.
Metabolites with significant elevation following asphyxia event identified using Fisher-ratio
| Metabolite | Fisher ratio | Retention Times (Column 1, Column 2) (s) | Match Value | Relative Standard Deviation (%) | Pre-birth Asphyxia (n=11) (PARAFAC Signal) | Post-birth Asphyxia (n=11) (PARAFAC Signal) | p-value |
|---|---|---|---|---|---|---|---|
| Total Ion Current | n/a | n/a | n/a | 3.83 | 4.88×10⁹ | 4.45×10⁹ | 0.470 |
| Succinic acid | 0.1523 | 726, 1.18 | 947 | 10.37 | 2.93×10⁵ | 1.53×10⁷ | <0.001 |
| Lactic acid | 0.0594 | 471, 0.9 | 938 | 6.12 | 6.94×10⁷ | 1.39×10⁸ | <0.001 |
| Glutamic acid^ | 0.0085 | 1017, 0.99 | 954 | 11.28 | 5.07×10⁵ | 3.64×10⁶ | <0.001 |
| Glutamic acid* | 0.0077 | 939, 0.28 | 945 | 10.39 | 4.22×10⁶ | 9.07×10⁶ | <0.001 |
| 9H-Purine+ | 0.0072 | 1179, 1.14 | 781 | 16.99 | 1.86×10⁵ | 1.38×10⁶ | <0.001 |
| Malate | 0.0071 | 900, 0.96 | 840 | 12.34 | 4.71×10⁵ | 2.59×10⁶ | <0.001 |
| Glycerol | 0.0053 | 688.5, 0.53 | 966 | 10.82 | 9.84×10⁶ | 1.74×10⁷ | 0.002 |
| Glucose-1-P | 0.0041 | 1017, 0.51 | 816 | 25.91 | 1.11×10⁶ | 2.79×10⁶ | <0.001 |
| Arachidonic acid | 0.0038 | 1558.5, 0.71 | 835 | 15.36 | 2.31×10⁵ | 1.03×10⁶ | <0.001 |
| Leucine | 0.0017 | 687, 0.85 | 959 | 12.95 | 7.19×10⁶ | 9.96×10⁶ | 0.034 |
| Creatinine+ | 0.0016 | 969, 0.82 | 801 | 11.73 | 1.48×10⁶ | 2.48×10⁶ | 0.007 |
| Fructose | 0.0015 | 1236, 0.51 | 919 | 13.29 | 6.32×10⁵ | 1.33×10⁶ | <0.001 |
| Myo-Inositol | 0.0015 | 1396.5, 0.69 | 894 | 14.09 | 9.66×10⁶ | 1.30×10⁷ | 0.038 |
| Butanoic acid+ | 0.0009 | 645, 0.88 | 852 | 16.06 | 5.04×10⁴ | 3.09×10⁵ | <0.001 |
| Pantothenic acid | 0.0008 | 1318.5, 1.22 | 868 | 15.07 | 3.08×10⁵ | 4.77×10⁵ | 0.033 |
minor peak
major peak
Tentative identification
Abbreviation: Glucose-1-P: Glucose-1-Phosphate
Once the metabolites were identified from the original chromatograms of the first 11 primate samples, Parallel Factor Analysis (PARAFAC) was used to deconvolute the pure peak profile for the target analyte from overlapping analytes and background noise. This provided a signal volume proportional to concentration for each metabolite. A ratio of signal change was calculated between the pre-birth and post-birth samples to identify the degree of metabolite elevation. Table 3 contains the mean ± standard deviation of the top 15 metabolites identified using the original Fisher ratio data with concentration changes of pre-birth to post-birth in both the asphyxiated group (n=20) and the control group (n=4). The total ion current (TIC) of each chromatogram is also included to demonstrate the degree of change between the pre- and post-birth samples. It was noted that there was only a 3–9% increase in the TIC post-birth compared to pre-birth. This supports there was no significant change in the TIC despite the significant increases in the individual metabolites identified. The process of birth without asphyxia results in an increase in 10 of the metabolites listed. However, the degree of increase in the asphyxiated group is significantly higher than in controls. This suggests that the degree of increased intensity is due to the asphyxia and not the birth process alone. The metabolites that had the largest difference were succinic acid, malate, and butanoic acid. Glutamic acid and 9H-purine were not eligible for the t-test because the level was below detection in 4 control animals. However, based on the degree of difference between groups, one might predict that this difference would be significant if more samples were in the control group. A trend for an increase in leucine following asphyxia was also noted (p=0.084). When comparing change in concentration of those asphyxiated for 15 minutes (A1-7) versus 18 minutes (A8-20), the number in each population was too small to determine significance between groups for any metabolite.
Table 3.
Change in post-birth to pre-birth concentration ratios of metabolites identified using Fisher ratio comparing asphyxia group to control group
| Control (n=4) [post-birth]/[pre-birth] | Asphyxia (n=20) [post-birth]/[pre-birth] | p-value | |
|---|---|---|---|
| Total Ion Current | 1.03 ± 0.1 | 1.09 ± 0.1 | 0.286 |
| Succinic acid | 21.3 ± 14 | 59.6 ± 24.9 | 0.003 |
| Lactic acid | 1.1 ± 0.1 | 2.1 ± 0.5 | <0.001 |
| Glutamic acid^+ | 3.1 | 9.3 ± 5.2 | n/a+ |
| Glutamic acid* | 1.4 ± 0.8 | 2.4 ± 1 | 0.103 |
| 9H-Purine+ | 0.7 | 8.7 ± 5.7 | n/a+ |
| Malate | 3.6 ± 1.7 | 6.5 ± 2.8 | 0.027 |
| Glycerol | 1.2 ± 1 | 2.8 ± 2.1 | 0.043 |
| Glucose-1-P | 1.2 ± 0.4 | 4.4 ± 2.9 | <0.001 |
| Arachidonic acid | 1.2 ± 0.5 | 4.9 ± 1.8 | <0.001 |
| Leucine | 0.8 ± 0.5 | 1.4 ± 0.4 | 0.084 |
| Creatinine | 1.1 ± 0.4 | 1.8 ± 0.8 | 0.021 |
| Fructose | 0.8 ± 0.2 | 2 ± 1.1 | <0.001 |
| Myo-Inositol | 1.5 ± 0.6 | 1.4 ± 0.3 | 0.646 |
| Butanoic acid+ | 1.5 ± 1.2 | 6.6 ± 2.4 | <0.001 |
| Pantothenic acid | 1 ± 0.3 | 2.2 ± 1 | <0.001 |
unable to perform unpaired Student’s t-test due to control n=1
minor peak
major peak
Abbreviation: Glucose 1-P: Glucose 1-Phosphate
Figure 3 shows a heat map of the metabolite concentration changes for visual comparison. Each concentration is standardized to the average of the pre-birth samples for each metabolite, allowing for visualization of the degree of change post-birth that occurs for each metabolite in each primate. Control animal C2, who was excluded from data analysis, is included in the heat map to show this primate’s profile before and after birth. As seen with the relative concentrations listed in Table 3, the metabolites shown increase in both control and asphyxiated animals in response to birth. The degree of increase (as shown by red/yellow color tones) is much more pronounced in the asphyxiated animals compared to controls. Certain metabolites appear to be more sensitive to increase when compared to others. These metabolites include succinic acid, glutamic acid, malate, arachidonic acid, and butanoic acid. Some primates have a larger degree of response than others. When looking at the control group, primate C2 has an increase in the more sensitive metabolites (specifically succinic acid and butanoic acid). This is consistent with this primate showing signs of asphyxia at birth. In the asphyxia group, primates A15 and A20 died as a result of perinatal asphyxia. Primate A15’s metabolome shows substantial elevation of sensitive metabolites, including succinic acid, glutamic acid, malate, and glucose-1-phosphate. A20 did not show the same response.
Figure 3. Heat map demonstrating change in concentration of metabolites identified by Fisher ratio comparing asphyxia group to control group.

The 15 identified metabolites are listed on the y-axis. The individual primates are listed on the x-axis. Each square represents one metabolite from one primate sample. Samples are standardized to 1 to demonstrate degree of change. Samples with colors along the yellow/red spectrum have increased PARAFAC intensity demonstrating increased metabolite concentration compared to the mean. This heat map demonstrates that the pre-birth cord blood samples are similar to each other in both the control and asphyxia group. The asphyxia group shows marked elevation in metabolite concentration compared to control group demonstrating the affects of asphyxia on the primate metabolome. Bold font designates metabolites with significant changes in metabolite concentration as shown in Table 3 (p<0.05).
* unable to perform unpaired Student’s t-test due to control n=1
Figure 4 shows the filtered metabolome by group, and demonstrates the variance of the identified metabolites. PCA can be used as an unsupervised tool to identify metabolites with variance, and can also be used as a comparison tool after metabolites with variance have been identified [32,33,35]. Since we have already identified the metabolites, PCA was now used in a supervised way to compare metabolites and ultimately to affirm that the analytes identified through Fisher ratio analysis do distinguish the sample classes. Figure 4 demonstrates that there is minimal variance between the pre-birth samples in all the primates – both control and asphyxia – in the metabolites selected by Fisher ratio. The x-axis plots the pre- and post-birth metabolome of the control and asphyxia groups. The y-axis plots the PC1 loading score, which demonstrates the degree of variance each primate metabolome has when compared to the others. If samples are similar, they will be located on similar planes on the y-axis. The pre-birth samples in both groups have similar y-values, demonstrating their similarity to each other and their overall minimal variance. Birth results in increased variance in both groups compared to pre-birth, however, the asphyxia group (triangle symbol) has a much larger degree of difference compared to the control group (circle symbol). Control animal C2 who was excluded from the initial data analysis, is included in this Figure to demonstrate the sensitivity of this analysis and the ability to detect an animal with asphyxia that was unanticipated. Primate A14 has pre-birth levels that are much different from the other 19 pre-birth samples in the asphyxia group. This potentially represents prenatal asphyxia that occurred before the experimental insult.
Figure 4. Principal Component Analysis plot confirming variance of pre- and post-birth and asphyxia group to control.
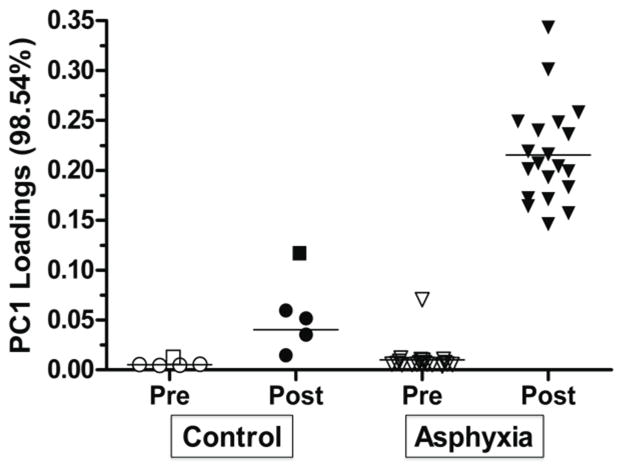
Principal Component 1 (PC1) loadings demonstrate variance between samples that were previously identified by Fisher ratio. The x-axis plots the 4 groups of metabolomes – pre- and post-birth of the control and asphyxia groups. The y-axis plots the PC1 loading score, which demonstrates the degree of variance each primate metabolome has when compared to the others. Pre-birth samples have similar PC1 loadings (unfilled shapes). All post-birth samples have increased PC1 loadings compared to pre-birth. There are increased PC1 loadings (i.e. increased variance) in post-birth asphyxia group compared to the control group. The square shape represents control C2 who was eliminated from data analysis. The outlier in the pre-birth asphyxia group represents A14, a primate that had a pre-birth profile more comparable to the post-birth asphyxia group.
4. Discussion
The goal of this study was to use metabolomics and discovery-based data analysis tools to identify potential biomarkers of perinatal asphyxia. We identified 10 metabolites that increase following perinatal asphyxia. Eight of these metabolites are novel markers of perinatal asphyxia (Tables 2 and 3). Lactate and creatinine are currently the two primary metabolites used clinically to assess the degree of hypoxic-ischemic injury due to perinatal asphyxia [43]. Our findings are consistent with the existing literature for these two compounds, and add novel biomarkers that may be clinically important. Additionally, this is the first time that this methodology has been applied to such a complex model for the discovery of such biomarkers.
Succinic acid was the most sensitive metabolite to asphyxia, demonstrated by the 60-fold increase in concentration found in the asphyxia group. Malate was also significantly increased by asphyxia. Both succinic acid and malate are intermediates within the Krebs cycle, a pathway of aerobic metabolism, up-stream from the reduction-oxidation reaction converting NAD+ or FAD++ to NADH or FADH2 respectively. Under oxidative stress, NADH metabolism within the mitochondria in association with the Krebs cycle is disrupted [44]. Thus, it is reasonable that metabolites upstream of reduction-oxidation reactions will be elevated since hypoxia-ischemia leads to oxidative stress. Interestingly, this process was rapid and occurred within 5 minutes of birth (or 20 minutes of the onset of an asphyxia insult).
Arachidonic acid also showed marked elevation due to asphyxia. Arachidonic acid is found within the phospholipid bilayer of the cell membrane. It can be released by phospholipase A2, becoming a central metabolite for the generation of prostacyclines, thromboxanes, and leukotrienes [45]. Aside from its role within the inflammatory cascade, it has been found to be a regulator of pulmonary vascular tone [46]. It is unclear whether the elevation of arachidonic acid is due to the disruption of the cell membrane or to downstream interruption of its metabolic pathways.
Data from three subjects in this study were of particular interest and suggest the metabolites identified will be useful clinically. Primate A15 required a prolonged resuscitation following the 18-minute asphyxia insult. Following birth, the animal died due to complications of asphyxia. This primate’s initial blood gas (pH 6.78, base excess of −25) and peak lactate (15.8 mmol/l) were on the severe end of the spectrum of values in the asphyxia group. The metabolome revealed marked elevation of metabolites sensitive to asphyxia, including succinic acid, glutamic acid, malate, and butanoic acid. This suggests that these metabolites, or a combination of these metabolites might provide a more accurate reflection of degree of hypoxia-ischemia than current tests. Next, the control primate C2 was delivered after a normal pregnancy, with clinical symptoms of perinatal asphyxia, as well as consistent laboratory findings (initial blood gas: pH 6.85, base excess of −22, and peak lactate of 16 mmol/l). The metabolome revealed elevation of many metabolites consistent with perinatal asphyxia, including succinic acid, malate, and arachidonic acid. Finally, primate A14 had elevated markers of asphyxia in the pre-birth sample before the hypoxic-ischemic insult was applied. We speculate that this animal experienced intrauterine compromise that was unrecognized clinically. Further work must be done to determine whether these data correspond to outcome data.
While this study has identified at least 10 metabolites that change significantly due to asphyxia, it is possible that additional small molecule biomarkers exist. Unlike genomics or proteomics where complete data sets can be identified with a single analysis approach, there is no single instrument or extraction method that will capture the complete metabolome of an organ or organism [47]. For example, GC-MS does not identify organic diphosphates or metabolites larger than trisaccharides [48]. GC × GC-TOFMS is a high-order instrument that offers the advantages of excellent resolution and coverage for a large set of metabolites.
It is important to note that the samples were extracted and chromatographically separated in three batches based on the delivery dates of the primates. Each batch was run on a new set of columns, which caused some degree of intensity variation of the peaks and slight retention time shifting of the peak locations on the chromatogram. Due to this shifting, the Fisher ratio could not be applied to all chromatograms. Feature selection was accomplished with the initial 11 primates that were all processed at the same time. This does not affect quantification, but any differences due to asphyxia not represented in the first 11 primates may not have been identified. Quantification was still accurately accomplished by adjusting the PARAFAC search templates to span the correct peak location, a procedure that is standard with PARAFAC analysis. Another limitation is the small control group (n=4), which limited our ability to prove significance in some of the metabolites identified.
We have identified a preliminary metabolomic profile that is most affected by acute perinatal asphyxia in a nonhuman primate model. We plan to further evaluate how this profile changes over time, how it is affected by perinatal treatments (normothermia, hypothermia, erythropoietin, and hypothermia plus erythropoietin), and whether this profile correlates to neurodevelopmental outcomes at 9 months of age (which corresponds roughly to 36 months of human development). We hypothesize that metabolites or combinations of metabolites identified in this analysis will correlate with outcomes of the asphyxiated primates, leading to biomarkers with high predictive potential. Progressive analysis of previously acquired data may even reveal additional important biomarkers. Once optimized, the methodology used in this analysis has great potential to be translated into more clinically accessible methods.
5. Conclusions
Through metabolomic analysis, we have identified a profile of metabolites that have significant elevation in response to birth asphyxia. These metabolites represent possible biomarkers of perinatal asphyxia. Further studies are needed to identify the pathophysiologic mechanism of the elevation of each metabolite, and the predictive value of each one. Ideally, an asphyxia panel will result, which will improve our ability to diagnose degree of asphyxia, phase of disease, response to treatment, and ultimately, prognosis.
Acknowledgments
This study was supported by an ITHS Pilot award, NIH grants R01-HD-52820-01, an ARRA supplement to R01-HD-52820-01 and P30 HD02274 through the Washington Regional Primate Research Center and the National Institute of Child Health and Human Development. We thank the infant primate lab staff for all their help with the care of these animals.
Footnotes
Publisher's Disclaimer: This is a PDF file of an unedited manuscript that has been accepted for publication. As a service to our customers we are providing this early version of the manuscript. The manuscript will undergo copyediting, typesetting, and review of the resulting proof before it is published in its final citable form. Please note that during the production process errors may be discovered which could affect the content, and all legal disclaimers that apply to the journal pertain.
References
- 1.Lawn JE, Cousens S, Zupan J. Lancet. 2005;365:891. doi: 10.1016/S0140-6736(05)71048-5. [DOI] [PubMed] [Google Scholar]
- 2.Gluckman PD, Wyatt JS, Azzopardi D, Ballard R, Edwards AD, Ferriero DM, Polin RA, Robertson CM, Thoresen M, Whitelaw A, Gunn AJ. Lancet. 2005;365:663. doi: 10.1016/S0140-6736(05)17946-X. [DOI] [PubMed] [Google Scholar]
- 3.Shankaran S, Laptook AR. Clin Obstet Gynecol. 2007;50:624. doi: 10.1097/GRF.0b013e31811eba5e. [DOI] [PubMed] [Google Scholar]
- 4.Azzopardi DV, Strohm B, Edwards AD, Dyet L, Halliday HL, Juszczak E, Kapellou O, Levene M, Marlow N, Porter E, Thoresen M, Whitelaw A, Brocklehurst P. N Engl J Med. 2009;361:1349. doi: 10.1056/NEJMoa0900854. [DOI] [PubMed] [Google Scholar]
- 5.Sarnat HB, Sarnat MS. Arch Neurol. 1976;33:696. doi: 10.1001/archneur.1976.00500100030012. [DOI] [PubMed] [Google Scholar]
- 6.Thompson CM, Puterman AS, Linley LL, Hann FM, vanderElst CW, Molteno CD, Malan AF. Acta Paediatrica. 1997;86:757. doi: 10.1111/j.1651-2227.1997.tb08581.x. [DOI] [PubMed] [Google Scholar]
- 7.Rutherford M, Ward P, Allsop J, Malamatentiou C, Counsell S. Early Hum Dev. 2005;81:13. [Google Scholar]
- 8.Barkovich AJ, Miller SP, Bartha A, Newton N, Hamrick SE, Mukherjee P, Glenn OA, Xu D, Partridge JC, Ferriero DM, Vigneron DB. AJNR Am J Neuroradiol. 2006;27:533. [PMC free article] [PubMed] [Google Scholar]
- 9.Spitzmiller RE, Phillips T, Meinzen-Derr J, Hoath SB. J Child Neurol. 2007;22:1069. doi: 10.1177/0883073807306258. [DOI] [PubMed] [Google Scholar]
- 10.Ramaswamy V, Horton J, Vandermeer B, Buscemi N, Miller S, Yager J. Pediatr Neurol. 2009;40:215. doi: 10.1016/j.pediatrneurol.2008.09.026. [DOI] [PubMed] [Google Scholar]
- 11.Martin-Ancel A, Garcia-Alix A, Gaya F, Cabanas F, Burgueros M, Quero J. J Pediatr. 1995;127:786. doi: 10.1016/s0022-3476(95)70174-5. [DOI] [PubMed] [Google Scholar]
- 12.Shah P, Riphagen S, Beyene J, Perlman M. Arch Dis Child Fetal Neonatal Ed. 2004;89:F152. doi: 10.1136/adc.2002.023093. [DOI] [PMC free article] [PubMed] [Google Scholar]
- 13.Celtik C, Acunas B, Oner N, Pala O. Brain Dev. 2004;26:398. doi: 10.1016/j.braindev.2003.12.007. [DOI] [PubMed] [Google Scholar]
- 14.Kecskes Z, Dunster KR, Colditz PB. Pediatr Res. 2005;58:953. doi: 10.1203/01.PDR.0000182591.46087.7D. [DOI] [PubMed] [Google Scholar]
- 15.Thorngren-Jerneck K, Alling C, Herbst A, Amer-Wahlin I, Marsal K. Pediatr Res. 2004;55:406. doi: 10.1203/01.PDR.0000106806.75086.D3. [DOI] [PubMed] [Google Scholar]
- 16.Dettmer K, Hammock BD. Environ Health Perspect. 2004;112:A396. doi: 10.1289/ehp.112-1241997. [DOI] [PMC free article] [PubMed] [Google Scholar]
- 17.Ceglarek U, Leichtle A, Brugel M, Kortz L, Brauer R, Bresler K, Thiery J, Fiedler GM. Mol Cell Endocrinol. 2009;301:266. doi: 10.1016/j.mce.2008.10.013. [DOI] [PubMed] [Google Scholar]
- 18.Connor SC, Hansen MK, Corner A, Smith RF, Ryan TE. Mol Biosyst. 2010;6:909. doi: 10.1039/b914182k. [DOI] [PubMed] [Google Scholar]
- 19.DeFeo EM, Cheng LL. Technol Cancer Res Treat. 2010;9:381. doi: 10.1177/153303461000900407. [DOI] [PubMed] [Google Scholar]
- 20.Giskeodegard GF, Grinde MT, Sitter B, Axelson DE, Lundgren S, Fjosne HE, Dahl S, Gribbestad IS, Bathen TF. J Proteome Res. 2010;9:972. doi: 10.1021/pr9008783. [DOI] [PubMed] [Google Scholar]
- 21.Goonewardena SN, Prevette LE, Desai AA. Curr Atheroscler Rep. 2010;12:267. doi: 10.1007/s11883-010-0112-9. [DOI] [PMC free article] [PubMed] [Google Scholar]
- 22.Robroeks CM, van Berkel JJ, Dallinga JW, Jobsis Q, Zimmermann LJ, Hendriks HJ, Wouters MF, van der Grinten CP, van de Kant KD, van Schooten FJ, Dompeling E. Pediatr Res. 2010;68:75. doi: 10.1203/PDR.0b013e3181df4ea0. [DOI] [PubMed] [Google Scholar]
- 23.Romero R, Mazaki-Tovi S, Vaisbuch E, Kusanovic JP, Chaiworapongsa T, Gomez R, Nien JK, Yoon BH, Mazor M, Luo J, Banks D, Ryals J, Beecher C. J Matern Fetal Neonatal Med. 2010 doi: 10.3109/14767058.2010.482618. [DOI] [PMC free article] [PubMed] [Google Scholar]
- 24.Seeley JV, Kramp F, Hicks CJ. Analytical Chemistry. 2000;72:4346. doi: 10.1021/ac000249z. [DOI] [PubMed] [Google Scholar]
- 25.Shellie R, Mondello L, Marriott P, Dugo G. Journal of Chromatography A. 2002;970:225. doi: 10.1016/s0021-9673(02)00653-2. [DOI] [PubMed] [Google Scholar]
- 26.Bruckner CA, Prazen BJ, Synovec RE. Analytical Chemistry. 1998;70:2796. [Google Scholar]
- 27.Mohler RE, Dombek KM, Hoggard JC, Pierce KM, Young ET, Synovec RE. Analyst. 2007;132:756. doi: 10.1039/b700061h. [DOI] [PubMed] [Google Scholar]
- 28.Pierce KM, Hoggard JC, Mohler RE, Synovec RE. J Chromatogr A. 2008;1184:341. doi: 10.1016/j.chroma.2007.07.059. [DOI] [PubMed] [Google Scholar]
- 29.Liu Z, Phillips JB. Journal of Chromatographic Science. 1991;29:227. [Google Scholar]
- 30.Beens J, Adahchour M, Vreuls RJJ, van Altena K, Brinkman UAT. Journal of Chromatography A. 2001;919:127. doi: 10.1016/s0021-9673(01)00785-3. [DOI] [PubMed] [Google Scholar]
- 31.Kinghorn RM, Marriott PJ. Journal of High Resolution Chromatography. 1998;21:620. [Google Scholar]
- 32.Humston EM, Dombek KM, Hoggard JC, Young ET, Synovec RE. Analytical Chemistry. 2008;80:8002. doi: 10.1021/ac800998j. [DOI] [PMC free article] [PubMed] [Google Scholar]
- 33.Mohler RE, Tu BP, Dombek KM, Hoggard JC, Young ET, Synovec RE. Journal of Chromatography A. 2008;1186:401. doi: 10.1016/j.chroma.2007.10.063. [DOI] [PMC free article] [PubMed] [Google Scholar]
- 34.Pierce KM, Hoggard JC, Hope JL, Rainey PM, Hoofnagle AN, Jack RM, Wright BW, Synovec RE. Anal Chem. 2006;78:5068. doi: 10.1021/ac0602625. [DOI] [PubMed] [Google Scholar]
- 35.Humston EM, Knowles JK, McShea A, Synovec RE. Journal of Chromatography A. 2010;1217:1963. doi: 10.1016/j.chroma.2010.01.069. [DOI] [PubMed] [Google Scholar]
- 36.Mohler RE, Dombek KM, Hoggard JC, Pierce KM, Young ET, Synovec RE. The Analyst. 2007;132:756. doi: 10.1039/b700061h. [DOI] [PubMed] [Google Scholar]
- 37.Juul SE, Aylward E, Richards T, McPherson RJ, Kuratani J, Burbacher TM. Dev Neurosci. 2007;29:311. doi: 10.1159/000105472. [DOI] [PubMed] [Google Scholar]
- 38.Hogan L, Ingemarsson I, Thorngren-Jerneck K, Herbst A. Eur J Obstet Gynecol Reprod Biol. 2007;130:169. doi: 10.1016/j.ejogrb.2006.03.002. [DOI] [PubMed] [Google Scholar]
- 39.Apgar V. Curr Res Anesth Analg. 1953;32:260. [PubMed] [Google Scholar]
- 40.Trygg JAJ, Gullberg J, Johansson AI, Jonsson P, Antti H, Marklund SL, Moritz T. Anal Chem. 2005;77:8086. doi: 10.1021/ac051211v. [DOI] [PubMed] [Google Scholar]
- 41.Fiehn O, Kopka J, Trethewey RN, Willmitzer L. Anal Chem. 2000;72:3573. doi: 10.1021/ac991142i. [DOI] [PubMed] [Google Scholar]
- 42.Hoggard JC, Synovec RE. Anal Chem. 2007;79:1611. doi: 10.1021/ac061710b. [DOI] [PubMed] [Google Scholar]
- 43.Liu L, Zheng CX, Peng SF, Zhou HY, Su ZY, He L, Ai T. Neonatology. 2010;97:41. doi: 10.1159/000227292. [DOI] [PubMed] [Google Scholar]
- 44.Tretter L, Adam-Vizi V. J Neurosci. 2000;20:8972. doi: 10.1523/JNEUROSCI.20-24-08972.2000. [DOI] [PMC free article] [PubMed] [Google Scholar]
- 45.Seeds MC, Bass DA. Clin Rev Allergy Immunol. 1999;17:5. doi: 10.1007/BF02737594. [DOI] [PubMed] [Google Scholar]
- 46.Fike CD, Kaplowitz MR, Pfister SL. Am J Physiol Lung Cell Mol Physiol. 2003;284:L316. doi: 10.1152/ajplung.00228.2002. [DOI] [PubMed] [Google Scholar]
- 47.Dunn WB, Bailey NJ, Johnson HE. Analyst. 2005;130:606. doi: 10.1039/b418288j. [DOI] [PubMed] [Google Scholar]
- 48.Weckwerth W, Fiehn O. Curr Opin Biotechnol. 2002;13:156. doi: 10.1016/s0958-1669(02)00299-9. [DOI] [PubMed] [Google Scholar]