

Abstract
The phosphoinositide 3-kinase (PI3K) pathway regulates mammalian cell growth, survival, and motility and plays a major pathogenetic role in human prostate cancer (PCa). However, the oncogenic contributions downstream of the PI3K pathway made by mammalian target of rapamycin complex 1 (mTORC1)–mediated cell growth signal transduction in PCa have yet to be elucidated in detail. Here, we engineered constitutive mTORC1 activation in prostate epithelium by a conditional genetic deletion of tuberous sclerosis complex 1 (Tsc1), a potent negative regulator of mTORC1 signaling. Epithelial inactivation was not immediately tumorigenic, but Tsc1-deficient mice developed prostatic intraepithelial neoplasia (mPIN) in lateral and anterior prostates by 6 months of age, with increasing disease penetrance over time. Lateral prostate lesions in 16- to 22-month-old mutant mice progressed to two types of more advanced lesions, adenomatous gland forming lesion (Type 1) and atypical glands embedded in massively expanded reactive stroma (Type 2). Both Type 1 and Type 2 lesions contained multiple foci of microinvasive carcinoma. Epithelial neoplastic and atypical stromal lesions persisted despite 4 weeks of RAD001 chemotherapy. Rapalogue resistance was not due to AKT or extracellular signal-regulated kinase 1/2 activation. Expression of the homeobox gene Nkx3.1 was lost in Tsc1-deficient mPIN, and it cooperated with TSC1 loss in mPIN initiation in doubly mutant Tsc1:Nkx3.1 prostatic epithelial knockout mice. Thus, TSC1 inactivation distal to PI3K and AKT activation is sufficient to activate a molecular signaling cascade producing prostatic neoplasia and focal carcinogenesis.
Introduction
Human prostate cancer (PCa) develops via multistage progression over a particularly long duration, associated with progressive accumulation of mutations and epigenetic alterations in oncogenes and tumor suppressors. The phosphoinositide 3-kinase (PI3K) pathway, which plays a major role in mammalian cell growth, survival, and motility, has emerged as a central regulator of human PCa. PCa PI3K pathway activation occurs via complete loss or haploinsufficiency in the suppressor of this pathway, phosphatase and tensin homologue deleted on chromosome 10 (PTEN), occurring in 20% to 70% of primary PCa and 30% to 80% of locally advanced and metastatic disease (1-3). Conditional deletion of the Pten gene in mouse prostate epithelium leads to invasive prostate adenocarcinoma (4), further supporting a key etiologic role of PI3K signaling in prostate neoplasia.
Among many proposed functions, the PI3K pathway promotes mammalian cell growth through constitutive activation of the AKT and mammalian target of rapamycin complex 1 (mTORC1) protein kinase signaling module. AKT activates mTORC1 in part through inhibitory phosphorylation of tuberous sclerosis complex 2 (TSC2; refs. 5-8). TSC2 heterodimerizes with TSC1, and heterodimer formation is required for both TSC2 protein stabilization and activation of GTPase (GAP) function on the small G protein, RHEB (9-12). GTP-RHEB is a direct activator of mTORC1, which in turn promotes ribosomal biogenesis, enhances protein and lipid synthesis, and prevents autophagy (reviewed in ref. 13).
Like upstream PTEN, TSC1 and TSC2 are tumor suppressors. Originally identified through their involvement in an inherited tumor syndrome affecting multiple soft tissues of mesenchymal origin (14), TSC1 and TSC2 genetic alterations have been identified in sporadic carcinomas of the bladder and head and neck, implicating the genes as broad spectrum human tumor suppressors (15-18). Nonetheless, TSC1/TSC2 seems to be much less commonly involved in human cancer than PTEN or LKB1. There is limited data on mutation or deletion of TSC1 or TSC2 in human PCa, but strong evidence suggests TSC1/2 functional inactivation in this disease. In addition to AKT, TSC1/2 GAP activity toward RHEB is inhibited by extracellular signal-regulated kinase 1/2 (ERK1/2) pathway phosphorylation (19, 20). Moreover, loss of LKB1, seen in advanced PCa, produces reduced AMPK activity, diminution of TSC1/TSC2 suppression, and consequent mTORC1 activation (21). As AKT, ERK1/2, and AMPK all phosphorylate TSC2 at distinct sites (21, 22), multiple aberrant signaling pathways may cause combinatorial TSC1/2 inactivation, enabling gradations of mTORC1 dysregulation during human PCa progression.
To date, the direct effect of TSC1/2 inactivation on PCa pathogenesis has not been tested in a preclinical model. Induction of preneoplastic hyperplasia without neoplastic progression in transgenic mouse prostates overexpressing RHEB suggested that either an insufficient level of mTORC1 activation was attained by RHEB overexpression, or mTORC1 activation alone was insufficient to produce carcinogenesis (23).
Here, we tested the role of persistent constitutive mTORC1 pathway activation in prostate carcinogenesis using a novel mouse model of TSC1 deletion in prostate epithelium. Homozygous Tsc1 loss of function and consequent mTORC1 hyperactivation produced two histologic and molecular forms of spontaneous prostate carcinogenesis in aged mice, both associated with precursor (mouse prostatic intraepithelial neoplasia) mPIN lesions. Thus, TSC1/2-mTORC1 pathway activation alone is sufficient to initiate prostate neoplasia and facilitate malignant transformation.
Materials and Methods
Mouse experiments
All animal work was approved by the Washington University Animal Studies Committee. Mice harboring a loxP-flanked Tsc1 allele (Tsc1fl) and PB-Cre4 (PBCre) transgenic mice have been described previously (4, 14), and the expression of the PB-Cre4 transgene has been shown to be specific for prostate epithelial cells (4). PBCre males (FVB/n) and Tsc1fl/fl females (mixed BALB/c, C57BL/6, and 129/SvJae) were intercrossed in a two-step breeding strategy to generate the target PbCre+-Tsc1fl/fl genotype. The mixed genetic background of the PbCre+-Tsc1fl/fl mice could underlie differences in tumor phenotype, i.e., penetrance and time of onset of tumor development between our study and that of others in the literature. Germ-line Nkx3.1 knockout mice used to generate Pb-Cre+Tscfl/fl Nkx3.1ko/ko have been described previously (24). In the chemotherapy trial, six PbCre+Tsc1fl/fl mice (16–22 month of age) were treated with 7.5 μg/g of RAD001 (Novartis Corp.) by gavage three times per week for 4 weeks. A cohort of 22-month-old mice was castrated, and genitourinary tracts were removed 4 weeks later.
Tissue harvest and histology
Male genitourinary tracts were harvested from formalin-perfused mice, fixed by microwave, and dissected following a standard procedure (25, 26). The isolated anterior prostates (AP) and urethra containing dorsal, lateral, and ventral prostates were processed through graded alcohols and xylenes and embedded in paraffin so that coronal/sagittal (APs) and transverse (urethra) sections were obtained. For histology, 5-μm sections were stained with H&E, and images were obtained with a DP70 color Bayer mosaic digital camera (Olympus America) with MicroSuite Biological Suite v5 software (Olympus Soft Imaging Solutions).
Immunofluorescence and immunohistochemistry
Sections were deparaffinized, rehydrated, washed in PBS (pH 7.4), and blocked with serum-free Dako Protein Block (Dako North America). Antigen retrieval was performed in 1× Reveal Decloaker reagent (pH6.0; Biocare Medical) with a pressure cooker. Primary antibodies were diluted in Dako Antibody Diluent. Primary antibodies included rabbit anti-α-SMA (1:500, Abcam), rabbit anti-desmin (1:250 IF; 1:4,000 IHC, Abcam), rat anti-cytokeratin 8 (TROMA-1; 1:500, Developmental Studies Hybridoma Bank, University of Iowa), rabbit anti-cytokeratin 5 (1:1,000, Covance), rabbit anti-Nkx3.1 (1:100, a gift from J. Milbrandt, WUSM), rabbit anti-E-cadherin (1:200, Cell Signaling Technology), rabbit anti-phosphorylated AKTS473 (1:250, Cell Signaling Technology), rabbit anti-phosphorylated ERK1/2T202/Y204 (1:100, Cell Signaling Technology), rabbit anti-Ki67 (1:2,000, Vector Labs), and rabbit anti-phosphorylated S6S235/236 (1:500, Cell Signaling Technology). The slides were incubated with corresponding secondary antibodies conjugated with Alexa Fluor 488 and Alexa Fluor 594 (1:400; Invitrogen) and counterstained for nuclei with SlowFade Gold Antifade mounting reagent with 4′,6-diamidino-2-phenylindole (Invitrogen). Fluorescence microscope images were collected using a Soft Imaging Solutions FVII digital camera with MicroSuite Biological Suite software (Olympus). Immunohistochemical staining was carried out following our previously published protocol (27).
Immunoblotting
Snap-frozen prostate tissues were homogenized in radioim-munoprecipitation assay buffer (1× PBS, 1% Nonidet-P40, 1% sodium deoxycholate, 0.1% SDS, 1 mmol/L EDTA, and 1% Triton X-100) supplemented with Protease Inhibitor Cocktail (1:50, Sigma-Aldrich), 5 mmol/L NaF, and Phosphatase Inhibitor Cocktail 1 and 2 (1:50, Sigma-Aldrich). Protein lysates (100 μg) were separated on polyacrylamide gels by electrophoresis and transferred to polyvinylidene difluoride membranes. Membranes were blocked in TBS (pH 7.6) containing 0.5% Tween 20 (TBST) and 10% nonfat dry milk, briefly washed in wash buffer (0.5% nonfat dry milk in TBST) and incubated in wash buffer containing rabbit antibodies for TSC1, phosphorylated S6KT389, S6K, phosphorylated S6S235/236, ribosomal protein S6, phosphorylated eIF4GS1108, eIF4G, phosphorylated AKTS473, AKT, phosphorylated ERK1/2T202/Y204, ERK1/2 (all 1:1,000, Cell Signaling Technology), and a rabbit polyclonal antibody for β-tubulin (1:35,000, Abcam). Membranes were washed once with high-salt buffer (TBST containing 0.5 mol/L NaCl and 0.5% nonfat dry milk), two times with wash buffer, and incubated in wash buffer with goat anti-rabbit IgG-horseradish peroxidase conjugate (1:1,000, Santa Cruz) for 30 minutes. After one wash with high-salt buffer and three times with wash buffer, peroxidase activity was revealed by enhanced chemiluminescence using ECL Plus (GE Healthcare) and imaged using a Chemidoc XRS imaging system with Quantity One one-dimensional analysis software (Bio-Rad).
Statistical analysis
Data were expressed as the mean ± SD, and statistical significance was determined using two-tailed unpaired Student’s t test, Mann-Whitney U test, χ 2 test, or one-way ANOVA test followed by Bonferroni’s multiple tests using GraphPad PRISM software (GraphPad Prism).
Results
Tsc1 inactivation in mouse prostate epithelium induced constitutive mTORC1 activation
Consistent with conditional gene inactivation, TSC1 protein levels were drastically reduced in lateral prostates (LP) and APs of 5-month-old PbCre+Tsc1fl/fl mice (designated as Tsc1 KO) compared with Tsc1fl/fl (wild-type, WT) littermates but were similar to WT in heart, lung, liver, spleen, and testis (LP, Fig. 1A; AP and nonprostate, data not shown). Extracts from 5-month-old Tsc1 KO prostates exhibited elevated levels of phosphorylated S6S235/236, phosphorylated eIF4GS1108, and phosphorylated S6KT389, consistent with mTORC1 pathway activation, and diminution of phosphorylated AKTS473, evidence for concomitant mTORC2-negative feedback (LP, Fig. 1A; AP, data not shown). Phosphorylated S6S235/236 was uniformly distributed in each TSC1 KO luminal epithelial cell, in contrast to sporadic activation in WT counterparts as shown by cytokeratin 8 (keratin-8) colocalization (Supplementary Fig. S1A; high-magnification views of the same fields are shown in Fig. 1B), indicating that Tsc1 inactivation in prostate luminal cells led to cell autonomous constitutive mTORC1 activation. Notably, there was neither histopathology nor evidence of mTORC1 activation in the stroma of Tsc1 KO mice at this age (see below).
Figure 1.
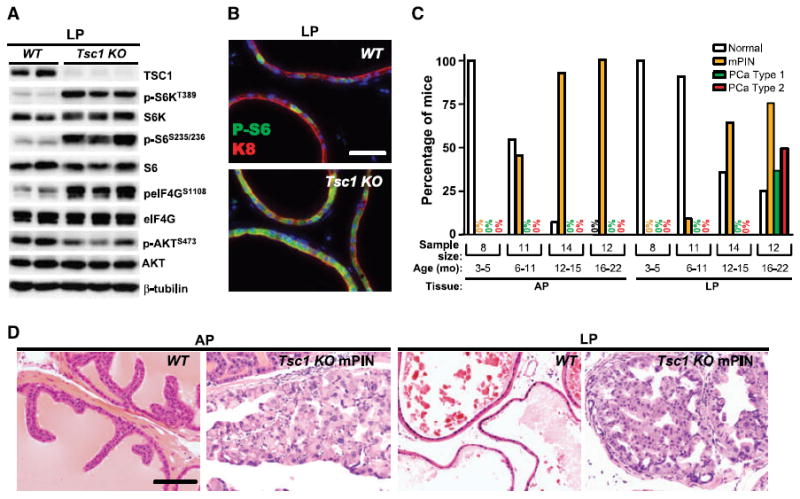
Adult Tsc1 KO mice develop spontaneous PCa. A, loss of TSC1 protein, mTORC1 pathway activation, and concomitant mTORC2 signaling attenuation in LPs of 5-mo-old Tsc1 KO mice (n = 3) compared with WT littermate controls (n = 2). B, uniform distribution of phosphorylated S6S235/236 (P-S6) immunofluorescence in K8(+) LP luminal epithelium of a 4-mo-old Tsc1 KO mouse compared with sporadic expression in a WT counterpart. C, the incidence of mPIN increased in APs and LPs of Tsc1 KO mice over time, and the incidence of Type 1 and Type 2 PCa also increased in LPs as mutant mice aged. D, H&E staining of normal AP and LP glands of a 17-mo-old WT mouse and AP and LP mPIN lesions of 15-mo-old Tsc1 KO mice. Low magnification views of the same fields are shown in Supplementary Fig. S1A and B. Bars, 50 μm (B) and 100 μm (D).
Adult Tsc1 KO mice developed spontaneous prostate carcinogenesis
Necropsy and histopathologic examination of genitourinary tracts were performed on adult Tsc1 KO mice between 3 and 22 months of age (n = 45). Age-matched WT littermates were negative controls (n = 27). Prostates of Tsc1 KO mice up to 5 months of age did not show any morphologic or histologic abnormality (Fig. 1C, 3–5 months, n = 8) despite chronic mTORC1 activation. At 6 months of age, mutant mice began to develop mPIN in LP and AP sites (6–11 months, n = 11) with disease penetrance increasing over time (12–15 months, n = 14), reaching 100% in APs and 75% in LPs in the 16- to 22-month-old group (n = 12; henceforth called the aged group). Tsc1 KO AP and LP mPIN lesions were often multifocal consisting of markedly enlarged epithelial cells with nuclear atypia that partially or completely filled the glandular lumen (Supplementary Fig. S1B; high-magnification views of the same fields are shown in Fig. 1D). Seven of 12 aged mutant mice developed visible LP enlargement with two also showing cystic AP dilation (Supplementary Fig. S1C and D). Further analyses focused on the LP because those lesions progressed (Fig. 2A–D) in contrast to mPIN persistence in the AP.
Figure 2.
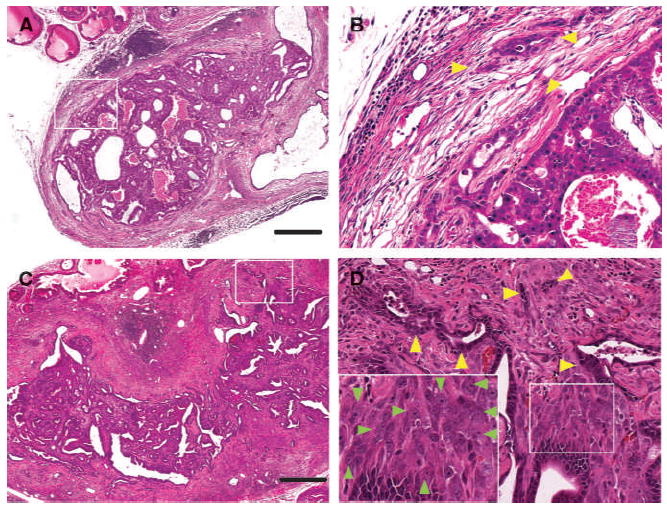
Aged Tsc1 KO mice developed two types of microinvasive PCa. A, histology of a massive Type 1 LP tumor of a 15-mo-old Tsc1 KO mouse showed multiple enlarged adenomatous glands and cystic glandular dilatation. B, higher magnification views of A revealed epithelial cells with enlarged cytoplasm and nuclear atypia (yellow arrowheads) invading eosinophilic reactive stroma. C, histology of a huge Type 2 LP tumor of a 16-mo-old Tsc1 KO mouse. D, higher magnification views of C revealed enlarged spindloid cells with nuclear atypia just beneath the basement membrane of atypical neoplastic glands (insets of D, green arrow heads). Type 2 tumors also contained multiple foci of epithelial invasion (yellow arrowheads). Bar, 500 μm (A and C).
LP tumor histology revealed complex, multicompartmental pathology (Supplementary Fig. S1D; Fig. 2A–D). There were two types of advanced lesions. One contained a marked accumulation of adenomatous glands, designated as Type 1 tumor pattern (Supplementary Fig. S1D, left; Fig. 2A). As Type 1 tumors contained multiple foci of epithelial cell microinvasion into reactive stroma (Fig. 2B, yellow arrowheads) or microvessels (data not shown), these lesions were designated as Type 1 cancers, which were detected in 4 of 12 mice of 16–22 months of age (33%). Type 2 lesions consisted of neoplastic epithelial cells with nuclear atypia arranged in glands with irregular borders and embedded in a massive accumulation of hyperplastic stroma (Supplementary Fig. S1D, right; Fig. 2C). Stromal abnormalities possessed two components. One was elongated and hypertrophic fibroblasts with nuclear enlargement, nucleolar prominence, and frequent mitotic figures, localized just beneath the basement membrane of atypical neoplastic glands (insets of Fig. 2D, green arrowheads). The second stromal component contained eosinophilic mature fibroblasts (Fig. 2C). Type 2 tumors also contained focal epithelial cell invasion (Fig. 2D, yellow arrowheads) and, as such, were designated Type 2 cancers, which were detected in 6 of 12 mice of 16 to 22 months of age (50%).
Progressive proliferative activation during Tsc1 KO prostate carcinogenesis
To further determine mechanisms of Tsc1 multistage carcinogenesis, we determined the level and localization of proliferating cells in knockout prostates during aging (Fig. 3). As expected, the Ki67 index in normal prostates was extremely low (1–2%). Preneoplastic Tsc1 KO prostates evidenced equivalently low proliferation (data not shown). Both AP and LP mPIN lesions displayed significant elevation (4.1–4.7%) compared with WT prostates, with Ki67(+) cells restricted to neoplastic epithelium (Fig. 3A, top right versus top left). There was a differential progression in Ki67 index and disparate tissue compartmental localization of proliferative cells between Type 1 (9.3%) and Type 2 (16.3%) cancers. Type 1 proliferating cells were restricted to the neoplastic and malignant epithelial cells, whereas there was increased proliferation in both stroma and neoplastic epithelium of Type 2 cancers (Fig. 3A, bottom left versus bottom right).
Figure 3.
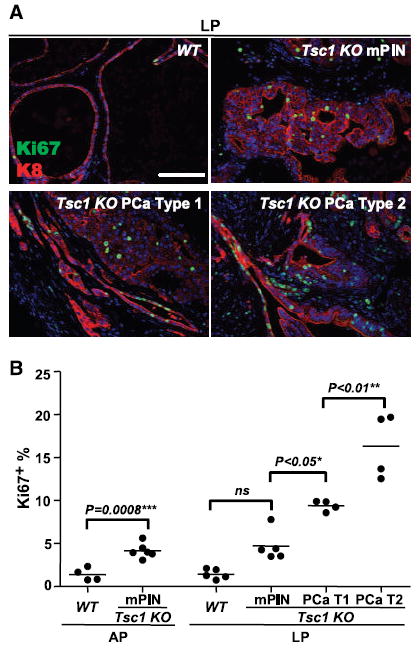
Progressive proliferative activation during Tsc1 KO prostate carcinogenesis. A, immunofluorescence analysis of Ki67 expression in WT LP glands, Tsc1 KO mPIN, and Type 1 and Type 2 PCa lesions. Ki67 (+) cells were localized to neoplastic epithelium in AP and LP mPINs, restricted to the Type 1 neoplastic and malignant epithelial cells, but showed bi-compartmental proliferative induction in Type 2 cancers. B, progressive increase in Ki67 index during Tsc1 KO prostate carcinogenesis (WT, 1–2%; mPIN, 4.1–4.7%; Type 1, 9.3%; Type 2, 16.3%). Bar, 100 μm (A).
Early-stage epithelial dysplasia, malignant transformation, and stromal remodeling in Tsc1 KO prostate carcinogenesis
Next, we interrogated mPIN and Type 1 and Type 2 cancers with a panel of antibodies specific for prostate epithelial differentiation dysregulation (keratin-5, keratin-8, and E-cadherin), mTORC1 activation (phosphorylated S6), and stromal remodeling/activation (desmin and smooth muscle actin; Fig. 4; Supplementary Fig. S2). Keratin-5, a basal cell marker, was circumferentially localized around each WT prostate ductule (Fig. 4; Supplementary Fig. S2, K5/K8, WT). Keratin-5 expression was markedly attenuated and sporadically distributed within neoplastic cells of Tsc1 KO mPIN lesions, lost in Type 1 cancers, but sporadically upregulated in clusters of neoplastic and malignant epithelial cells of Type 2 malignancies (Fig. 4; Supplementary Fig. S2). E-cadherin, an epithelial cell-to-cell junction molecule, was uniformly present in WT epithelia cells as well as in Tsc1 KO mPIN neoplastic cells but was reduced or absent in expression in subsets of Type 1 and Type 2 cancer cells (Fig. 4; Supplementary Fig. S2, E-CAD/K8; data not shown) consistent with the invasive phenotype of these cells. The mPIN and Type 1 malignant epithelial cells uniformly exhibited mTORC1 activation (Fig. 4; Supplementary Fig. S2, P-S6/K8), indicating a Tsc1-deficient luminal epithelial origin. Type 1 malignant microinvasion was strikingly evident by dual phosphorylated S6 and K8 labeling. In contrast, phosphorylated S6 was markedly elevated in stromal cells of Type 2 tumors with areas of microinvasive K8(+) cells also expressing the mTORC1 marker (Supplementary Fig. S3). mPIN induced stromal remodeling evidenced by loss of desmin and α-smooth muscle actin expression in the fibromuscular layer encircling neoplastic glands (Fig. 4, Tsc1 KO mPIN, DES/K8, and SMA/K8). Similar to phosphorylated S6, tissue compartmental desmin distribution distinguished Type 1 and Type 2 cancers; desmin was absent in Type 1 lesions but was markedly upregulated in Type 2 cancer stroma (Fig. 4 and Supplementary Fig. S2). To test the possibility that the Type 2 stromal cells were derived from subsets of Type 2 microinvasive cells with reduced or absent E-cadherin expression through an epithelial-to-mesenchymal transition (EMT), we investigated expression of zinc finger protein Snail, an E-cadherin transcriptional repressor and a potent EMT inducer. Despite extensive efforts, we could not detect Snail upregulation in invading epithelial cells or in desmin (+) stromal cells, nor could we detect keratin-8/desmin colocalization in mPIN or either type of malignant tumor (data not shown).
Figure 4.
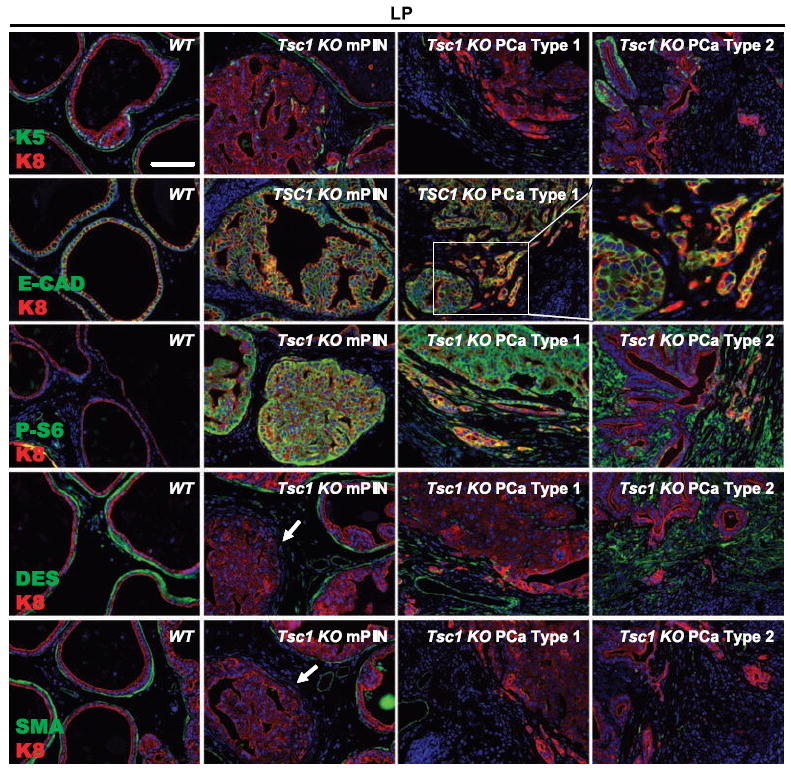
Epithelial and stromal marker alterations during Tsc1 KO prostate carcinogenesis. Progressive loss of keratin-5 (K5) expression during Tsc1 KO progression to Type 1 microinvasive cancer with stochastic focal reexpression in Type 2 tumors. E-cadherin was uniformly present in WT epithelial cells and neoplastic cells of Tsc1 KO mPINs, reduced or absent in expression in a subgroup of Type 1 and Type 2 malignant cells. Neoplastic and Type 1 malignant cells uniformly exhibited mTORC1 activation (P-S6), whereas stromal cells and microinvasive K8(+) cells of Type 2 tumors expressed the mTORC1 marker. Early-stage mPIN lesions progressively lost desmin and α-smooth muscle actin expression in the fibromuscular layer encircling neoplastic glands (arrows). Desmin was absent in Type 1 lesions but was markedly upregulated in Type 2 cancer stroma. Bar, 100 μm.
Tsc1 KO prostate lesions showed partial therapeutic responses to mTORC1 inhibitor RAD001
To determine whether mTORC1 signaling was required for the prostate disease maintenance, six aged Tsc1 KO mice (16–22 months) were treated for 4 weeks with mTORC1 inhibitor RAD001 (everolimus), an orally bioavailable derivative of rapamycin. As expected, the treatment produced a marked mTORC1 pathway inhibition in testes (Supplementary Fig. S4, P-S6) and prostates (Fig. 5A, P-S6/K8). RAD001 induced a prominent antiproliferative effect in the testis (Supplementary Fig. S3, Ki67) but had no effect on the proliferation in the prostate lesions (Fig. 5A, Ki67/K8; data not shown). mPIN was persistent in both the APs (six of six; Fig. 5B, AP) and LPs with a subset of LP lesions containing additional desmin (+) stroma (five of six and three of six, respectively; Fig. 5B, LP). Morphologically, RAD001 decreased but did not eliminate the prevalence of atypical giant cell epithelium in mPIN or stromal lesions, whereas microinvasive adenocarcinoma was notably undetectable in LPs of the treated mice, implying that mPIN and Type 2 stromal lesions were more resistant to RAD001 than microinvasion. The regression of enlarged mPIN glands was often accompanied by stromal fibrosis (Fig. 5B). Whereas the rapamycin resistance of these lesions is compelling, an expanded study with larger cohorts will be needed for adequate testing of this hypothesis.
Figure 5.
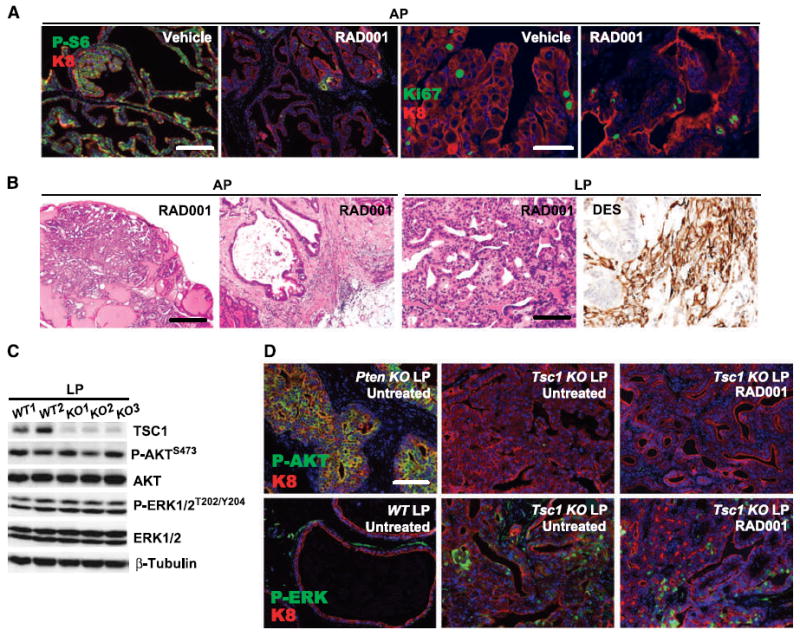
Prostate lesion persistence in RAD001-treated Tsc1 KO mice. A, marked reduction in P-S6 immunoreactivity in Tsc1 KO prostate AP glands treated with 4 wk RAD001, without significant effect on Ki67 index. B, mPIN and stromal hyperplastic persistence in RAD001-treated Tsc1 KO prostates. C, LPs of 15-mo-old WT (n = 2) and Tsc1 KO (n = 3) mice displayed similar level of AKT and ERK1/2 phosphorylation. D, the LP glands of a 4-mo-old PbCre+PTENfl/fl mouse exhibited drastically activated AKT (left). RAD001 treatment did not activate AKT (P-AKT, Tsc1 KO LP untreated versus RAD001) or ERK1/2 (P-ERK, Tsc1 KO LP untreated versus RAD001) in Tsc1 KO prostate mPIN lesions. A, bars, 200 μm (left two panels) and 100 μm (right two panels). B, bars, 200 μm (left and left middle panels) and 100 μm (right middle and right panels). D, bar, 100 μm.
Inhibition of mTORC1/S6K pathway may abrogate S6K-mediated negative feedback on AKT and ERK1/2 activation, which has been linked to tumor cell rapalogue resistance (see Discussion). However, phosphorylation of AKT and ERK1/2 was similar between 15-month-old WT and Tsc1 KO mice by immunoblotting (Fig. 5C), indicating that mTORC1/S6K-mediated negative feedback was not elicited in prostates of aged mice. As a positive AKT activation control, LPs from a 2-month-old PbCre+PTENfl/fl (Pten KO) mouse, as expected, exhibited marked phosphorylated AKT immunofluorescence (Fig. 5D, P-AKT, Pten KO LP). In contrast, both untreated and RAD001-treated Tsc1 KO LP tumor cells showed similarly low-background phosphorylated AKT signal (Fig. 5D, P-AKT, Tsc1 KO LP, RAD001 versus Untreated). In addition, sporadic ERK1/2 activation was detected in stroma inflammatory cells of aged WT LPs and in both epithelial and stromal cells in Tsc1 KO mPIN lesions (Fig. 5D, P-ERK, WT LP Untreated versus Tsc1 KO LP Untreated). Importantly, RAD001 treatment did not change the levels of ERK phosphorylation in Tsc1 KO prostate tumors (Fig. 5D, Tsc1 KO LP, RAD001 versus Untreated). Together, our data suggested that activation of either mTORC2 or ERK was not responsible for the RAD001 resistance of Tsc1 KO prostate tumors.
Loss of Nkx3.1 protein expression occurred in Tsc1 KO carcinogenesis and played a cooperative role in the initiation of mPIN
As the prostate-specific tumor suppressor, homeobox protein NKX3.1, is frequently downregulated in human and mouse PCas and loss of a single Nkx3.1 allele can cooperate with Pten loss of function in prostate carcinogenesis (28), we analyzed its protein expression in Tsc1 KO prostate carcinogenesis. As expected, WT prostate luminal cells showed abundant nuclear NKX3.1 immunoreactivity, whereas age-matched Nkx3.1 KO counterparts lacked detectable staining (Fig. 6A, WT and Nkx3.1 KO). NKX3.1 was present in morphologically normal Tsc1 KO luminal cells but undetectable in all mPINs and carcinomas (Tsc1 KO mPIN, Fig. 6A; PCa, data not shown). Thus, NKX3.1 loss was associated with the onset of mPIN, a precursor event in Tsc1 KO prostate carcinogenesis. Remarkably, NKX3.1 immunoreactivity remained undetectable in RAD001-treated lesions (Fig. 6A, Tsc1 KO LP, RAD001), showing that NKX3.1 loss in neoplastic cells was not regulated by RAD001-mediated mTORC1 inactivation. Thus, it is possible that loss of NKX3.1 may provide the mTORC1-independent growth signal to Tsc1 KO tumors treated with RAD001.
Figure 6.
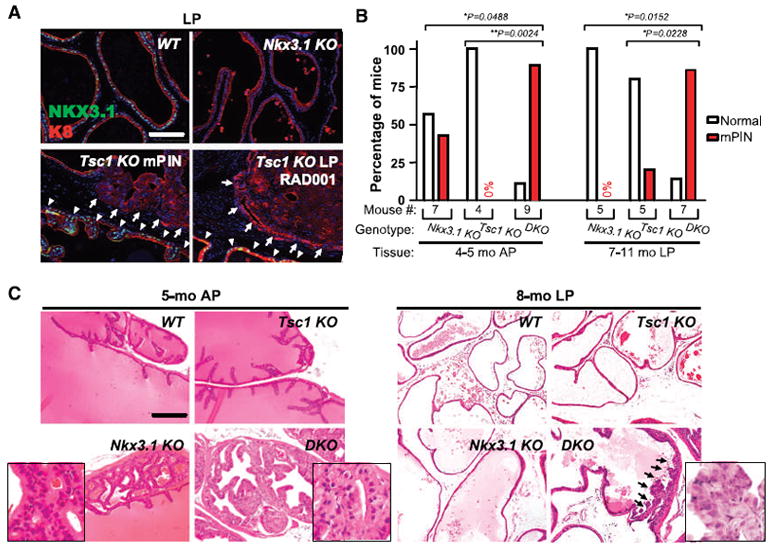
Loss of Nkx3.1 protein expression in Tsc1 KO mPIN with cooperative neoplasia induction in double knockout mice. A, WT prostate luminal cells showed uniform NKX3.1 nuclear expression, whereas age-matched Nkx3.1 KO counterparts lacked detectable staining. NKX3.1 was present in morphologically normal Tsc1 KO luminal cells (arrowheads) but undetectable in all mPINs and carcinomas (arrows). NKX3.1 remained undetectable in RAD001-treated lesions (RAD001). B, incidence of mPIN in APs of 4- to 5-mo-old Nkx3.1 KO, Tsc1 KO, and DKO mice and in LPs of 7- to 11-mo-old Nkx3.1 KO, Tsc1 KO, and DKO mice. C, histology of AP glands of 5-mo-old WT, Nkx3.1 KO, Tsc1 KO, and DKO mouse. Histology of LP glands of 8-mo-old WT, Nkx3.1 KO, Tsc1 KO, and DKO mouse. Insets are a higher (40×) magnification view of the images. Arrows, presence of markedly enlarged epithelial cells with nuclear atypia in the early phase of mPIN formation in the DKO mouse. Bars, 100 μm (A) and 200 μm (C).
To test a functional role for NKX3.1 in Tsc1 KO prostate carcinogenesis, disease incidence and severity were tested in mice homozygous for a germline Nkx3.1 deletion in the Tsc1 KO background (designated as DKO for double KO) compared with Nkx3.1 and Tsc1 single KO mice. A significantly higher proportion of 4- to 5-month-old DKO mice (eight of nine) developed mPIN in APs (Fig. 6B, 4–5 months, AP) than did either Nkx3.1 (three of seven) or Tsc1 single KO (zero of seven) mice. Unlike the low-grade mPINs exhibited by the Nkx3.1 KO mice (Fig. 6C, 5 months, AP, Nkx3.1 KO, inset), DKO mPIN cells displayed enlarged cytoplasm and nuclear atypia (Fig. 6C, 5 months, AP, DKO, inset). Furthermore, a significantly higher proportion (six of seven) of 7- to 8-month-old DKO mice developed LP mPIN lesions than age-matched Nkx3.1 KO (zero of five) and Tsc1KO (one of five) mice (Fig. 6B, 7–11 months, LP). DKO LP mPIN contained Tsc1 KO characteristic atypical cells (Fig. 6C, 8 months, LP, DKO, inset). As the DKO mice further aged, Type 1 and Type 2 cancers developed, albeit at similar frequencies compared with Tsc1 KO counterparts with no evidence of metastatic disease development (data not shown). Thus, combinatorial Nkx3.1 and Tsc1 loss-of-function accelerated prostatic neoplastic initiation but failed to affect malignant conversion.
Tsc1 KO lesions display differential cell type androgen dependency
The resistance of mPIN lesions during chronic RAD001 therapy and the persistent loss of NKX3.1 expression in de novo and RAD001-treated mice led us to explore androgen dependency of Tsc1 KO prostate neoplasias. A small group of three Tsc1 KO, one Tsc1:Nkx3.1 DKO, and one control mouse was castrated, and genitourinary tracts were analyzed by histopathology and immunofluorescence. Multiple mPIN lesions persisted in both the lateral and anterior prostates (Supplementary Fig. S5; Supplementary Table S1). These lesions also retained mTORC1 activation (Supplementary Fig. S5). Type 2 lesions, confined to the LP, underwent marked regression (Supplementary Fig. S5, Type 2 stroma regression). Even massive lesions evidenced extensive necrosis localized to in the stroma. High power views revealed marked inflammatory cell infiltration, stromal cell drop out, and fibrosis (Supplementary Fig. S5). Castrate desmin expression response was heterogeneous, sporadic in lesions with necrosis and stromal infiltration, and diffuse in a small persistent tumor that also displayed both epithelial and stromal mTORC1 hyperactivation. These data, along with both the progression kinetics wherein epithelial mPIN developed before stromal alterations and the mPIN persistence, suggest, but do not prove, that Tsc1 KO epithelial neoplasia was predominant and that stroma lesions were likely secondary to chronic epithelial activation.
Discussion
Here, we showed multistage prostate carcinogenesis in mice with prostate luminal cell Tsc1 deletion. As expected, Tsc1 deletion produced mTORC1 activation in luminal prostate epithelial cells of young male mice. However, prostate neoplasia development and microinvasive cancer required a prolonged latency. mPIN onset was associated with NKX3.1 loss of expression, and the functional importance of this secondary event was supported by disease acceleration in Nkx3.1:Tsc1 DKO mice. Interestingly, TSC1 loss-of-function produced two distinct histologic malignancies, one predominantly glandular and the other associated with pronounced stromal activation and hyperplasia. These data show that TSC1 loss-of-function produces a form of neoplastic progression and malignant conversion remarkably similar to the kinetics and molecular biology of human disease.
PI3K-mTORC1 pathway perturbations have been extensively investigated in prostate luminal epithelial cells through conditional PTEN (4, 29) or TSC1 (current study) loss of function and through targeted AKT (30) or RHEB (23) gain of function, offering the opportunity for a comparison of pathway level perturbation on PCa pathogenesis. Whereas Pten biallelic deletion caused invasive PCa, expression of constitutively activated myristoylated AKT (MPAKT) produced mPIN albeit with a more severe phenotype in the C57BL/6 versus FVB genetic background (31). Consistent with the notion that AKT activation alone did not possess all malignant activities of PTEN inactivation, PTEN loss activated c-Jun NH2 terminal kinase along with AKT in human PCa and the two pathways synergized in cell transformation (32).
Nonetheless, given the many downstream substrates of AKT, it is surprising that AKT activation had a more benign prostate phenotype than loss of TSC1, which represents only a single AKT target. This may reflect recruitment of additional TSC1/TSC2 functions in response to AKT activation. It is also surprising that RHEB overexpression, the canonical TSC1/TSC2 target, produced only preneoplastic epithelial hyperplasia in mice, despite constitutive mTORC1 activation (23). Whether the absence of malignant transformation in the RHEB model was due to insufficient transgene expression to fully activate mTORC1 or was indicative of potential RHEB-independent functions of TSC1/2 is uncertain.
The stochastic and delayed appearance of mPIN in prostatic Tsc1 KO mice suggests a requirement for spontaneous secondary genetic or epigenetic alterations for neoplastic induction. We showed a tight correlation between loss of NKX3.1 expression and disease progression in the TSC1 model and also showed by genetic means that loss of NKX3.1 enhanced prostate tumorigenesis consequent to TSC1 deletion. NKX3.1 is a prostate-specific homeobox gene located on human chromosome 8p21, a region undergoing monoallelic deletion in a subset of PIN and PCa (33). Additionally, NKX3.1 protein expression is progressively lost through epigenetic inactivation during progression of human PCa found in ~70% of human PCa metastatic cancers (34) and as well as in several mouse PCa models (35, 36). The critical role of NKX3.1 in normal prostate development and tumor suppression has been shown by Nkx3.1 deletion in mice resulting in defective prostate epithelial differentiation and mPIN formation (33). Furthermore, Nkx3.1 germline loss increased PCa incidence and promoted androgen independence and metastasis in Pten+/− mice, mainly through AKT and ERK1/2 activation initiated by PTEN inactivation and synergized by NKX3.1 loss (37). Absence of AKT or ERK1/2 activation could underlie the lack of frank local cancer induction or metastatic spread in Nkx3.1:Tsc1 DKO mice. Nonetheless, our data are consistent with the notion that PI3K pathway dysregulation through Pten loss downregulates Nkx3.1 (35) and NKX3.1 deficiency in turn promotes prostate tumorigenesis through multiple mechanisms, including AR transcriptional dysregulation, and loss of p53 function (35).
Another notable feature seen in Tsc1 KO mice was alteration in stromal cell terminal differentiation adjacent to mPIN and the marked subepithelial activation of proliferative, immature, stromal fibroblasts in Type 2 PCa. The reactive stroma in Type 2 lesions also has clinical relevance as PCa-elicited reactive stroma has been described in humans (38). Carcinoma-stromal interactions are thought to be derived from “dysregulated” tissue repair consisting of extracellular matrix accumulation, activation of myofibroblasts, and enhanced fibroblastic collagen synthesis. The critical role of PCa-associated stroma in tumor cell malignant transformation was clearly shown by a series of tissue recombination experiments wherein PCa-associated stromal cells produced malignant transformation of nontumorigenic prostate epithelial cells (ref. 38, and reference therein). Our data were consistent with the notion that the mPIN/cancer lesions generated two types of paracrine signals activating the stroma in two distinct ways. Thus, epithelial neoplasia produced either hyperplastic, immature stroma of Type 2 cancer or fibromuscular layer dedifferentiation without hyperplastic expansion in Type 1 cancers. Type 2 hyperplastic stroma could have been derived from epithelial cancer cells through EMT. Indeed, PCa-associated stromal abnormalities were described in retinoblastoma (pRb) knockout (39) and transgenic Fgfr1 gain of function PCa models (40). Atypical stromal cells were also produced following p53 inactivation in the pRb KO or through EMT in the Fgfr1 model. However, FGFR1 or p53 expression was unchanged in Tsc1 KO mice (data not shown), and we could not detect convincing molecular evidence for EMT via Snail induction in Tsc1 KO prostatic epithelial cells or in underlying reactive fibroblasts (data not shown). Further study will ultimately determine potential molecular mechanisms for the reactive stroma induction.
Additionally, both mPIN lesions and reactive stroma persisted in Tsc1 KO mice despite 4 weeks of RAD001 treatment. In contrast, MPAKT mPIN was efficiently reversed following 2 weeks of RAD001 (30). As such, Tsc1 KO lesions manifested alternative proliferation and survival signals. In preclinical trials using double heterozygous Pten:Nkx3.1 KO mice, rapamycin caused ERK1/2 activation through a signaling loop involving S6K-PI3K-ERK1/2 (41), with inhibition of both mTORC1 and ERK1/2 producing combinatorial prostate tumor growth inhibition (20). Likewise, AKT activation by rapamycin through S6K-PI3K-AKT signaling was also documented (42-44). However, Tsc1 KO prostate lesion persistence was surprisingly not due to AKT or ERK1/2 activation, thus revealing a further level of complexity in the PCa responses to rapamycin.
TSC is a relatively unique tumor suppressor gene syndrome, in that although many tumors in different sites are commonly seen in TSC patients, progression to classic pathologic features of malignancy is quite rare (lifetime risk, <5%; ref. 14). This is likely due in part to feedback pathways emanating from loss of the functional TSC1/TSC2 complex through activated mTORC1 that lead to suppression of PI3K and AKT activation (42-44). In TSC mouse models, loss of TSC1 or TSC2 leads to renal carcinoma through a cyst-adenoma-carcinoma progressive series (45-47), but this development is rare in TSC patients. This is the first epithelial tissue outside of the kidney in which TSC1 or TSC2 loss alone has been shown to progress to full carcinoma without other engineered genetic events. Our data suggest that loss of Nkx3.1 expression, as discussed above, seems to be the key step in this progression.
In conclusion, we show that the TSC1/TSC2 protein complex functions as a critical cell growth checkpoint in mouse prostate luminal epithelial cells, such that isolated loss of TSC1 leads to spontaneous PCa formation. This observation expands our concepts of PI3K pathway function in PCa development but generates new questions about the differential tumorigenic phenotypes produced by downstream pathway component dysregulation. The incomplete rapalogue sensitivity of mTORC1 (48), the parallel signaling of mTORC2 (reviewed in ref. 49), and the partial rapalogue efficacy in Tsc1 KO prostate neoplasia motivate further study of more potent mTOR catalytic site or alternative PI3K inhibitors in treating PCa with PI3K pathway activation (50).
Supplementary Material
Acknowledgments
We thank Rebecca Sohn for mouse husbandry, Novartis for the gift of RAD001, and Leonard B. Maggi, Jr., for the critical reading of the manuscript.
Grant Support
NIH grants R01 CA10101 and R01 CA120436, National Cancer Institute grant 1P01CA120964-01A1, and the Beatrice Roe fund for Urological Research.
Footnotes
Disclosure of Potential Conflicts of Interest
No potential conflicts of interest were disclosed.
Note: Supplementary data for this article are available at Cancer Research Online (http://cancerres.aacrjournals.org/).
References
- 1.McCall P, Witton CJ, Grimsley S, Nielsen KV, Edwards J. Is PTEN loss associated with clinical outcome measures in human prostate cancer? Br J Cancer. 2008;99:1296–301. doi: 10.1038/sj.bjc.6604680. [DOI] [PMC free article] [PubMed] [Google Scholar]
- 2.Sircar K, Yoshimoto M, Monzon FA, et al. PTEN genomic deletion is associated with p-Akt and AR signalling in poorer outcome, hormone refractory prostate cancer. J Pathol. 2009;218:505–13. doi: 10.1002/path.2559. [DOI] [PubMed] [Google Scholar]
- 3.Yoshimoto M, Cutz JC, Nuin PA, et al. Interphase FISH analysis of PTEN in histologic sections shows genomic deletions in 68% of primary prostate cancer and 23% of high-grade prostatic intraepithelial neoplasias. Cancer Genet Cytogenet. 2006;169:128–37. doi: 10.1016/j.cancergencyto.2006.04.003. [DOI] [PubMed] [Google Scholar]
- 4.Wang S, Gao J, Lei Q, et al. Prostate-specific deletion of the murine Pten tumor suppressor gene leads to metastatic prostate cancer. Cancer Cell. 2003;4:209–21. doi: 10.1016/s1535-6108(03)00215-0. [DOI] [PubMed] [Google Scholar]
- 5.Tee AR, Fingar DC, Manning BD, Kwiatkowski DJ, Cantley LC, Blenis J. Tuberous sclerosis complex-1 and -2 gene products function together to inhibit mammalian target of rapamycin (mTOR)-mediated downstream signaling. Proc Natl Acad Sci U S A. 2002;99:13571–6. doi: 10.1073/pnas.202476899. [DOI] [PMC free article] [PubMed] [Google Scholar]
- 6.Inoki K, Li Y, Zhu T, Wu J, Guan KL. TSC2 is phosphorylated and inhibited by Akt and suppresses mTOR signalling. Nat Cell Biol. 2002;4:648–57. doi: 10.1038/ncb839. [DOI] [PubMed] [Google Scholar]
- 7.Inoki K, Zhu T, Guan KL. TSC2 mediates cellular energy response to control cell growth and survival. Cell. 2003;115:577–90. doi: 10.1016/s0092-8674(03)00929-2. [DOI] [PubMed] [Google Scholar]
- 8.Manning BD, Tee AR, Logsdon MN, Blenis J, Cantley LC. Identification of the tuberous sclerosis complex-2 tumor suppressor gene product tuberin as a target of the phosphoinositide 3-kinase/akt pathway. Mol Cell. 2002;10:151–62. doi: 10.1016/s1097-2765(02)00568-3. [DOI] [PubMed] [Google Scholar]
- 9.Chong-Kopera H, Inoki K, Li Y, et al. TSC1 stabilizes TSC2 by inhibiting the interaction between TSC2 and the HERC1 ubiquitin ligase. J Biol Chem. 2006;281:8313–6. doi: 10.1074/jbc.C500451200. [DOI] [PubMed] [Google Scholar]
- 10.Tee AR, Manning BD, Roux PP, Cantley LC, Blenis J. Tuberous sclerosis complex gene products, Tuberin and Hamartin, control mTOR signaling by acting as a GTPase-activating protein complex toward Rheb. Curr Biol. 2003;13:1259–68. doi: 10.1016/s0960-9822(03)00506-2. [DOI] [PubMed] [Google Scholar]
- 11.Garami A, Zwartkruis FJ, Nobukuni T, et al. Insulin activation of Rheb, a mediator of mTOR/S6K/4E-BP signaling, is inhibited by TSC1 and 2. Mol Cell. 2003;11:1457–66. doi: 10.1016/s1097-2765(03)00220-x. [DOI] [PubMed] [Google Scholar]
- 12.Inoki K, Li Y, Xu T, Guan KL. Rheb GTPase is a direct target of TSC2 GAP activity and regulates mTOR signaling. Genes Dev. 2003;17:1829–34. doi: 10.1101/gad.1110003. [DOI] [PMC free article] [PubMed] [Google Scholar]
- 13.Laplante M, Sabatini DM. mTOR signaling at a glance. J Cell Sci. 2009;122:3589–94. doi: 10.1242/jcs.051011. [DOI] [PMC free article] [PubMed] [Google Scholar]
- 14.Kwiatkowski DJ. Animal models of lymphangioleiomyomatosis (LAM) and tuberous sclerosis complex (TSC) Lymphat Res Biol. 2010;8:51–7. doi: 10.1089/lrb.2009.0013. [DOI] [PMC free article] [PubMed] [Google Scholar]
- 15.Platt FM, Hurst CD, Taylor CF, Gregory WM, Harnden P, Knowles MA. Spectrum of phosphatidylinositol 3-kinase pathway gene alterations in bladder cancer. Clin Cancer Res. 2009;15:6008–17. doi: 10.1158/1078-0432.CCR-09-0898. [DOI] [PubMed] [Google Scholar]
- 16.Pymar LS, Platt FM, Askham JM, Morrison EE, Knowles MA. Bladder tumour-derived somatic TSC1 missense mutations cause loss of function via distinct mechanisms. Hum Mol Genet. 2008;17:2006–17. doi: 10.1093/hmg/ddn098. [DOI] [PMC free article] [PubMed] [Google Scholar]
- 17.Chakraborty S, Mohiyuddin SM, Gopinath KS, Kumar A. Involvement of TSC genes and differential expression of other members of the mTOR signaling pathway in oral squamous cell carcinoma. BMC Cancer. 2008;8:163. doi: 10.1186/1471-2407-8-163. [DOI] [PMC free article] [PubMed] [Google Scholar]
- 18.Hebert C, Norris K, Parashar P, Ord RA, Nikitakis NG, Sauk JJ. Hypoxia-inducible factor-1α polymorphisms and TSC1/2 mutations are complementary in head and neck cancers. Mol Cancer. 2006;5:3. doi: 10.1186/1476-4598-5-3. [DOI] [PMC free article] [PubMed] [Google Scholar]
- 19.Cho NY, Choi M, Kim BH, Cho YM, Moon KC, Kang GH. BRAF and KRAS mutations in prostatic adenocarcinoma. Int J Cancer. 2006;119:1858–62. doi: 10.1002/ijc.22071. [DOI] [PubMed] [Google Scholar]
- 20.Kinkade CW, Castillo-Martin M, Puzio-Kuter A, et al. Targeting AKT/mTOR, ERK MAPK. signaling inhibits hormone-refractory prostate cancer in a preclinical mouse model. J Clin Invest. 2008;118:3051–64. doi: 10.1172/JCI34764. [DOI] [PMC free article] [PubMed] [Google Scholar]
- 21.Pearson HB, McCarthy A, Collins CM, Ashworth A, Clarke AR. Lkb1 deficiency causes prostate neoplasia in the mouse. Cancer Res. 2008;68:2223–32. doi: 10.1158/0008-5472.CAN-07-5169. [DOI] [PubMed] [Google Scholar]
- 22.Ma L, Chen Z, Erdjument-Bromage H, Tempst P, Pandolfi PP. Phosphorylation and functional inactivation of TSC2 by Erk implications for tuberous sclerosis and cancer pathogenesis. Cell. 2005;121:179–93. doi: 10.1016/j.cell.2005.02.031. [DOI] [PubMed] [Google Scholar]
- 23.Nardella C, Chen Z, Salmena L, et al. Aberrant Rheb-mediated mTORC1 activation and Pten haploinsufficiency are cooperative oncogenic events. Genes Dev. 2008;22:2172–7. doi: 10.1101/gad.1699608. [DOI] [PMC free article] [PubMed] [Google Scholar]
- 24.Abdulkadir SA, Magee JA, Peters TJ, et al. Conditional loss of Nkx3.1 in adult mice induces prostatic intraepithelial neoplasia. Mol Cell Biol. 2002;22:1495–503. doi: 10.1128/mcb.22.5.1495-1503.2002. [DOI] [PMC free article] [PubMed] [Google Scholar]
- 25.Lu ZH, Wright JD, Belt B, Cardiff RD, Arbeit JM. Hypoxia-inducible factor-1 facilitates cervical cancer progression in human papilloma-virus type 16 transgenic mice. Am J Pathol. 2007;171:667–81. doi: 10.2353/ajpath.2007.061138. [DOI] [PMC free article] [PubMed] [Google Scholar]
- 26.Suwa T, Nyska A, Haseman JK, Mahler JF, Maronpot RR. Spontaneous lesions in control B6C3F1 mice and recommended sectioning of male accessory sex organs. Toxicol Pathol. 2002;30:228–34. doi: 10.1080/019262302753559560. [DOI] [PubMed] [Google Scholar]
- 27.Lu ZH, Shvartsman MB, Lee AY, et al. Mammalian target of rapamycin activator RHEB is frequently overexpressed in human carcinomas and is critical and sufficient for skin epithelial carcinogenesis. Cancer Res. 2010;70:3287–98. doi: 10.1158/0008-5472.CAN-09-3467. [DOI] [PMC free article] [PubMed] [Google Scholar]
- 28.Kim MJ, Cardiff RD, Desai N, et al. Cooperativity of Nkx3.1 and Pten loss of function in a mouse model of prostate carcinogenesis. Proc Natl Acad Sci U S A. 2002;99:2884–9. doi: 10.1073/pnas.042688999. [DOI] [PMC free article] [PubMed] [Google Scholar]
- 29.Ma X, Ziel-van der Made AC, Autar B. Targeted biallelic inactivation of Pten in the mouse prostate leads to prostate cancer accompanied by increased epithelial cell proliferation but not by reduced apoptosis. Cancer Res. 2005;65:5730–9. doi: 10.1158/0008-5472.CAN-04-4519. [DOI] [PubMed] [Google Scholar]
- 30.Majumder PK, Febbo PG, Bikoff R, et al. mTOR inhibition reverses Akt-dependent prostate intraepithelial neoplasia through regulation of apoptotic and HIF-1-dependent pathways. Nat Med. 2004;10:594–601. doi: 10.1038/nm1052. [DOI] [PubMed] [Google Scholar]
- 31.Xu Q, Majumder PK, Ross K, et al. Identification of prostate cancer modifier pathways using parental strain expression mapping. Proc Natl Acad Sci U S A. 2007;104:17771–6. doi: 10.1073/pnas.0708476104. [DOI] [PMC free article] [PubMed] [Google Scholar]
- 32.Vivanco I, Palaskas N, Tran C, et al. Identification of the JNK signaling pathway as a functional target of the tumor suppressor PTEN. Cancer Cell. 2007;11:555–69. doi: 10.1016/j.ccr.2007.04.021. [DOI] [PubMed] [Google Scholar]
- 33.Kim MJ, Bhatia-Gaur R, Banach-Petrosky WA, et al. Nkx3.1 mutant mice recapitulate early stages of prostate carcinogenesis. Cancer Res. 2002;62:2999–3004. [PubMed] [Google Scholar]
- 34.Bethel CR, Faith D, Li X, et al. Decreased NKX3.1 protein expression in focal prostatic atrophy, prostatic intraepithelial neoplasia, and adenocarcinoma: association with gleason score and chromosome 8p deletion. Cancer Res. 2006;66:10683–90. doi: 10.1158/0008-5472.CAN-06-0963. [DOI] [PubMed] [Google Scholar]
- 35.Lei Q, Jiao J, Xin L, et al. NKX3.1 stabilizes p53, inhibits AKT activation, and blocks prostate cancer initiation caused by PTEN loss. Cancer Cell. 2006;9:367–78. doi: 10.1016/j.ccr.2006.03.031. [DOI] [PubMed] [Google Scholar]
- 36.Bethel CR, Bieberich CJ. Loss of Nkx3.1 expression in the transgenic adenocarcinoma of mouse prostate model. Prostate. 2007;67:1740–50. doi: 10.1002/pros.20579. [DOI] [PubMed] [Google Scholar]
- 37.Gao H, Ouyang X, Banach-Petrosky WA, Gerald WL, Shen MM, Abate-Shen C. Combinatorial activities of Akt and B-Raf/Erk signaling in a mouse model of androgen-independent prostate cancer. Proc Natl Acad Sci U S A. 2006;103:14477–82. doi: 10.1073/pnas.0606836103. [DOI] [PMC free article] [PubMed] [Google Scholar]
- 38.Franco OE, Shaw AK, Strand DW, Hayward SW. Cancer associated fibroblasts in cancer pathogenesis. Semin Cell Dev Biol. 2010;21:33–9. doi: 10.1016/j.semcdb.2009.10.010. [DOI] [PMC free article] [PubMed] [Google Scholar]
- 39.Hill R, Song Y, Cardiff RD, Van Dyke T. Selective evolution of stromal mesenchyme with p53 loss in response to epithelial tumorigenesis. Cell. 2005;123:1001–11. doi: 10.1016/j.cell.2005.09.030. [DOI] [PubMed] [Google Scholar]
- 40.Acevedo VD, Gangula RD, Freeman KW, et al. Inducible FGFR-1 activation leads to irreversible prostate adenocarcinoma and an epithelial-to-mesenchymal transition. Cancer Cell. 2007;12:559–71. doi: 10.1016/j.ccr.2007.11.004. [DOI] [PubMed] [Google Scholar]
- 41.Carracedo A, Ma L, Teruya-Feldstein J, et al. Inhibition of mTORC1 leads to MAPK pathway activation through a PI3K-dependent feedback loop in human cancer. J Clin Invest. 2008;118:3065–74. doi: 10.1172/JCI34739. [DOI] [PMC free article] [PubMed] [Google Scholar]
- 42.Ma L, Teruya-Feldstein J, Behrendt N, et al. Genetic analysis of Pten and Tsc2 functional interactions in the mouse reveals asymmetrical haploinsufficiency in tumor suppression. Genes Dev. 2005;19:1779–86. doi: 10.1101/gad.1314405. [DOI] [PMC free article] [PubMed] [Google Scholar]
- 43.Zhang H, Cicchetti G, Onda H, et al. Loss of Tsc1/Tsc2 activates mTOR and disrupts PI3K-Akt signaling through downregulation of PDGFR. J Clin Invest. 2003;112:1223–33. doi: 10.1172/JCI17222. [DOI] [PMC free article] [PubMed] [Google Scholar]
- 44.Manning BD, Logsdon MN, Lipovsky AI, Abbott D, Kwiatkowski DJ, Cantley LC. Feedback inhibition of Akt signaling limits the growth of tumors lacking Tsc2. Genes Dev. 2005;19:1773–8. doi: 10.1101/gad.1314605. [DOI] [PMC free article] [PubMed] [Google Scholar]
- 45.Everitt JI, Goldsworthy TL, Wolf DC, Walker CL. Hereditary renal cell carcinoma in the Eker rat: a rodent familial cancer syndrome. J Urol. 1992;148:1932–6. doi: 10.1016/s0022-5347(17)37087-8. [DOI] [PubMed] [Google Scholar]
- 46.Onda H, Lueck A, Marks PW, Warren HB, Kwiatkowski DJ. Tsc2 (+/-) mice develop tumors in multiple sites that express gelsolin and are influenced by genetic background. J Clin Invest. 1999;104:687–95. doi: 10.1172/JCI7319. [DOI] [PMC free article] [PubMed] [Google Scholar]
- 47.Kobayashi T, Minowa O, Kuno J, Mitani H, Hino O, Noda T. Renal carcinogenesis, hepatic hemangiomatosis, and embryonic lethality caused by a germ-line Tsc2 mutation in mice. Cancer Res. 1999;59:1206–11. [PubMed] [Google Scholar]
- 48.Choo AY, Yoon SO, Kim SG, Roux PP, Blenis J. Rapamycin differentially inhibits S6Ks and 4E-BP1 to mediate cell-type-specific repression of mRNA translation. Proc Natl Acad Sci U S A. 2008;105:17414–9. doi: 10.1073/pnas.0809136105. [DOI] [PMC free article] [PubMed] [Google Scholar]
- 49.Guertin DA, Sabatini DM. The pharmacology of mTOR inhibition. Sci Signal. 2009;2:e24. doi: 10.1126/scisignal.267pe24. [DOI] [PubMed] [Google Scholar]
- 50.Workman P, Clarke PA, Raynaud FI, van Montfort RL. Drugging the PI3 kinome: from chemical tools to drugs in the clinic. Cancer Res. 2010;70:2146–57. doi: 10.1158/0008-5472.CAN-09-4355. [DOI] [PMC free article] [PubMed] [Google Scholar]
Associated Data
This section collects any data citations, data availability statements, or supplementary materials included in this article.