Abstract
A new methodology for estimating the spatial distribution of elastic moduli using the steady-state dynamic response of solids immersed in fluids is presented. The technique relies on the ensuing acoustic pressure field from a remotely excited solid to inversely estimate the spatial distribution of Young’s modulus. This work proposes the use of Gaussian radial basis functions (GRBF) to represent the spatial variation of elastic moduli. GRBF are shown to possess the advantage of representing smooth functions with quasi-compact support, and can efficiently represent elastic moduli distributions such as those that occur in soft biological tissue in the presence of tumors. The direct problem consists of a coupled acoustic-structure interaction boundary value problem solved in the frequency domain using the finite element method. The inverse problem is cast as an optimization problem in which the objective function is defined as a measure of discrepancy between an experimentally measured response and a finite element representation of the system. Non-gradient based optimization algorithms in combination with a divide and conquer strategy are used to solve the resulting optimization problem. The feasibility of the proposed approach is demonstrated through a series of numerical and a physical experiment. For comparison purposes, the surface velocity response was also used for the inverse characterization as the measured response in place of the acoustic pressure.
Keywords: Elastic Imaging, Radial Basis Functions, Vibroacoustography, Inverse Problem, Ultrasound, Tissue Characterization
1. Introduction
Noninvasive techniques to characterize material properties are of interest in many science and engineering fields [1–5]. These techniques are of great significance in the medical field since material properties provide valuable insight about the onset and progression of certain diseases. For instance, the fact that the elastic modulus of human tissue can be used as a metric to differentiate between malignant tissue and healthy tissue has led researchers in recent years to develop techniques to quantitatively reconstruct the spatial distribution of mechanical properties in soft tissue [6–17].
Different methodologies have been employed to image the distribution of elastic moduli in soft tissue [14, 18, 19]. The basic premise in determining the mechanical properties of soft tissues is that current medical imaging techniques such as ultrasound and magnetic resonance imaging can provide information about complex deformation processes in human tissue that, along with information about boundary conditions, can be used to image the distribution of elastic moduli.
Vibroacoustography (VA) is a medical imaging technique that has shown significant promise for noninvasive and nondestructive characterization of tissue mechanical properties [20, 21]. In VA, the radiation force of ultrasound (US) (a nonlinear, second-order phenomenon in wave theory) is used to produce a localized oscillatory force to vibrate tissue at low (kHz) frequencies at the focal point of the US beam. The resulting mechanical vibrations produce an acoustic field emanating from the structure that is detected at a surrounding accessible point by a sensitive microphone (or hydrophone). Changes in tissue properties normally produce significant variations in the acoustic field. Thus, this method can provide detailed information on tissue mechanics at high resolution that is not available from conventional methods.
Brigham et al. [22] showed that the radiation force of ultrasound and the ensuing acoustic emissions can be used to characterize the viscoelastic properties of solids. However, in [22], it was assumed that the boundaries of different material regions were known a priori. The present work extends the work in [22] by applying the vibroacoustic testing method to estimate spatially-varying elastic properties.
The inverse estimation of spatially-varying mechanical properties is cast as an optimization problem in which an error functional that measures the misfit between experimental and approximated responses is minimized by searching over a space of admissible functions that describe the distribution of the elastic modulus. Multiple techniques have been proposed in the literature for solving inverse problems in which the unknown is a function. For instance, the adjoint method was used by Oberai et al. [6] for solving elasticity imaging problems. This method has the advantage that only two evaluations of the forward problem are required in each iteration of the minimization process. The disadvantage of the adjoint method is that it is a gradient-based method, and only local minima are guaranteed to be found. An alternate approach is to approximate the unknown function using a finite dimensional basis and search for the unknown coefficients using non-gradient based optimization methods [22, 23]. The advantage of this approach is that global minima can then be found irrespective of initial guesses, but with the disadvantage that, depending on the basis that is selected, a large number of parameters may be needed, increasing the computational cost significantly. Despite this, non-gradient based optimization methods are favored in this work for their robustness and lack of sensitivity to initial guesses. To improve the computational efficiency of the inverse solution strategy, a divide and conquer methodology (DCM) was applied during the optimization procedure. The DCM consists of performing the characterization in a series of optimization stages, where at the end of each stage, the optimization search domain is incrementally reduced based on the current best solution estimates.
Since a finite dimensional representation will be used to approximate spatially varying elastic moduli and the computation expense of the inverse problem increases with the dimension of the basis, it is very important that an adequate basis be selected. The quality of a basis for the problem at hand can be judged based on the dimensionality of the subspace needed to “satisfactorily” approximate the desired elastic modulus distribution. Intuitively speaking, a basis should intrinsically carry the nature of the possible solutions. One of the main applications of the present work is the detection and characterization of tumors in breast tissue. Tumors are expected to be stiff, localized regions embedded in a relatively homogeneous matrix. It is proposed in this work that this type of property distribution can be efficiently represented with Gaussian radial basis functions (GRBF). It is important to point out that the notion of representing tissue stiffness distribution by using quasi-compactly supported functions has also been suggested by Skovoroda et al. [17]. However, in their work GRBF were not used as a finite dimensional basis for inverse elasticity imaging as proposed herein.
The methodology presented in this work employs vibroacoustic techniques in combination with GRBF and non-gradient based optimization algorithms to inversely characterize the elastic modulus field of solids immersed in fluids. In section 2, the finite element formulation for the coupled fluid-structure problem is presented. In section 3, the inverse problem formulation is described, as well as the optimization solution strategy. In section 4, the results obtained for the series of numerically simulated experiments and a physical experiment are shown. Conclusions and future directions are given at the end.
2. Forward Problem
The vibroacoustic system considered here can be described by a coupled system of partial differential equations derived from the conservation of linear momentum. The surrounding fluid was taken to be a semi-infinite medium, and the only excitation in the fluid was assumed to be due to the motion of the solid. The boundary value problem describing the forward problem is given in Box 1. The equations describing the boundary-value problems used in this work are well known. The reader can consult Reference [22] for further details. Each dot on top of a variable denotes a time derivative, vectors will be denoted with an over-arrow on top or within curly brackets, tensors will be represented with bold letters, and matrices will be enclosed within square brackets.
Box 1. Forward problem.
Solid formulation
| (1) |
| (2) |
| (3) |
| (4) |
| (5) |
Fluid formulation
| (6) |
| (7) |
| (8) |
| (9) |
In the above solid formulation, t denotes time, x⃗ is the position vector, ρ is the mass density (assumed constant in this work), CIV(x⃗) is the 4th order elasticity tensor, σ(x⃗,t) is the stress tensor, b⃗(x⃗,t) is a body force, ε(x⃗,t) is the Cauchy infinitesimal strain tensor, u⃗(x⃗,t) is the displacement vector, is the acceleration vector, T⃗(x⃗,t) is the traction vector, n⃗(x⃗) is the unit outward normal vector to the solid surface, Ω is the solid domain, ΓT is the part of the boundary where the tractions are specified (i.e. Neumann boundary conditions), Γfs is the fluid-structure interface, and Γu is the part of the boundary surface where the displacements are specified (i.e. Dirichlet boundary conditions).
For the acoustic fluid formulation, ρ f is the fluid mass density, Bf is the bulk modulus of the fluid, f and β are geometry-specific parameters for improved non-reflecting radiation condition, p(x⃑,t) is the scalar acoustic fluid pressure in excess of hydrostatic pressure, u⃑f (x⃑,t) is the fluid particle displacement vector, is the acceleration of the fluid boundary in the direction of the normal, n⃑f (x⃑) is the unit normal vector to the fluid surface, Φ is the fluid domain, and ΨR is the portion of the boundary where the radiation condition is specified (i.e. Robin boundary conditions).
The finite element formulation of the initial-boundary value problem is given in Box 2. In Box 2U(Ω) is a subspace of the Sobolev space H1(Ω) and whose functions satisfy homogeneous Dirichlet boundary conditions on Γu, V(Ω) is the Sobolev space of functions that satisfy homogeneous essential boundary conditions where pressure is specified, [Ms] is the solid mass matrix, [Cs] is the solid damping matrix, [Ks] is the solid stiffness matrix, { } is the solid external force vector, [Cs] is the solid damping matrix, α and μ are damping factors (Rayleigh Damping), [D(x⃗)] is the stiffness matrix representation of the elasticity tensor CIV(x⃗), [Mf] is the fluid mass matrix, [Cf] is the fluid damping matrix, [Kf] is the fluid stiffness matrix, [S] is the interaction matrix, Γsf is the interaction boundary between the structure and the fluid, [N(x⃗)] is the matrix of interpolation functions for the solid elements, [H(x⃗)] is the matrix of interpolation functions for the acoustic elements, [B(x⃗)] is the matrix of spatial derivatives of the solid interpolation functions, and [F(x⃗)] is the matrix of derivatives of the interpolation functions. For more details on the derivations of the Equations presented in Box 2 see Reference [22]. For the sake of simplicity in this proof of concept, Rayleigh damping was used in the numerical and physical experiments.
Box 2. Finite element formulation of forward problem.
Variational formulation for the solid
| (10) |
Variational formulation for the fluid
| (11) |
Semidiscretized formulation for the coupled system Solid
| (12) |
| (13) |
| (14) |
| (15) |
| (16) |
Fluid
| (17) |
| (18) |
| (19) |
| (20) |
| (21) |
The structure and the fluid are coupled through their corresponding external force vectors. The load applied to the structure by the fluid pressure translates into an external traction force acting on the structure surface in the direction of the fluid normal. The solid acceleration normal to the interface translates into a pressure gradient on the fluid. The structural displacements, fluid pressure, and external forces are assumed to vary harmonically and the resulting coupled system of equations in the frequency domain is shown in Box 3 [22].
Box 3. Finite element couple system of equations.
| (22) |
| (23) |
| (24) |
| (25) |
In the above formulation ω represents frequency, ℜ denotes real components, and ℑ denotes imaginary component.
3. Inverse Problem
3.1 Elasticity Representation
Tumors are presumed to be localized stiff regions embedded in a soft matrix. In addition, it was assumed that any tumor present at a region of interest will cause relatively gradual changes in elastic properties. For this reason, Gaussian radial basis functions (GRBF) were used, since the GRBF possess parameters that can properly represent these properties [24].
The spatial distribution of elastic modulus is defined as a weighted sum of N radially symmetric basis functions augmented by a constant term, given by
| (26) |
where Eo is the matrix Young’s modulus, λi are real-valued coefficients, x⃗i are the GRBF centers, and ϕ is the GRBF, which is defined as
| (27) |
where ||…||2 is the ℓ2-norm and c are the locality parameters that control the size of the GRBF region of influence.
In order to compute the λi parameters, the interpolation scheme shown in References [25] and [26] was used. The values of the Young’s modulus at the centers of the GRBFs are denoted as Ê(x⃗i). These values were taken as the main unknown variables in the inverse problem and were computed using the λi parameters by requiring that the following interpolation condition was satisfied
| (28) |
This approach attaches a physical meaning to the solution of the inverse problem as opposed to the non-physical parameters λi. In addition, setting constraints on Ê(x⃗i) (e.g. strictly positive) is easier than setting constraints on λi (e.g. could be negative or positive).
3.2 Inverse Problem Formulation
An optimization approach was used to inversely characterize the spatial distribution of elastic modulus through the acoustic emissions induced by the radiation force of ultrasound. First, an error functional was defined to measure the difference between the experimental and approximated responses and it is given by
| (29) |
The quantities r⃗Exp and r⃗FEA represent the experimental and approximated responses, respectively. After parameterization, the error functional can be expressed as
| (30) |
where {ζ} = {x⃗1, …, x⃗m} is the set of coordinates of the GRBF centers, {Ê} = {Ê1, …, Êm} is the set of Young’s modulus at the center of the GRBF, and {c} = {c1, …, cm} is the set of locality parameters.
The inverse problem is then cast as an optimization problem in which the error functional defined in Eq. (30) is minimized by searching over a space of admissible vectors that describe the spatial distribution of elastic modulus. Therefore, the minimization problem is described as
| (31) |
3.3 Optimization Algorithms
It is widely known that gradient-based algorithms guarantee convergence only to local minima in non-convex problems. For problems where data sparsity is significant, non-gradient based methods are preferred over gradient-based methods since data sparsity can create non-convex error surfaces. Through numerical experiments it was determined that the error surfaces encountered in the problems addressed herein are non-convex. Therefore, global optimization methods were used for the inverse problems presented in this paper. Since the main focus of the work is not on optimization, the global search algorithms used herein are briefly described below.
Two global optimization methods were employed to solve the inverse problem studied in this work: a real value genetic algorithm (GA) [27, 28] and the Surrogate-Model Accelerated Random Search (SMARS) algorithm proposed in [29]. The GA was used for the less computationally demanding numerical experiments, while SMARS was used for the more computationally demanding physical experiment. Three common operators were used for the GA: stochastic uniform sampling as the selection operator; single point crossover as the reproduction operator, and a uniform distribution for mutation.
The SMARS algorithm is a combination between a random search algorithm [30] and a surrogate-model optimization approach [31]. The random search part of SMARS is used to efficiently search vast and complex error surfaces. It has been shown that the random search algorithm is guaranteed to converge to a global solution in a probabilistic sense [32]. However, the number of iterations needed for finding a global solution is high. Therefore, SMARS uses a surrogate-model approach where an artificial neural network is used to map local regions of the search space, producing a computationally inexpensive estimate of the solution. By using the surrogate-model, SMARS reduces the number of objective function evaluations needed to find an optimal solution.
3.4 Divide and Conquer Methodology
Computational time can represent a problem when non-gradient-based optimization methods are used. In order to address this problem, a divide and conquer methodology (DCM) was used to iteratively reduce the search space of the GRBF centers during the optimization process.
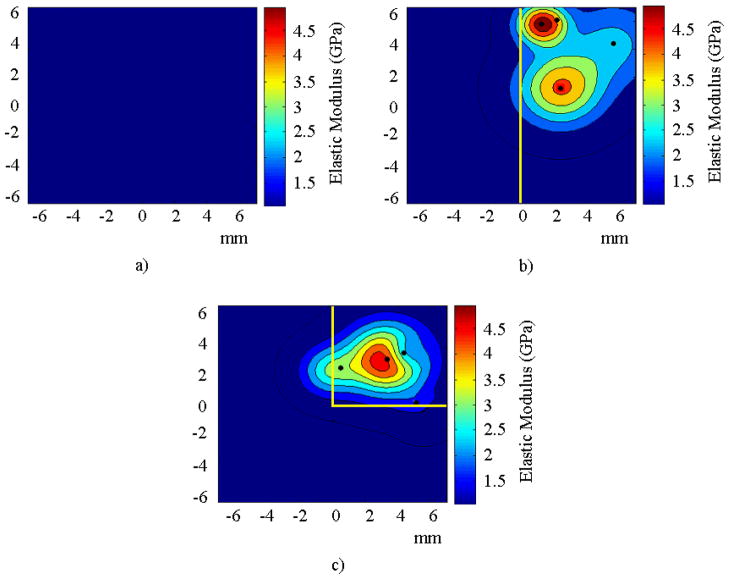
Figure 1 shows a schematic representation of the DCM. First, an optimization run is performed, where the complete solid domain is used as the search space for the GRBF centers, as shown in Figure 1a. Only a few iterations of the search algorithm are allowed in this first run. Next, a subspace of the spatial domain of the GRBF centers is chosen using the solution from the first optimization run to identify a smaller domain which is likely to contain the solution. The search for the GRBF centers is then confined to this subspace in the next optimization run, as shown in Figure 1b. The process is continued until the error functional is decreased below a certain tolerance or a maximum number of iterations is reached, as shown in Figure 1c.
FIGURE 1.
Schematic of the DCM for a) the first, b) second, and c) third optimization run.
4. Results and Discussion
Two numerical experiments were performed to test the potential of the proposed technique to inversely characterize the spatial distribution of elastic moduli in general solid domains. To validate the methodology in a realistic setting, a physical experiment was also performed. For both, numerical and physical experiments, the solid body was excited at one or more locations and the acoustic and velocity responses were measured at several points. Then, these measured responses were used to inversely reconstruct the spatial variation of Young’s modulus in the solid.
4.1 Numerical Experiments
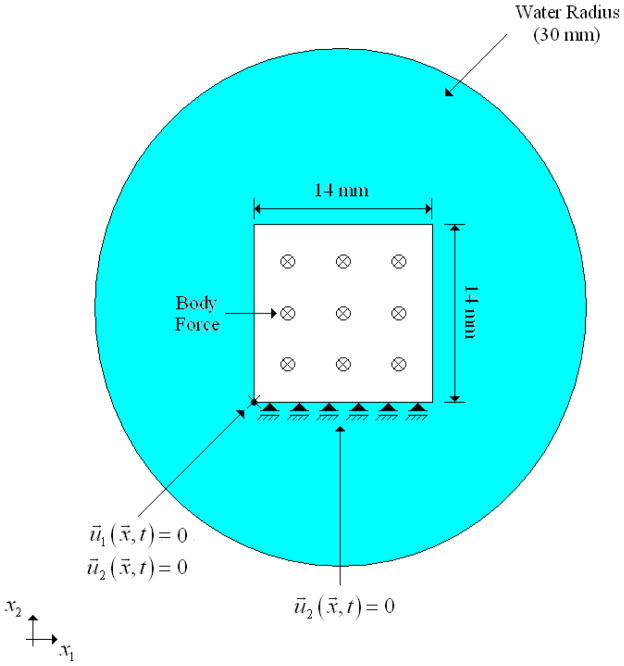
A plain strain condition was used in the simulated experiments in order to reduce computational demand. Figure 2 shows a schematic of the numerical experiments. The solid domain had dimensions of 14 mm × 14 mm. Displacements in the vertical direction were constrained at the bottom edge of the solid and the displacements at the lower left corner were fixed. For this work, the density and the Poisson’s ratio of the solid were assumed to be 1050 kg/m3 and 0.48, respectively. The mass proportional damping parameter, α, was set to 5000 and the stiffness proportional damping parameter, μ, was set to 0. The solid was immersed in a circular fluid domain with radius, rf, of 30 mm. To avoid reflection effects, the Sommerfeld radiation boundary condition was specified in the outer fluid boundary. The Sommerfeld radiation boundary condition parameters f and β were set to 1 and 1/2rf, respectively. The properties of the fluid were assumed to be known for the inverse problem, with density of 1000 kg/m3 and bulk modulus of 2.2 GPa.
Figure 2.
Schematic of the finite element model used for the numerical experiments.
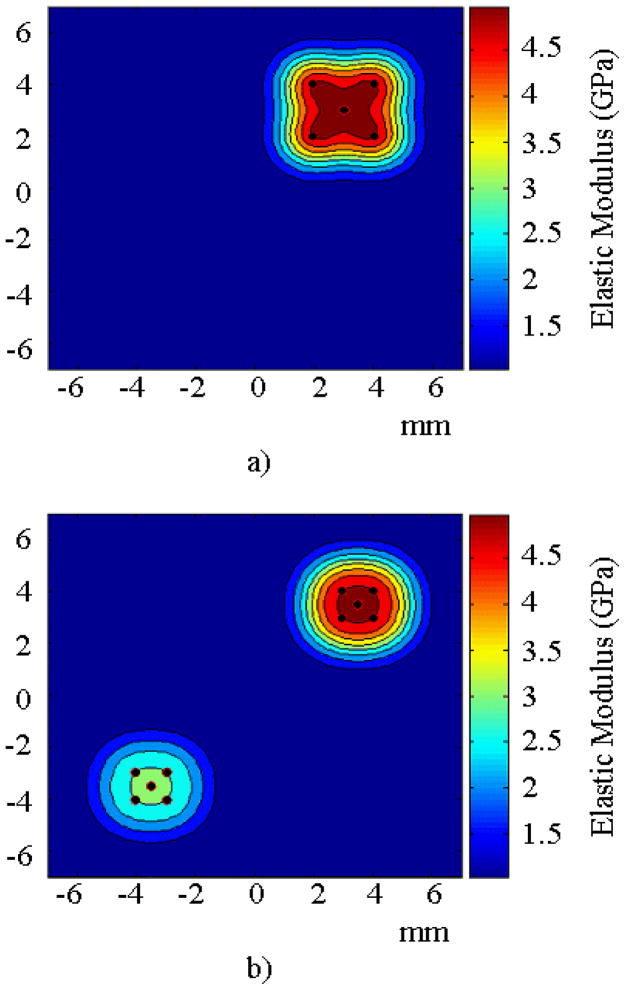
The first numerical experiment consisted of a single stiff inclusion embedded in a soft matrix. The inclusion was represented with a combination of five GRBFs. The Young’s modulus at the GRBF centers was 4 GPa. The second numerical experiment consisted of two inclusions, and each inclusion was represented with a combination of five GRBFs. The Young’s modulus at the GRBF centers for the two inclusions was 4 GPa and 2 GPa. The matrix Young’s modulus was taken as 1 GPa for both experiments. Figure 3a and 3b shows the target spatial distribution of the elastic modulus for each case. The values of Young’s modulus were selected so that the wave number in the governing equations remained low and, therefore, the computational cost for performing one finite element analysis was kept low.
FIGURE 3.
Schematic of the spatial distribution of elastic modulus for the numerical experiments with a) one Inclusion and b) two Inclusions.
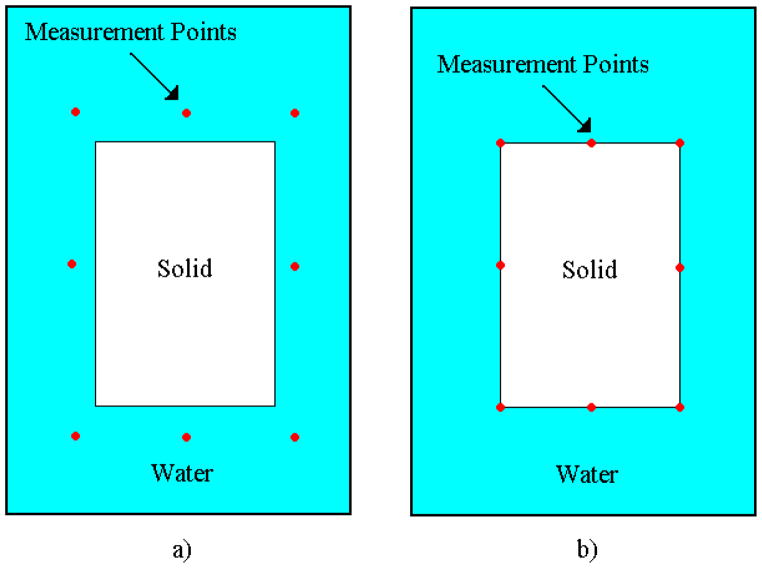
The range of frequencies considered for these experiments was 40 kHz to 50 kHz, which resembles frequencies used in Vibro-acoustography [33]. Nine body forces were applied simultaneously in the x2-direction at equally spaced points as shown in Figure 2. Two response quantities (i.e. acoustic pressure and surface velocity), measured at eight different points, were used separately to solve the inverse problem. For the acoustic pressure response eight frequencies were selected, and for the surface velocity response fourteen frequencies were selected. Figure 4a and 4b gives a schematic of the measurement points selected for each response.
FIGURE 4.
Measurement points selected to solve the inverse problem for a) the acoustic pressure response and b) the surface velocity response.
In all cases, four radial basis functions were used for the estimation. Therefore, the parameters to be identified were four pairs of coordinates for the GRBF centers, the matrix elastic modulus, four locality parameters, and the four values of the Young’s modulus at the centers of the GRBFs for a total of 17 unknowns for the inverse problem. Table 1 shows the minimum and maximum parameter values (i.e. search range) considered for the two simulated inverse problems.
TABLE 1.
Search ranges for the optimization parameters of the numerical experiments.
| Optimization Parameter | Optimization Minimum | Optimization Maximum |
|---|---|---|
| Eo | 0.8 GPa | 2.0 GPa |
| Einc | 0.5 GPa | 5.0 GPa |
| c | 1.0 mm | 3.0 mm |
| x | −7.0 mm | 7.0 mm |
| y | −7.0 mm | 7.0 mm |
Random Gaussian noise was added to both responses to explore the tolerance of the proposed methodology to imperfect data. The random Gaussian noise was added as
| (32) |
where is the response (i.e. velocity or pressure) at the ith point with noise, is the corresponding quantity without noise, and η is a normally distributed variable with unit mean and zero variance.
To verify the Divide and Conquer Method (DCM), the numerical experiments were performed also without the DCM for a fixed number of function evaluations. Due to the stochastic nature of the algorithms used in this work, five optimization runs were performed for each example, while keeping the algorithm parameters constant. The mean and standard deviation of the results were calculated and are discussed in the next section.
4.2 Numerical experiment with one inclusion
4.2.1 Results for the acoustic pressure response
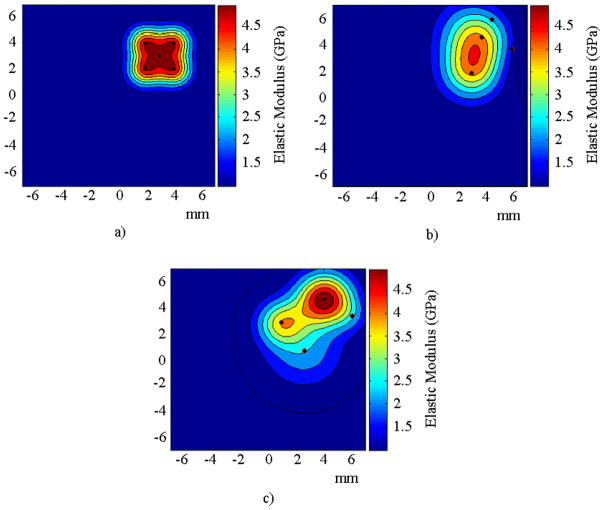
For the case where acoustic response was used for the identification, the region in which the inclusion was located was identified in all optimization runs performed with the DCM without identifying spurious inclusions. Contrary to the results obtained with the DCM, the region in which the inclusion was located was identified in four of the five optimization runs performed without the DCM; therefore, more function evaluations were needed to decrease the error. In the unsuccessful run, two spurious inclusions were found in addition to the target inclusion. Figures 5b and 5c show examples of the spatial distribution of the elastic modulus found as solutions to the inverse problem for both cases. The parameters obtained as the solution to the inverse problem were used in forward finite element runs and the resulting frequency spectra of the acoustic pressure were compared to those of the simulated experiment.
FIGURE 5.
Spatial distribution of elastic modulus for the numerical experiment with one inclusion for a) the target solution, b) the solution to the inverse problem using the acoustic pressure response with the DCM, and c) without the DCM.
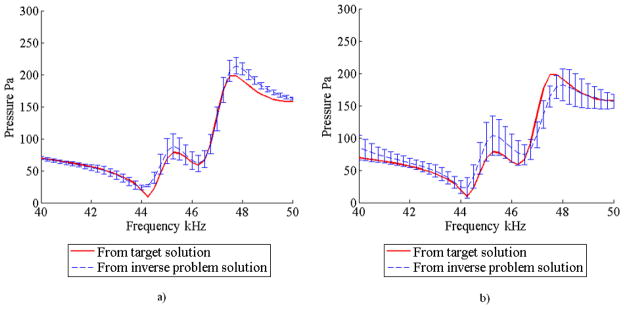
Figures 6a and 6b show the mean and standard deviation of the acoustic pressure response obtained for both case with the DCM and the case without the DCM, respectively. These spectra correspond to one of the eight measurement points in the fluid. It can be noticed from these figures that the DCM method produced more accurate results and with less scatter. The mean and standard deviation of the Young’s modulus of the matrix are tabulated in Table 2. These results show an accurate estimation of the matrix Young’s modulus regardless of whether or not the DCM was used; however, the results obtained using the DCM show less scatter.
FIGURE 6.
Mean and standard deviation of the acoustic pressure response obtained from 5 optimization trials for the numerical experiment with one inclusion a) using the DCM and b) without using the DCM.
TABLE 2.
Mean and standard deviation of the matrix Young’s modulus for the numerical experiment with one inclusion using the acoustic pressure response.
| Case | Target Eo (Pa) | Mean Eo (Pa) | Standard Deviation |
|---|---|---|---|
| With DCM | 1.00×10⁹ | 1.03×10⁹ | 1.01×10⁷ |
| Without DCM | 1.00×10⁹ | 9.81×10⁸ | 7.35×10⁷ |
4.2.2 Results for the surface velocity response
When surface velocity was used as the measured response in the inverse problem, the region in which the inclusion was located was identified in all the optimization runs performed with the DCM without identifying spurious inclusions. For the numerical experiment where the DCM was not implemented, the region in which the inclusion was located was identified in all the optimization runs, but in two of these five runs a spurious inclusion appeared in the results. Figures 7b and 7c show the distribution of the elastic modulus for the cases with and without the DCM, respectively.
FIGURE 7.
Spatial distribution of elastic modulus for the numerical experiment with one inclusion for a) the target solution, b) the solution to the inverse problem using the surface velocity response with the DCM, and c) without the DCM.
Figures 8a and 8b show the velocity frequency spectra corresponding to one of the eight measurement points for forward finite element runs using the inverse problem solutions. The figures show that in this case the DCM also produced more accurate results and with less scatter for a fixed number of function evaluations. The mean and standard deviation of the matrix Young’s modulus are presented in Table 3. The results show trends similar to those found for the case when the acoustic response was used. The elastic modulus of the matrix was estimated accurately for all cases, but the DCM produced less scatter.
FIGURE 8.
Mean and standard deviation of the surface velocity response obtained from 5 optimization trials for the numerical experiment with one inclusion a) using the DCM and b) without using the DCM.
TABLE 3.
Mean and standard deviation of the matrix Young’s modulus for the numerical experiment with one inclusion using the surface velocity response.
| Case | Target Eo (Pa) | Mean Eo (Pa) | Standard Deviation |
|---|---|---|---|
| With DCM | 1.00×10⁹ | 9.66×10⁸ | 7.22×10⁷ |
| Without DCM | 1.00×10⁹ | 9.82×10⁸ | 8.94×10⁷ |
4.3 Numerical experiment with two inclusion
4.3.1 Results for the acoustic pressure response
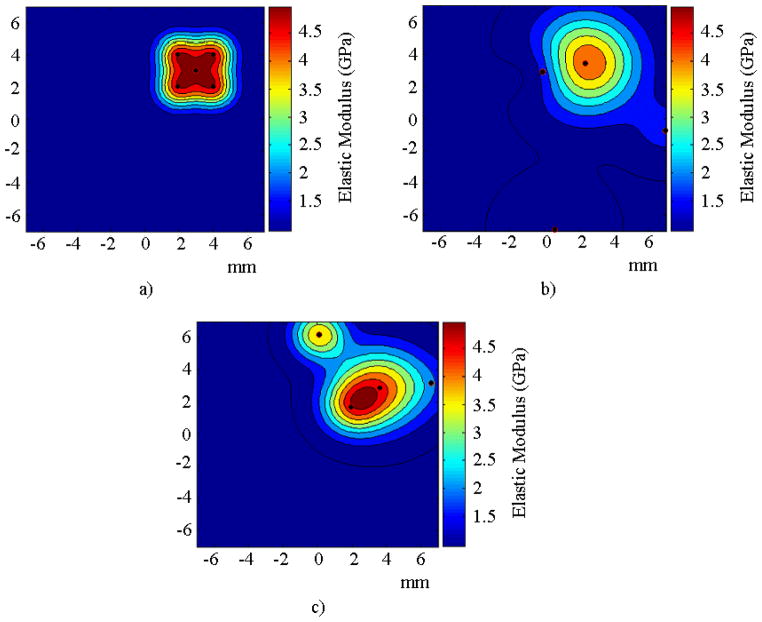
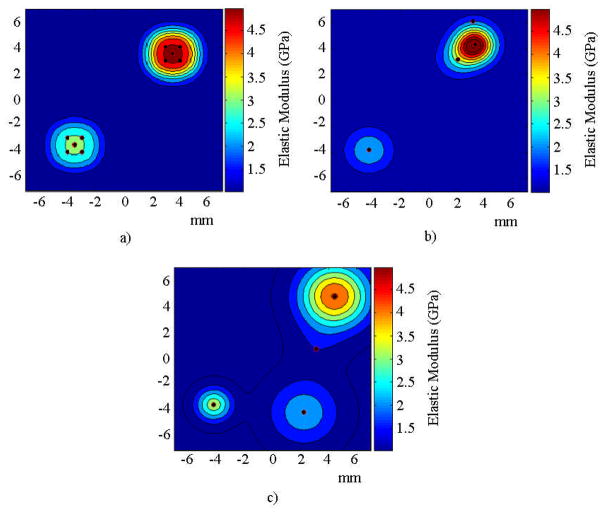
The regions in which both inclusions were located were identified in four of the five optimization runs performed with the DCM without identifying spurious inclusions. In the unsuccessful optimization run, the region in which the stiffer inclusion was located was identified, but the region in which the softer inclusion was located was not identified. When the DCM was not used, the regions in which both inclusions were located were identified in four of the five optimization runs performed. However, the results consistently showed one spurious inclusion when the DCM was not used. Figures 9b and 9c show examples of the distribution of the elastic modulus found as solutions to the inverse problem for the cases with and without the DCM, respectively.
FIGURE 9.
Spatial distribution of elastic modulus for the numerical experiment with two inclusions for a) the target solution, b) the solution to the inverse problem using the acoustic pressure response with the DCM, and c) without the DCM.
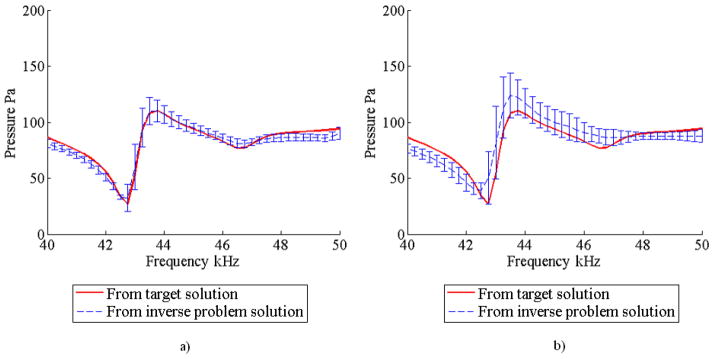
Similarly to the numerical experiments with one inclusion, forward finite element analyses were performed using the solution found in the inverse problem. Figures 10a and 10b shows the mean and standard deviation of the acoustic pressure response corresponding to one of the eight measurement points in the fluid. Again, the results corresponding to the case with DCM show higher accuracy and less scatter.
FIGURE 10.
Mean and standard deviation of the acoustic pressure response obtained from 5 optimization trials for the numerical experiment with two inclusions a) using the DCM and b) without using the DCM.
The mean and standard deviation of the matrix Young’s modulus is shown in Table 4. As in the case for one inclusion, these results show an accurate estimation of the matrix Young’s modulus regardless of the implementation of the DCM. However, in this case, there was not a significant difference in the mean values and the scatter when using the DCM versus not using DCM. A possible explanation for this behavior may be that a higher value of the error function was attained in this case as compared to the case of one inclusion (i.e. the optimization problem becomes more difficult in the present case).
TABLE 4.
Mean and standard deviation of the matrix Young’s modulus for the numerical experiment with two inclusions using the acoustic pressure response.
| Case | Target Eo (Pa) | Mean Eo (Pa) | Standard Deviation |
|---|---|---|---|
| With DCM | 1.00×10⁹ | 9.72×10⁸ | 7.06×10⁷ |
| Without DCM | 1.00×10⁹ | 9.56×10⁸ | 8.60×10⁷ |
4.3.2 Results for the surface velocity response
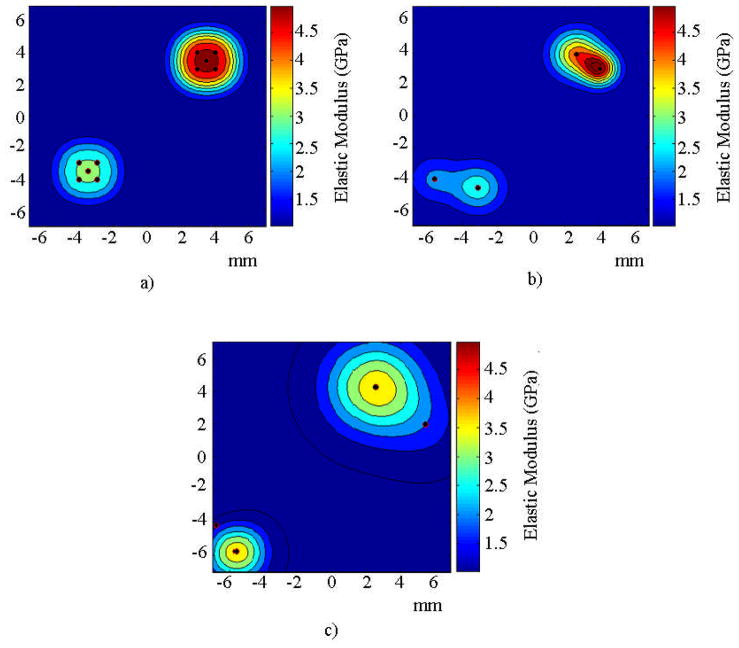
The regions in which both inclusions were located were identified in all of the optimization runs performed with the DCM. When the DCM was not used, the regions in which both inclusions were located were identified in three of the five optimization runs. In contrast to the results obtained for the acoustic pressure response, the results obtained with the surface velocity response do not show the presence of spurious inclusions. In the two unsuccessful optimization runs, the region in which the stiffer inclusion was located was identified but the region in which the softer inclusion was located was not identified. Figures 11b and 11c show examples of the spatial distribution of elastic modulus found as solution to the inverse problem with and without the DCM, respectively.
FIGURE 11.
Spatial distribution of elastic modulus for the numerical experiment with two inclusions for a) the target solution, b) the solution to the inverse problem using the surface velocity response with the DCM, and c) without the DCM.
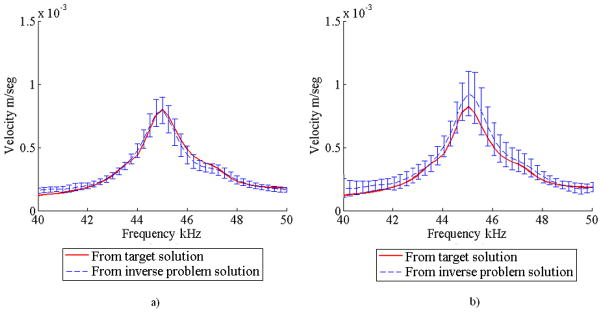
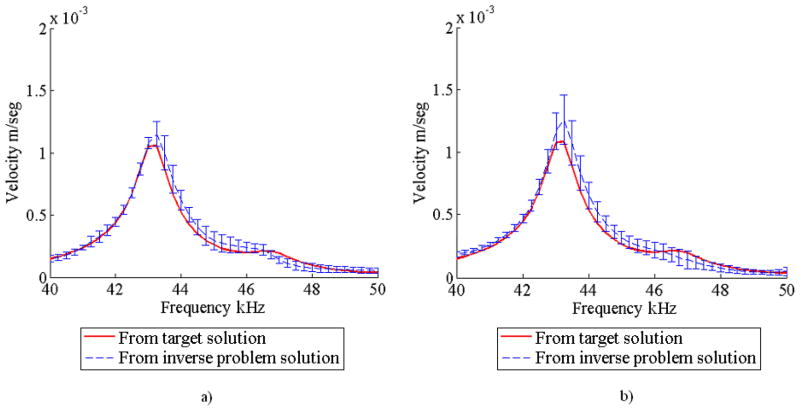
Forward finite element analyses showed that the results found with the DCM produced more accurate responses and with less scatter. Figures 12a and 12b show the mean and standard deviation of the surface velocity obtained for both cases corresponding to one of the eight measurement points in the solid. In addition, the mean and standard deviation for the matrix Young’s modulus is shown in Table 5. Similarly to the numerical experiment with one inclusion, these results show that the matrix Young’s modulus was found accurately regardless of the implementation of the DCM.
FIGURE 12.
Mean and standard deviation of the surface velocity response obtained from 5 optimization trials for the numerical experiment with two inclusions a) using the DCM and b) without using the DCM.
TABLE 5.
Mean and standard deviation of the matrix Young’s modulus for the numerical experiment with two inclusions using the surface velocity response.
| Case | Target Eo (Pa) | Mean Eo (Pa) | Standard Deviation |
|---|---|---|---|
| With DCM | 1.00×10⁹ | 1.01×10⁹ | 6.19×10⁷ |
| Without DCM | 1.00×10⁹ | 9.69×10⁹ | 6.83×10⁷ |
4.4 Physical Experiment
4.4.1 Description
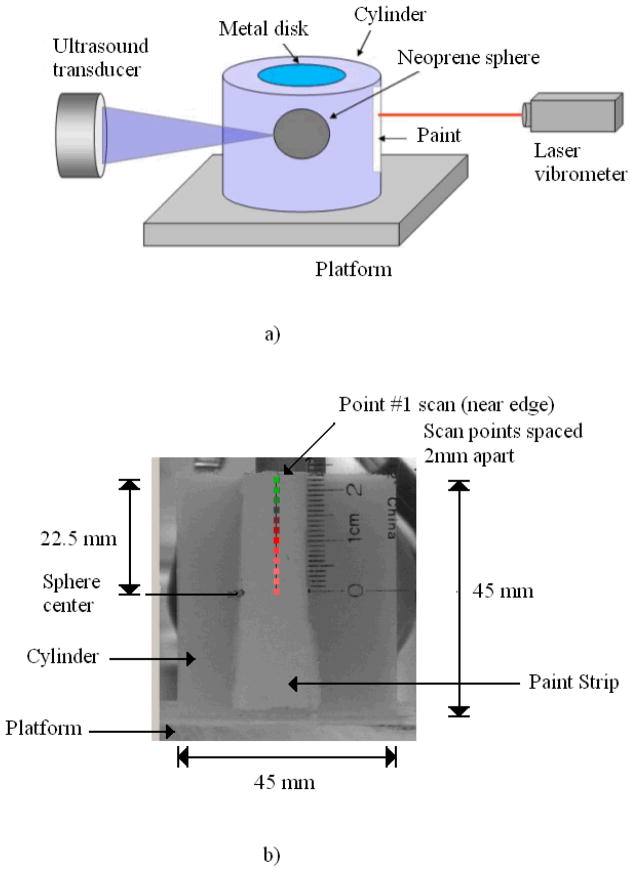
This experiment was designed to measure the vibration of a cylinder with a spherical inclusion in response to a harmonic radiation force applied to the sphere. A cylinder having a diameter of 45 mm and 45 mm length was created using a 4 % concentration agar (Bacto Agar, Becton-Dickinson, Sparks, MD) solution. The cylinder contained a 16-mm-diameter solid neoprene rubber sphere suspended in the center. The test object and the experimental setup are shown in Figure 13.
FIGURE 13.
a) Diagram of the experiment. b) Experimental setup. The photo shows the agar cylinder. The marking on the cylinder are the laser motion measurement points that are 2 mm apart. The transducer is behind the cylinder.
The cylinder rested on a platform in the water tank. To prevent the cylinder from moving due to its almost neutral buoyancy, a thin 1.4 cm diameter metal disk weighing 16.4 g was placed sitting on its top surface. A vertical narrow stripe was painted on one side of the cylinder using a thin layer of white latex paint to provide optimal reflectivity for the motion measurement by a laser vibrometer. The driving force for the sphere was provided by the radiation force of a 3 MHz ultrasound transducer having a 44 mm diameter and 7 cm focal length. This transducer was focused on the surface of the sphere along a radial line.
The excitation that was used to drive the transducer consisted of a suppressed-carrier amplitude modulated (AM) tone burst with the carrier frequency of 3 MHz and the modulation frequency of . The resulting ultrasound beam generated a harmonic radiation force at frequency fm on the sphere. The duration of the tone burst was equal to four cycles of the radiation force, i.e., . The frequency values used were fm = 100, 200, 300, 400, and 500 Hz.
The laser vibrometer (Polytec GmbH, Waldbronn, Germany) used in this experiment is capable of measuring surface velocity. The laser beam was aimed at several points on the painted portion along the length of the cylinder. Vibration of the cylinder surface resulting from the neoprene sphere vibration was detected along the vertical line indicated in Figure 13 at 2 mm intervals over a total length of 22.5 mm. The laser vibrometer velocity output was digitized and stored to computer disk for later analysis.
4.4.2 Finite Element Model
A 3D finite element model was used to simulate the physical experiment. Agar gel and rubber are well known to be nearly incompressible (i.e. υ ≈ 0.5). Therefore, Poisson’s ratio was assumed to be known. The density of the agar gel and the inclusion were also assumed known and were taken as 1000 kg/m3 and 1111 kg/m3, respectively. To represent the displacement boundary conditions of the experiment, displacements in the vertical direction were constrained at the bottom face and the displacements at the lower left corner of the solid were fixed. The solid was immersed in a spherical fluid domain with radius, rf, of 50 mm. The properties of the surrounding water were assumed to be known, with density and bulk modulus of 1000 kg/m3 and 2.2 GPa, respectively. To avoid reflection effects, the Sommerfeld radiation boundary condition was specified in the outer fluid boundary. The Sommerfeld radiation boundary condition parameters f and β were set to 1 and 1/2rf, respectively.
The radiation force was modeled as a pressure force confined on a circular region with a 0.7 mm diameter on the inclusion surface [34]. Due to the linearity of the fluid-structure equations, the surface velocity response was normalized at each measurement point by their respective maximum amplitude occurring over the frequency range. By normalizing the surface velocity response, any uncertainty in the knowledge of the magnitude of the ultrasound radiation force used in the experiment is eliminated.
It is important to point out that only velocity response was used for the case of the physical experiment because of the low frequencies involved. These low frequencies have corresponding larger wave lengths in the fluid, which would result in reflections from the tank walls and interfere with the acoustic emission emanating directly from the solid. This problem can be avoided by using higher excitation frequencies (i.e. lower wave lengths), but this leads to a very computationally demanding problem to model in 3D due to the very small wavelengths in the soft matrix. For this proof of concept, we opted for using velocity response to keep the computational demand low.
Two GRBF were used to inversely characterize the spatial distribution of elastic modulus. Consequently, the locality parameters of the GRBF, the coordinates of the GRBF centers, the Young’s modulus at the GRBF centers, and the matrix Young’s modulus were identified in the inverse problem. The stiffness proportional damping parameter, β, was set to 0 and the mass proportional damping parameter, α, was identified through the inverse problem. Table 6 shows the minimum and maximum values considered for the optimization problem [35, 36].
TABLE 6.
Search ranges for the optimization parameters of the physical experiment.
| Optimization Parameter | Optimization Minimum | Optimization Maximum |
|---|---|---|
| Eo | 10 kPa | 50 kPa |
| Einc | 100 kPa | 500 kPa |
| α | 5,000 | 15,000 |
| c | 1 mm | 12 mm |
| x | 0 mm | 45 mm |
| y | 0 mm | 45 mm |
| z | 0 mm | 70 mm |
4.4.3 Results
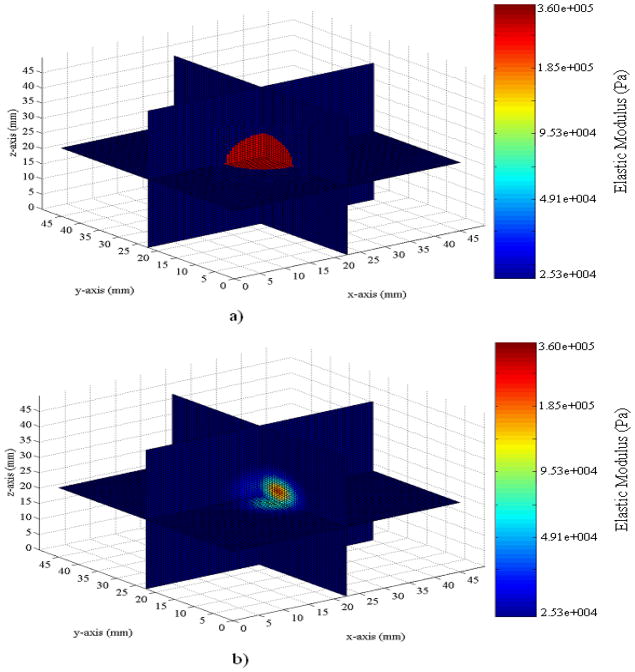
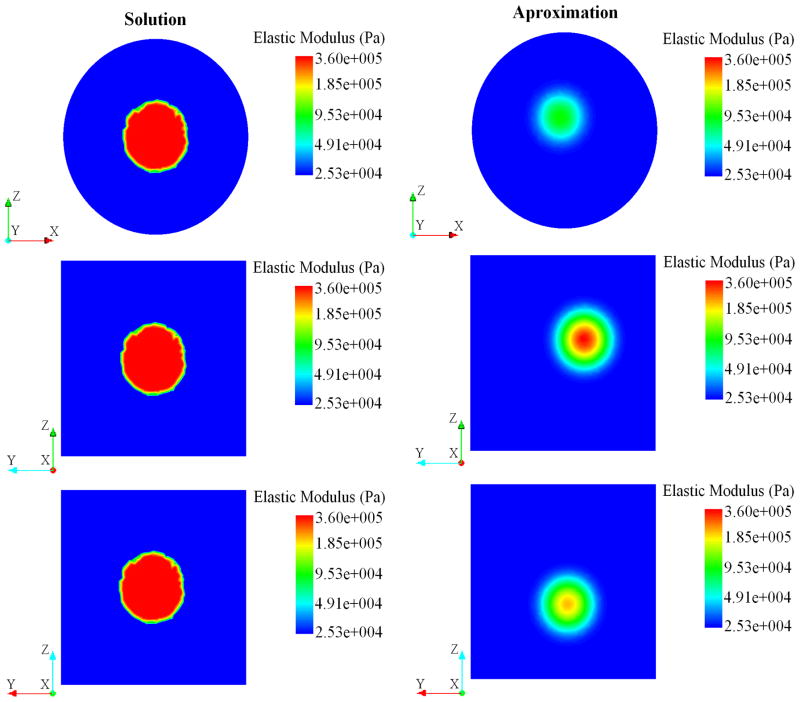
The Young’s modulus of the inclusion was measured through mechanical testing as 350 KPa. After completing the optimization problem, the Young’s modulus at the stiffest point in the domain and the matrix were 329 KPa and 25.2 KPa, respectively. Figures 14 and 15 show the spatial distribution of the elastic modulus found as a solution to the inverse problem compared to the expected distribution. It can be observed from these figures that the estimated distribution of Young’s modulus agrees with the target solution.
FIGURE 14.
Schematic of the spatial distribution of elastic modulus for a) target solution and b) the solution found through the inverse problem using the surface velocity from the physical experiment.
FIGURE 15.
Plane views for the spatial distribution of elastic modulus obtained as the solution to the inverse problem using the surface velocity from the physical experiment.
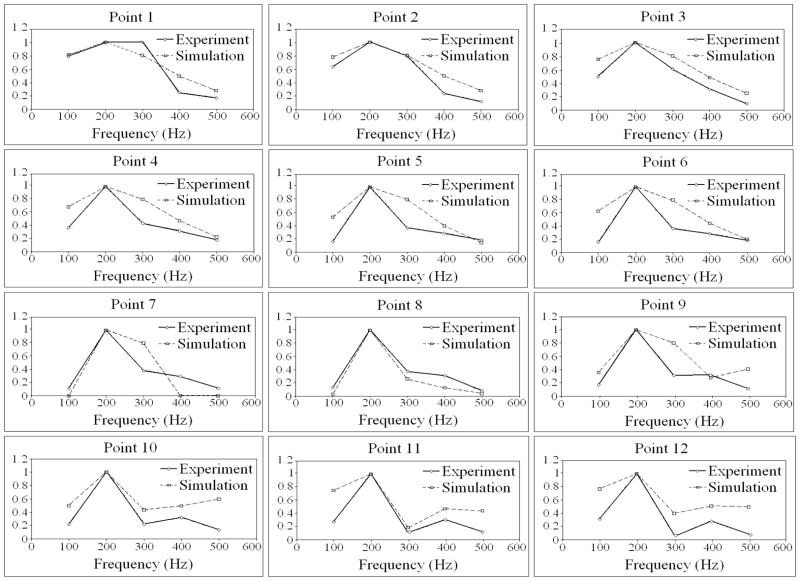
Figure 16 shows the magnitude of the surface velocity for the 12 measurements points for five excitation frequencies. In general, there was reasonable agreement between the estimated response and the observed/experimental measurements. The discrepancies observed in these plots can likely be attributed to the lack of rate dependent viscoelastic behavior in the numerical model. Future work will incorporate rate dependent viscoelastic behavior into the formulations presented herein.
FIGURE 16.
Comparison between the magnitudes of the surface velocity response found as solution to the inverse problem (IP) and the target response for: a) 100 Hz, b) 200 Hz. c) 300Hz, d) 400Hz, e) 500 Hz.
5. Conclusions
A new methodology to inversely characterize the spatial distribution of elastic moduli using vibroacoustics based techniques in combination with Gaussian radial basis function representations, non-gradient based optimization methods, and the finite element method was presented. Through numerical experiments and a physical experiment it was shown that the proposed methodology can accurately estimate the spatial distribution of the elastic modulus of solids immersed in fluids using the acoustic pressure response. It was observed that, for the case when multiple inclusions are present, the accuracy is significantly improved when the surface velocity response is used. The results reveal that Gaussian radial basis functions can efficiently represent elastic moduli distribution such as those that occur in soft biological tissue in the presence of tumors. The number of measurement points needed to inversely characterize the spatial distributions of elastic moduli is relatively small, making the use of the propose methodology feasible for realistic applications.
In addition, results revealed that for a fixed number of function evaluations the Divide and Conquer Method yielded better results in comparison to the results obtained when the Divide and Conquer Method was not used. Therefore, a reduction in computing time can be achieved by using the Divide and Conquer Method.
Although the results presented in this paper are promising, it is well known that biological tissues have rate dependent viscoelastic behavior; therefore, future work will consider estimating the spatial distributions of viscoelastic properties (viscoelasticity imaging).
Acknowledgments
The authors would like to acknowledge Cornell University, Coleman Foundation, and The National Institute of Biomedical Imaging and Bioengineering(Grant # 5R01EB002167-19s) for supporting this work.
References
- 1.Albanese RA, Banks HT, Raye JK. Nondestructive evaluation of materials using pulsed microwave interrogating signals and acoustic wave induced reflections. Inverse Problems. 2002;18:1935–1958. [Google Scholar]
- 2.Aquino W, Brigham JC. Self-learning finite elements for inverse estimation of thermal constitutive models. International Journal of Heat and Mass Transfer. 2006;49:2466–2478. [Google Scholar]
- 3.Leymarie N, Aristegui C, Audoin B, Baste S. Identification of complex stiffness tensor from waveform, reconstruction. Journal of the Acoustical Society of America. 2002;111:1232–1244. doi: 10.1121/1.1451072. [DOI] [PubMed] [Google Scholar]
- 4.Audoin B. Non-destructive evaluation of composite materials with ultrasonic waves generated and detected by lasers. Ultrasonics. 2002;40:735–740. doi: 10.1016/s0041-624x(02)00203-2. [DOI] [PubMed] [Google Scholar]
- 5.Ogi H, Sato K, Asada T, Hirao M. Complete mode identification for resonance ultrasound spectroscopy. Journal of the Acoustical Society of America. 2002;112:2553–2557. doi: 10.1121/1.1512700. [DOI] [PubMed] [Google Scholar]
- 6.Oberai AA, Gokhale NH, Feijoo GR. Solution of inverse problems in elasticity imaging using the adjoint method. Inverse Problems. 2003;19:297–313. [Google Scholar]
- 7.Miga MI. A new approach to elastography using mutual information and finite elements (vol 48, pg 467, 2003) Physics in Medicine and Biology. 2003;48:1673–1673. doi: 10.1088/0031-9155/48/4/304. [DOI] [PubMed] [Google Scholar]
- 8.Plewes DB, Bishop J, Samani A, Sciarretta J. Visualization and quantification of breast cancer biomechanical properties with magnetic resonance elastography. Physics in Medicine and Biology. 2000;45:1591–1610. doi: 10.1088/0031-9155/45/6/314. [DOI] [PubMed] [Google Scholar]
- 9.Steele DD, Chenevert TL, Skovoroda AR, Emelianov SY. Three-dimensional static displacement, stimulated echo NMR elasticity imaging. Physics in Medicine and Biology. 2000;45:1633–1648. doi: 10.1088/0031-9155/45/6/316. [DOI] [PubMed] [Google Scholar]
- 10.Doyley MM, Meaney PM, Bamber JC. Evaluation of an iterative reconstruction method for quantitative elastography. Physics in Medicine and Biology. 2000;45:1521–1540. doi: 10.1088/0031-9155/45/6/309. [DOI] [PubMed] [Google Scholar]
- 11.Samani A, Bishop J, Luginbuhl C, Plewes DB. Measuring the elastic modulus of ex vivo small tissue samples. Physics in Medicine and Biology. 2003;48:2183–2198. doi: 10.1088/0031-9155/48/14/310. [DOI] [PubMed] [Google Scholar]
- 12.Washington CW, Miga MI. Modality independent elastography (MIE): A new approach to elasticity imaging. Ieee Transactions on Medical Imaging. 2004;23:1117–1128. doi: 10.1109/TMI.2004.830532. [DOI] [PubMed] [Google Scholar]
- 13.Fu D, Levinson SF, Gracewski SM, Parker KJ. Non-invasive quantitative reconstruction of tissue elasticity using an iterative forward approach. Physics in Medicine and Biology. 2000;45:1495–1509. doi: 10.1088/0031-9155/45/6/307. [DOI] [PubMed] [Google Scholar]
- 14.Bishop J, Samani A, Sciarretta J, Plewes DB. Two-dimensional MR elastography with linear inversion reconstruction: methodology and noise analysis. Physics in Medicine and Biology. 2000;45:2081–2091. doi: 10.1088/0031-9155/45/8/302. [DOI] [PubMed] [Google Scholar]
- 15.Kallel F, Bertrand M. Tissue elasticity reconstruction using linear perturbation method (vol 15, pg 299, 1996) Ieee Transactions on Medical Imaging. 1996;15:745–745. doi: 10.1109/42.500139. [DOI] [PubMed] [Google Scholar]
- 16.Raghavan KR, Yagle AE. Forward and Inverse Problems in Elasticity Imaging of Soft-Tissues. Ieee Transactions on Nuclear Science. 1994;41:1639–1648. [Google Scholar]
- 17.Skovoroda A, Emelianov S, O’Donnell M. Tissue elasticity reconstruction based on ultrasonic displacement and strain images. Ieee Transactions of Ultrasonic Ferroelectrics Frequency Control. 1995;42:747–765. [Google Scholar]
- 18.Barbone PE, Bamber JC. Quantitative elasticity imaging: what can and cannot be inferred from strain images. Physics in Medicine and Biology. 2002;47:2147–2164. doi: 10.1088/0031-9155/47/12/310. [DOI] [PubMed] [Google Scholar]
- 19.Bercoff J, Chaffai S, Tanter M, Sandrin L, Catheline S, Fink M, Gennisson JL, Meunier M. In vivo breast tumor detection using transient elastography. Ultrasound in Medicine and Biology. 2003;29:1387–1396. doi: 10.1016/s0301-5629(03)00978-5. [DOI] [PubMed] [Google Scholar]
- 20.Fatemi M, Greenleaf JF. Ultrasound-stimulated vibro-acoustic spectrography. Science. 1998;280:82–85. doi: 10.1126/science.280.5360.82. [DOI] [PubMed] [Google Scholar]
- 21.Fatemi M, Greenleaf JF. Vibro-acoustography: An imaging modality based on ultrasound-stimulated acoustic emission. presented at Proceedings of the National Academy of Sciences of the United States of America; June 1999; [DOI] [PMC free article] [PubMed] [Google Scholar]
- 22.Brigham JC, Aquino W, Mitri FG, Greenleaf JF, Fatemi M. Inverse estimation of viscoelastic material properties for solids immersed in fluids using vibroacoustic techniques. Journal of Applied Physics. 2007;101:023509-1–023509-14. [Google Scholar]
- 23.Phillips SW, Aquino W, Chirdon W. Simultaneous Inverse Identification of Transient Thermal Properties and Heat Sources Using Sparse Sensor Information. Journal of Engineering Mechanics. 2007 [Google Scholar]
- 24.Buhmann MD. Radial Basis Functions: Theory and Implementations. 2003. [Google Scholar]
- 25.Carr JC, Fright WR, Beatson RK. Surface interpolation with radial basis functions for medical imaging. Ieee Transactions on Medical Imaging. 1997;16:96–107. doi: 10.1109/42.552059. [DOI] [PubMed] [Google Scholar]
- 26.Fornefett M, Rohr K, Stiehl HS. Radial basis functions with compact support for elastic registration of medical images. Image and Vision Computing. 2001;19:87–96. [Google Scholar]
- 27.Mitchell M. An introduction to genetic algorithm. Cambridge, Mass: MIT Press; 1998. [Google Scholar]
- 28.Goldberg DE. Genetic algorithms in search, optimization, and machine learning. Reading, Mass: Addison-Wesley; 1989. [Google Scholar]
- 29.Brigham JC, Aquino W. Surrugate-Model Accelerated Random Search algorithm for global optimization with applications to inverse material identification. Computer Methods in Applied Mechanics and Engineering. 2007;196:4561–4576. [Google Scholar]
- 30.Brooks SH. A Discussion of Random Methods for Seeking Maxima. Operations Research. 1958;6:244–251. [Google Scholar]
- 31.Regis RG, Shoemaker CA. Constrained global optimization of expensive black box functions using radial basis functions. Journal of Global Optimization. 2005;31:153–171. [Google Scholar]
- 32.Masri SF, Smyth AW, Chassiakos AG, Nakamura M, Caughey TK. Training neural networks by adaptive random search techniques. Journal of Engineering Mechanics-Asce. 1999;125:123–132. [Google Scholar]
- 33.Fatemi M, Greenleaf JF. Vibro-acoustography: An imaging modality based on ultrasound-stimulated acoustic emission. Proceedings of the National Academy of Sciences of the United States of America. 1999;96:6603–6608. doi: 10.1073/pnas.96.12.6603. [DOI] [PMC free article] [PubMed] [Google Scholar]
- 34.Alizad A, Fatemi M, Wold LE, Greenleaf JF. Performance of vibro-acoustography in detecting microcalcifications in excised human breast tissue: A study of 74 tissue samples. Ieee Transactions on Medical Imaging. 2004;23:307–312. doi: 10.1109/TMI.2004.824241. [DOI] [PubMed] [Google Scholar]
- 35.Peters A, Wortmann S, Elliott R, Staiger M, Chase JG, Van Houten E. Digital image-based elasto-tomography: First experiments in surface based mechanical property estimation of gelatine phantoms. Jsme International Journal Series C-Mechanical Systems Machine Elements and Manufacturing. 2005;48:562–569. [Google Scholar]
- 36.Van Houten EEW, Doyley MM, Kennedy FE, Weaver JB, Paulsen KD. Initial in vivo experience with steady-state subzone-based MR elastography of the human breast. Journal of Magnetic Resonance Imaging. 2003;17:72–85. doi: 10.1002/jmri.10232. [DOI] [PubMed] [Google Scholar]


