

Abstract
Objective
To categorize national medical expenditures into patient-centered categories.
Data Sources
The 2007 Medical Expenditure Panel Survey (MEPS), a nationally representative annual survey of the civilian noninstitutionalized population.
Study Design
Descriptive statistics categorizing expenditures into seven patient-centered care categories: chronic conditions, acute illness, trauma/injury or poisoning, dental, pregnancy/birth-related, routine preventative health care, and other.
Data Collection Methods
MEPS cohort.
Principal Findings
Nearly half of expenditures were for chronic conditions. The remaining expenditures were as follows: acute illness (25 percent), trauma/poisoning (8 percent), dental (7 percent), routine preventative health care (6 percent), pregnancy/birth-related (4 percent), and other (3 percent). Hospital-based expenditures accounted for the majority for acute illness, trauma/injury, and pregnancy/birth and over a third for chronic conditions.
Conclusions
This patient-centered viewpoint may complement other methods to examine health care expenditures and may better represent how patients interact with the health care system and expend resources.
Keywords: National medical expenditures, patient-centered care, health policy
The traditional method of reporting health care costs in the United States is by setting or payer, such as the National Health Expenditure Accounts (NHEA), produced by the Centers for Medicare & Medicaid Services (CMS) (Centers for Medicare and Medicaid Services 2009). International comparisons have predominantly focused on overall trends, financing agent, provider, and function, and often provide limited information on specific consumer encounters and spending (Anderson and Hussey 2001; Orosz and Morgan 2004;). The Organization for Economic Co-Operation and Development has examined person-centered categories of health spending. These methods are useful for trends overall and by setting and payer but do not predominantly focus on how consumers actually interact with the health care system. We aimed to combine traditional methods of accounting with a patient-centered viewpoint to more fully identify the underlying factors driving costs and potential levers for efficient allocation of health care resources.
The Medical Expenditure Panel Survey (MEPS) collects data on conditions, services, individual characteristics, setting, and payers (Agency for Healthcare Research and Quality 2009). Our objective was to classify all U.S. health care expenditures into patient-centered categories that capture health events in a manner that is closer than conventional methods (e.g., by setting or payer) to how consumers experience and consider their health and health care spending. We used MEPS data to classify medical expenses in 2007 into seven “patient-centered care” categories. This method of examining expenditures can complement traditional methods to provide additional insight into spending. This categorization may better identify the drivers of health care expenditures and suggest more focused policy solutions to improve the value and efficiency of the health care system.
STUDY DATA AND METHODS
Data Source
This analysis is based on data from the 2007 MEPS (Agency for Healthcare Research and Quality 2009), a nationally representative annual survey of approximately 15,000 households that has been conducted since 1996. The survey collects data on the civilian noninstitutionalized population and is used to produce annual population estimates and behavioral and economic analyses of health care use, expenditures, insurance coverage, sources of payment, access to care, and health care quality. Five different rounds of personal interviews are supplemented by data from respondents' medical providers. Annual estimates are based on data from three separate interviews for each sample person.
Classification Scheme for Patient-Centered Care Categories
Expenditures reported in MEPS were classified into seven patient-centered care categories attempting to be mutually exclusive, collectively exhaustive in the hierarchical order shown below. Expenses that could potentially be assigned to multiple categories were assigned to the highest appropriate category in the following order. Because of their relative lack of overlap, the order of the first four categories does not significantly change results. Dental has no overlap with other categories.
Pregnancy or Birth-Related
Expenses for medical events associated with MEPS Clinical Classification Software codes 177–196 or 218–224 (http://www.hcup-us.ahrq.gov/toolssoftware/ccs/ccs.jsp), office-based and hospital outpatient visits reported as being for maternity care, and inpatient stays where the reason for the stay was to give birth.
Trauma/Injury or Poisoning
Expenses for medical events associated with MEPS Clinical Classification Software codes 225–244 (http://www.hcup-us.ahrq.gov/toolssoftware/ccs/ccs.jsp), and office, hospital outpatient, and emergency room visits reported as being for an emergency (i.e., accident or injury).
Routine Preventative Health Care
Expenses for office-based and hospital outpatient visits that were reported as being for a general checkup, immunizations or shots, vision exams, or well-child exams.
Dental
Expenses for all dental events. Dental expenses are not captured by ICD-9 codes, so this category is completely mutually exclusive and placement in hierarchy does not affect calculation.
Chronic Conditions
Expenses for medical visits or inpatient stays (including those with both chronic and acute conditions) that could be linked with the MEPS Chronic Condition Indicator software (http://www.hcup-us.ahrq.gov/tools_software.jsp), the MEPS category for other medical equipment and supplies (except ambulance services), insulin and diabetic supply purchases, expenses for prescribed medicines used primarily to treat chronic conditions.
Acute Illness
Expenses for events that had at least one medical condition reported for the event, office and hospital outpatient follow-up and postop visits, inpatient stays reported as being for an operation or surgical procedure, expenses reported for ambulance services, expenses for home health care received by Medicare beneficiaries following a hospital visit, expenses for prescribed medicines used primarily to treat acute illnesses, half of expenses for medications used to treat both chronic and acute conditions, and expenses for emergency room and inpatient stays that were not classified as chronic above.
Other
Expenses for nondental events that did not meet any of the criteria for the other categories.
Expenditures and Sources of Payment
Expenditures include total direct payments from all sources to hospitals, physicians, other providers of health care services (including dental care), and pharmacies for services reported by respondents in the MEPS household survey. Hospital-based services include both facility and separately billed physician services.
Payment sources are out-of-pocket (by user or family), private insurance (including Medigap and TRICARE), Medicare, Medicaid, and other (including a variety of other sources, such as Department of Veterans Affairs, Indian Health Service, and Workers' Compensation).
Statistical Analyses
Complex survey design features in the SAS and SUDAAN statistical software programs were used to generate estimates for this article. All differences between estimates noted in the text were statistically significant at the 0.05 level or lower.
RESULTS
Overall Expenditures by Care Category
In 2007, an estimated U.S.$1.13 trillion was spent on care for the over 300 million persons in the U.S. civilian noninstitutionalized population. MEPS expenditures are lower than the CMS NHEA for multiple reasons, including MEPS being based on personal health care services from household surveys, MEPS not including populations such as institutionalized individuals or military, and NHEA including expenditures such as research, public health services, and investment income. Almost half was spent on chronic conditions (47 percent) and <10 percent in decreasing order was spent on trauma/poisoning, dental, routine preventative health care, and pregnancy/birth-related (Figure 1).
Figure 1.
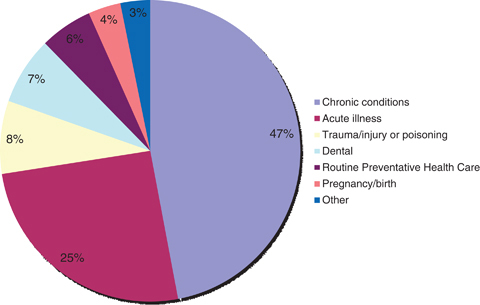
Total Health Care Spending by Patient-Centered Care Category for U.S. Civilian Noninstitutionalized Population in 2007
Expenditures for Care Categories by Type of Service
Expenditures for patient-centered care categories varied across types of service and settings (Table 1). Overall, expenditures were primarily for inpatient treatment (31.3 percent), office-based visits (23.5 percent), and prescription drugs (20.7 percent). The highest spending for chronic conditions was for prescription medicines (34.8 percent) and inpatient treatment (29.9 percent). Hospital expenditures, including outpatient hospital, accounted for more than half of expenditures for acute illness, trauma/injury, and pregnancy/birth and over a third for chronic conditions. Over two-thirds of spending for trauma, injury, or poisoning was for care received in a hospital setting (inpatient, outpatient, or emergency department). The only care category with the majority of spending in the office-based setting was routine preventative health care (90 percent). Over 75 percent of spending for prescribed medicines (U.S.$184 of U.S.$233 billion) was related to chronic conditions. None of the care categories had greater than 10 percent of expenditures for home health.
Table 1.
Total Expenditures by Type of Service for Each Care Category*
| Total | Inpatient | Office-Based | PrescribedMedicines | HospitalOutpatient | Dental | EmergencyRoom | HomeHealth | OtherMedical† | |||||||||
|---|---|---|---|---|---|---|---|---|---|---|---|---|---|---|---|---|---|
| U.S.$Billions | U.S.$Billions | % | U.S.$Billions | % | U.S.$Billions | % | U.S.$Billions | % | U.S.$Billions | % | U.S.$Billions | % | U.S.$Billions | % | U.S.$Billions | % | |
| Overall | 1,126 | 353 | 31.3 | 264 | 23.5 | 233 | 20.7 | 96 | 8.5 | 82 | 7.3 | 38 | 3.4 | 38 | 3.4 | 23 | 2.0 |
| Chronic conditions | 530 | 158 | 29.9 | 95 | 18.0 | 184 | 34.8 | 35 | 6.5 | 9 | 1.7 | 28 | 5.3 | 20 | 3.8 | ||
| Acute illness | 287 | 128 | 44.4 | 61 | 21.4 | 44 | 15.5 | 30 | 10.5 | 18 | 6.2 | 3 | 1.1 | 3 | 0.9 | ||
| Trauma/injury or poisoning | 88 | 40 | 45.7 | 23 | 26.3 | 2 | 2.2 | 9 | 10.4 | 11 | 12.0 | 3 | 3.5 | ||||
| Dental | 82 | 82 | 100.0 | ||||||||||||||
| Routine preventative health care | 63 | 57 | 90.0 | 6 | 10.0 | ||||||||||||
| Pregnancy/birth | 39 | 27 | 67.6 | 10 | 25.0 | 0.4 | 1.1 | 2 | 4.0 | 1 | 2.1 | 0.1 | 0.3‡ | ||||
| Other | 36 | 17 | 48.7 | 1 | 4.1 | 14 | 38.0 | 3 | 9.3 | ||||||||
Total may not add to exactly 100.0 due to rounding.
Includes glasses/contact lenses, ambulance services, orthopedic items, hearing devices, prostheses, bathroom aids, medical equipment, disposable supplies, alterations/modifications (to homes), and other miscellaneous items.
Estimate has high sampling error (Relative Standard Error>30%).
Source: Derived from the authors' analysis of 2007 Medical Expenditure Panel Survey (MEPS) data, AHRQ.
Expenditures by Age, Race/Ethnicity, and Gender
As expected, spending varied by age (Table 2). The percent of spending for chronic conditions increased with age from 31.7 percent in the 0–17 year age group to over half of expenditures for those ages 45 and over. The percent of spending for two categories (dental and routine health care) generally decreased with increasing age. The distribution of spending was fairly similar across racial/ethnic groups, with a few exceptions. The proportion of spending attributed to acute illness was lower for Asians (17.3 percent) than other groups. Hispanics had a significantly higher proportion of spending on pregnancy/birth than blacks or whites. After excluding expenditures for pregnancy/birth (5.5 percent of total expenses for females), there was little difference between males and females in the distribution of expenses by care category.
Table 2.
Expenditures for Care Categories by Age, Race/Ethnicity, and Gender
| Age | Race/Ethnicity* | Gender | ||||||||
|---|---|---|---|---|---|---|---|---|---|---|
| 0–17 | 18–44 | 45–64 | 65 andOlder | White, Non-Hispanic | Black,Non-Hispanic | Hispanic | Asian,Non-Hispanic | Male | Female | |
| Total expenses (U.S.$ billions) | 102.4 | 236.4 | 425.1 | 362.0 | 839.8 | 124.6 | 95.7 | 39.4 | 490.0 | 636.0 |
| Patient-centered care category | Percent Distribution† | |||||||||
| Chronic conditions | 31.7 | 32.2 | 51.2 | 56.2 | 47.7 | 50.8 | 42.0 | 34.4 | 49.6 | 45.1 |
| Acute illness | 27.2 | 25.3 | 24.5 | 26.3 | 25.2 | 26.4 | 30.9 | 17.3 | 25.3 | 25.7 |
| Trauma/injury or poisoning | 6.5 | 9.4 | 8.8 | 6.1 | 7.7 | 6.3 | 5.0 | 23.9‡ | 10.0 | 6.2 |
| Dental | 18.3 | 9.5 | 6.6 | 3.6 | 7.6 | 5.2 | 7.0 | 8.2 | 7.0 | 7.5 |
| Routine preventative health care | 10.1 | 5.1 | 5.4 | 5.0 | 5.6 | 5.5 | 5.5 | 6.6 | 5.2 | 6.0 |
| Pregnancy/birth | 3.5‡ | 15.2 | 0.0‡ | 0.0‡ | 2.9 | 3.2 | 6.3 | 7.4‡ | 0.2‡ | 6.0 |
| Other | 2.7 | 3.3 | 3.6 | 2.8 | 3.3 | 2.6 | 3.3 | 2.2 | 2.7 | 3.6 |
Estimates not shown for other race/ethnic subgroups due to insufficient sample sizes.
Total may not add to exactly 100.0 due to rounding.
Estimate has high sampling error (Relative Standard Error>30%).
Source: Derived from the authors' analysis of 2007 Medical Expenditure Panel Survey (MEPS) data, AHRQ.
Expenditures by Source of Payment
The distributions by source of payment for the seven categories of care varied significantly (data not shown). Medicare and Medicaid had a higher percentage of expenditures dedicated to chronic conditions than private insurance. Medicaid had a higher percentage of its expenditures dedicated to pregnancy/birth than other sources of payment. Approximately 16 percent of all health care expenses were paid out of pocket, but this proportion varied, accounting for the lowest percentages of spending for pregnancy/birth (7.6 percent) and the highest proportion for dental care (49.1 percent).
DISCUSSION
The first major implication of this study is the power of examining expenditures based on how patients experience care. Health care expenditures are typically categorized based on the payer or setting; therefore, changes over time and potential policies are considered through this lens (Centers for Medicare and Medicaid Services 2009). However, this is not how patients experience care. Patients have a chronic disease, pregnancy, trauma, or some other life event. These life events drive how patients experience the health care system, make decisions, and spend their health care dollars. MEPS is a useful data source for examining expenditures through a patient-centered lens because it is based on a household survey methodology.
We believe this is the first study to examine expenditures based on patient-centered care categories. The potential policy, payment, provider, and patient levers to influence expenditures based on these categories would be more specific and directly aligned with how patients experience care. One can further segment spending by care categories based on traditional parameters, such as setting (e.g., chronic conditions for inpatient hospital care). For example, if a state or the nation implemented a policy to attempt to decrease inpatient costs for chronic conditions or increase the percentage of expenditures overall allocated to routine preventative care, this methodology would allow tracking expenditures for the particular patient-centered care category.
The CMS NHEA data released each year receives substantial publicity within health care and to the broader public. These data are critical for overall trends in health spending; however, we believe that this viewpoint from MEPS could complement that data. CMS NHEA is primarily based on provider expenditures and includes categories such as research, structures and equipment, public health investment, and administrative costs. If one asks a question such as how much are we spending on injury, routine preventative health care, or pregnancy/birth, the CMS NHEA does not provide the answer (Sing et al. 2006). MEPS is a valuable data source for answering these types of questions. These patient-centered expenditures may also lend more direct connections to potential policy interventions. For example, health reform included multiple policy interventions to increase use of preventative health care; this type of analysis performed annually could answer the question of whether the percentage of expenditures in this category increases over time. Correspondingly, one could examine whether the increase in routine preventative health care lowered the rate of growth and relative percentage of expenditures in categories such as chronic conditions. This data will not be able to prove causality that routine health care decreased chronic conditions through prevention of disease or better managed chronic conditions, but it could assess the associations and trends over time if performed annually. Finally, more in-depth studies of interventions at the state or local level could attempt, using these categorizations, to assess the effects of interventions (e.g., intervention to decrease inpatient hospital expenditures for chronic conditions) on these categories of care.
Another potential use of this information is for identifying priorities. For example, research priorities for comparative effectiveness research by the new Patient-Centered Outcomes Institute from the Affordable Care Act and overall biomedical research priorities should be influenced by the relative costs. This information provides a high-level look at expenditures, and expenditures could be analyzed further within a specific category (e.g., chronic conditions) to identify the specific conditions associated with high levels of expenditures. One could also ask whether the research funding allocated to categories such as injury/trauma or pregnancy/birth is aligned with their expenditure level.
This method to assess national health care expenditures can also drill down deeper into determining drivers of medical costs. This study found, as have others, that chronic conditions are the major driver of costs in the United States (Bodenheimer and Fernandez 2005; Agency for Healthcare Research and Quality 2009;). Unfortunately, chronic care management has a mixed history, with many intervention models failing to improve quality, control costs, or both (Bott et al. 2009; Peikes et al. 2009;). Models to better manage patients with chronic conditions should be a major focus of future interventions and research, with successful models being spread broadly and further tested. Comparative effectiveness evidence to inform the selection of medications for those with chronic conditions, appropriate provider and patient education, and incentives for high-value medication use are all needed (Conway and Clancy 2009). In addition, practice-based quality improvement collaboratives may help increase the quality and efficiency of care delivered to patients with chronic conditions (American Board of Medical Specialties 2009). The economic impact of these initiatives could be assessed using our model for tracking expenditures. The data also highlight that inpatient and outpatient hospital expenditures accounted for a significant proportion of expenditures for acute illness, trauma/injury, and chronic conditions. This may represent an opportunity to decrease expenditures through care management that prevents hospitalizations for some of these conditions.
This study has several limitations. First, MEPS data do not include institutionalized individuals or those in the military so will not capture expenditures for these populations. Institutionalized populations being excluded could result in underestimating expenditures in categories such as chronic conditions. Second, MEPS data on health care utilization, condition, and service categories are household and provider reported and therefore despite efforts to validate data, misclassification could occur. Third, MEPS will provide lower total estimates for health care expenditures than those produced by CMS due to different sampling, methods, and populations and related expenditures included. Finally, some categories have potential for overlap (e.g., chronic and acute) and assumptions had to be made on how to code expenditures into care categories, so potential for misclassification exists. For example, the assumption to place chronic above acute in the hierarchy will preferentially allocate expenses to the chronic condition if an encounter is for both chronic disease and acute exacerbation or acute illness. However, changing these assumptions did not substantially alter the overall picture of expenditures described in this manuscript. Future analyses could define even more specific care categories and evaluate the frequency that patients have expenditures in multiple categories.
In summary, this patient-centered viewpoint on our nation's health care expenditures could become an important complementary method to examine health care expenditures, identify trends, and monitor how policies affect these trends in the future.
Acknowledgments
Joint Acknowledgment/Disclosure Statement: None.
Disclosures: None.
Disclaimers: The views expressed in this manuscript represent the authors and do not represent official policy or opinions of the Department of Health and Human Services or the Agency for Healthcare Research and Quality.
SUPPORTING INFORMATION
Additional supporting information may be found in the online version of this article:
Appendix SA1: Author Matrix.
Please note: Wiley-Blackwell is not responsible for the content or functionality of any supporting materials supplied by the authors. Any queries (other than missing material) should be directed to the corresponding author for the article.
REFERENCES
- Agency for Healthcare Research and Quality. 2009. “Medical Expenditure Panel Survey” [accessed on November 8, 2009]. Available at http://www.meps.ahrq.gov/mepsweb/ [DOI] [PubMed]
- American Board of Medical Specialties. 2009. “Improving Performance in Practice” [accessed on November 8, 2009]. Available at http://www.abms.org/about_abms/abms_research/current.aspx.
- Anderson G, Hussey PS. Comparing Health System Performance in OECD Countries. Health Affairs. 2001;20(3):219–31. doi: 10.1377/hlthaff.20.3.219. [DOI] [PubMed] [Google Scholar]
- Bodenheimer T, Fernandez A. High and Rising Health Care Costs. Part 4: Can Costs Be Controlled While Preserving Quality? Annals of Internal Medicine. 2005;143(1):26–31. doi: 10.7326/0003-4819-143-1-200507050-00007. [DOI] [PubMed] [Google Scholar]
- Bott DM, Kapp MC, Johnson LB, Magno LM. Disease Management For Chronically Ill Beneficiaries in Traditional Medicare. Health Affairs. 2009;28(1):86–98. doi: 10.1377/hlthaff.28.1.86. [DOI] [PubMed] [Google Scholar]
- Centers for Medicare and Medicaid Services. 2009. “National Health Expenditure Accounts” [accessed on November 8, 2009]. Available at http://www.cms.hhs.gov/NationalHealthExpendData/ [PubMed]
- Conway PH, Clancy C. Transformation of Health Care at the Front Line. Journal of American Medical Association. 2009;301(7):763–65. doi: 10.1001/jama.2009.103. [DOI] [PubMed] [Google Scholar]
- Orosz E, Morgan D. 2004. “National Health accounts in Thirteen OECD Countries: A Comparative Analysis” [accessed on June 15, 2010]. Available at http://www.oecd.org/dataoecd/10/53/33661480.pdf.
- Peikes D, Chen A, Schore J, Brown R. Effects of Care Coordination on Hospitalization, Quality of Care, and Health Care Expenditures among Medicare Beneficiaries: 15 Randomized Trials. Journal of American Medical Association. 2009;301(6):603–18. doi: 10.1001/jama.2009.126. [DOI] [PubMed] [Google Scholar]
- Sing M, Banthin JS, Selden TM, Cowan CA, Keehan SP. Reconciling Medical Expenditure Estimates from the MEPS and NHEA, 2002. Health Care Financ Rev. 2006;28(1):25–40. [PMC free article] [PubMed] [Google Scholar]
Associated Data
This section collects any data citations, data availability statements, or supplementary materials included in this article.