

Abstract
Context
To effectively bargain about the price and quality of health services, health insurers need to successfully channel their enrollees. Little is known about consumer sensitivity to different channeling incentives. In particular, the impact of status quo bias, which is expected to differ between different provider types, can play a large role in insurers' channeling ability.
Objective
To examine consumer sensitivity to channeling strategies and to analyze the impact of status quo bias for different provider types.
Data Sources/Study Design
With a large-scale discrete choice experiment, we investigate the impact of channeling incentives on choices for pharmacies and general practitioners (GPs). Survey data were obtained among a representative Dutch household panel (n=2,500).
Principal Findings
Negative financial incentives have a two to three times larger impact on provider choice than positive ones. Positive financial incentives have a relatively small impact on GP choice, while the impact of qualitative incentives is relatively large. Status quo bias has a large impact on provider choice, which is more prominent in the case of GPs than in the case of pharmacies.
Conclusion
The large impact of the status quo bias makes channeling consumers away from their current providers a daunting task, particularly in the case of GPs.
Keywords: Managed competition, preferred provider choice, consumer channeling, status quo bias, discrete choice experiments
In managed care markets, health insurers bargain over the price and quality of health care services. Selective contracting is an important tool for health insurers in negotiations with health care providers. Empirical research in the United States showed that health insurers using exclusionary provider networks obtain higher discounts than insurers without restrictions on provider choice (Staten, Dunkelberg, and Umbeck 1987; Melnick et al. 1992; Sorensen 2003;). Research on health plan choice in the United States, however, showed that consumers are reluctant to choose a health plan with stringent restrictions on provider choice. Consumers dislike or even distrust some of these very restrictive forms of managed care (Feldman et al. 1989; Gawande et al. 1998; Chu-Weininger and Balkrishnan 2006; Miller 2006;).
As an alternative to exclusionary networks, health insurers can also use preferred provider networks in which enrollees still have the option to seek out-of-network care. In that case, the bargaining position of health insurers largely depends on their ability to channel enrollees toward preferred providers (Pauly 1987). In turn, this ability depends on the attractiveness of the network and consumers' propensity to switch to another provider. The latter is limited by the status quo bias. Status quo bias arises once consumers are reluctant to leave their current provider even if better alternatives are readily available (Neipp and Zeckhauser 1985; Samuelson and Zeckhauser 1988; Strombom, Buchmueller, and Feldstein 2002;). Switching costs, uncertainty about other alternatives, and the relationship consumers have with their current provider determine the importance of the status quo bias.
Despite the widespread use of preferred provider networks in the United States, surprisingly little is known about the insurer's ability to channel enrollees toward preferred providers. Most research focused on the impact of price on health care utilization or on health plan choice (Glied 2000; Zweifel and Manning 2000;). In a recent paper, Wu (2008) finds that health plans that successfully channel patients can extract greater discounts but that it still remains unclear which strategies are effective in directing patients to preferred providers. Furthermore, it is unclear whether the effectiveness of channeling incentives differs for different provider types. In many countries with social health insurance systems (e.g., Germany, the Netherlands, Switzerland), health insurers are nowadays provided with incentives and tools, such as selective contracting, to act as prudent buyers of care on behalf of their enrollees.
We examine the potential effectiveness of patient channeling by third parties, as this is required before one can reap the benefits from exclusionary and preferred provider networks. We particularly focus on the impact of status quo bias on provider choice. We confine our investigation to GPs and pharmacies because these are most frequently consulted and because consumer sensitivity to channeling incentives may differ most strongly between these providers. These questions are investigated in the context of the Dutch health care system, in which GPs perform an important role as gatekeeper. In 2006, the Dutch health care system was profoundly reformed to provide competing health insurers with incentives to selectively contract providers (Van de Ven and Schut 2008). The results are relevant for all countries in which health insurers or other third parties aim to influence provider choice.
Context
The Dutch health insurance system has been recently reformed profoundly by the introduction of the new Health Insurance Act (HIA) in 2006. The HIA is based on the principles of managed competition within the context of a national health insurance system under which all persons who legally live or work in the Netherlands are obliged to buy, on an annual basis, a basic benefit package from a private health insurer (Enthoven and van de Ven 2007). The HIA provides insurers with incentives to act as prudent buyers of care on behalf of their enrollees and bargain with providers over the price and quality of care. To this end, health insurers are allowed to selectively contract or vertically integrate with health care providers. During the first years after the reforms, these new opportunities were sparsely used, although several health insurers started to experiment with channeling patients to designated preferred providers (primarily pharmacies, physiotherapists, and hospitals).
In the Dutch health care system, GPs traditionally act as gatekeepers. People are obliged to register with one single GP and require a referral from their GP to visit other health care providers. GPs have a strong advisory role in provider choice. The majority of the Dutch enrollees, for example listen to hospital advice given by their GP (RVZ 2003; De Vries 2006;). In contrast to the choice of hospital, the choice of GP is largely determined by the consumers themselves. This is an important reason for including GPs rather than hospitals in our choice experiment. Once health insurers are able to channel enrollees toward preferred GPs, they may be able to influence consumer choice for other health care providers as well. GPs receive a fixed capitation fee per registered patient and a regulated maximum fee of 9 euros per consultation. The majority of GPs are working in independent solo or duo practices. Furthermore, most GPs are, for nonemergency care, only open during office hours on weekdays and limit telephone access to a certain time period per day, for example, from 8:00 to 12:00 a.m.
In contrast to the United States and many other countries, only licensed pharmacies are allowed to dispense prescription drugs. About one-third of the work by Dutch pharmacists consists of care-related activities (e.g., pharmacotherapeutic consultation, medication surveillance) (Mark 2008). Pharmacists are free to provide any listed medicine within a therapeutic class, unless the GP prescribes a specific drug. Pharmacies receive a fixed payment per prescription and can negotiate discounts on official list prices with manufacturers or wholesalers. Also pharmacies are, for nonemergency care, only open during office hours on weekdays.
We expect consumer loyalty to differ substantially between GPs and pharmacies. Because consumers register with a single GP, they often have a long-term and confidential relationship with their GP. Because in case of pharmacies the retail function seems to be more important than providing care (e.g., medication counseling), consumers are less likely to build a strong relationship with a particular pharmacy. We therefore expect preferences for one's current GP to be (much) stronger than for one's current pharmacy.
Methods
Selection of the Attributes and Levels
To compare consumer preferences for contractible aspects of GPs and pharmacies, two discrete choice experiments (DCEs) are designed. A DCE is a method to elicit consumer preferences and willingness to pay values. DCEs involve the creation of hypothetical choice scenarios, in which alternatives are described in terms of their characteristics (attributes). Respondents' stated choices are expected to reflect their underlying preferences (Lancsar 2002).
The choice of attributes is based on a literature review about patient preferences for providers and on consultations with health insurers, pharmacies, and the Dutch GP association. In addition, we evaluated whether pharmacies and GPs differentiated themselves by offering different services in the current market. For reasons of comparison between the two providers, we tried to use as many similar attributes as possible. We find that distance, quality, low waiting times, easy access, availability of out-of-office hours of care, a good doctor–patient relationship, and good communication and information are the most important attributes in provider choice (Garnick et al. 1989; Kim 1990; Vick and Scott 1998; Tai, Porell, and Adams 2004; Longo et al. 2006; Rubin et al. 2006; Boonen, Schut, and Koolman 2008; Hole 2008;). In addition, in recent years, GPs and pharmacies started offering online services, extended opening hours, and telephone access and meetings on medication management, which consumers value positively (Lems 2006).
The selected attributes are related to the different strategies health insurers can use to motivate enrollees to visit a preferred provider: financial incentives, qualitative incentives, and practice characteristics (see Table 1). The incentives and practice characteristics that are comparable for both the GP and the pharmacy are described using the same wording to make them comparable between the two providers.
Table 1.
Attributes and Levels
| Attribute | Levels |
|---|---|
| General practitioner (GP) and pharmacy | |
| I Financial incentives | |
| Copayment | No copayment |
| 3 euro per prescription per visit | |
| 6 euro per prescription per visit | |
| 9 euro per prescription per visit | |
| Discount | No discount |
| 3 euro per prescription per visit | |
| 6 euro per prescription per visit | |
| 9 euro per prescription per visit | |
| II Qualitative incentives | |
| Extra opening hours | GP: |
| No out-of-office hours care | |
| One or two evenings available for out-of-office hours care | |
| Pharmacy: | |
| No extra office hours | |
| Extra office hours during the evenings and/or on Saturday | |
| Internet service | No, not available |
| Yes, available | |
| Certificate of quality | No, not present |
| Yes, present | |
| III Practice characteristics | |
| Distance from home address (walking distance in minutes) | 5 minutes |
| 15 minutes | |
| 25 minutes | |
| 35 minutes | |
| Type of practice | GP: |
| GP-only | |
| GP and pharmacy | |
| GP and other primary care providers (primary care center) | |
| Pharmacy: | |
| Pharmacy-only | |
| Pharmacy and GP | |
| Pharmacy and other primary care providers (primary care center) | |
| GP-only | |
| Telephone access | Basic access (8:00 a.m.–11:00 p.m.) |
| Extended access (all day: 8:00 a.m.–5:30 p.m.) | |
| Availability of practice assistants | No, not available |
| Yes, available | |
| Pharmacy-only | |
| Meetings on medication management | No, no meetings on medication management |
| Yes, regular meetings on medication management | |
| Consumer satisfaction with the pharmacy | Bad |
| Reasonable | |
| Good | |
| Very good | |
Because individuals typically react differently to similar positive and negative incentives because of loss aversion (Kahneman, Knetsch, and Thaler 1991; Tversky and Kahneman 1991;), we study the impact of both a negative financial incentive (copayment) and a positive financial incentive (discount). In case of negative financial incentives, consumers are confronted with an out-of-pocket payment of 9 euros per visit to each GP (equal to the standard fee per consultation) or 9 euros per prescription drug from each pharmacy. The positive financial incentive used is a discount up to 9 euros on this out-of-pocket payment.
In an earlier questionnaire, the attributes for the pharmacy were piloted under a panel of enrollees from a health insurer. The survey showed that the chosen attributes were relevant and the DCE choice tasks were easy to understand for respondents.
Experimental Study Design and Data Collection
Questionnaire data were collected using an Internet-based household panel (n=2,500) that is representative of the adult Dutch population (age >18 years). Respondents who participate in the Internet-based household panel are provided with questionnaires biweekly. Respondents are selected on the basis of their background characteristics to make sure the panel is representative of the Dutch adult population. People without Internet are provided with an Internet connection or receive the questionnaires on their television.
The same panel received the questionnaire about pharmacy choice as well as the questionnaire about GP choice. Background characteristics of the respondents such as age, gender, and health status are available. The overall response rate was about 80 percent.
In the first part of the questionnaire, respondents are confronted with questions about their current GP and pharmacy, their health care utilization and several propositions focusing on consumers' preferences concerning provider choice. Respondents were also asked to describe their current GP and pharmacy on the basis of the attributes used in the DCE.
The second part of the questionnaire consisted of 14 choice scenarios. The first 12 scenarios focus on eliciting patient preferences for the various attributes using choices between three purely hypothetical GPs or pharmacies. These scenarios are followed by two scenarios that focus on the value patients assign to staying with their current GP or pharmacy over and above the value derived from the attributes. They therefore include the patient's current service provider and a hypothetical alternative (i.e., a choice between two alternatives). When using a DCE, the design of the experiment is of utmost importance. We used SAS to generate two efficient designs for the hypothetical 12 choice scenarios. In the technical appendix, a detailed description of the design of the experiment is given. Two examples of a choice scenario are given in Appendix SA1.
Econometric Specification
Economic Framework
We use Lancaster's economic theory of value and random utility theory to examine consumers' willingness to trade off providers with different financial and qualitative attributes (Lancaster 1966, 1971; McFadden 1974; Hanemann 1983; Ryan et al. 2006). This implies that we assume that utility is derived from the properties or characteristics of a good rather than from the good itself. Hence, we describe the decision-making process about pharmacy and GP choice in terms of comparing indirect utility functions. Consumers are assumed to have perfect discrimination capability and to choose the pharmacy/GP that maximizes their utility. We assume that the utility that individual i derives from choosing alternative j on choice occasion t is then given by equation 1,
| (1) |
where Uijt denotes individual i's utility from choice j on choice occasion t, Vijt is the deterministic part that captures both pharmacy and GP characteristics and the (relative) preferences for these characteristics, and ɛijt is the error term that captures the characteristics that are unobservable to the researchers as well as measurement error (Manski 1977).
Empirical Framework
In the empirical models, we estimate consumers' sensitivity to the various pharmacy or GP characteristics and their willingness to pay to visit a pharmacy or GP with these specific characteristics. In the choice scenarios with the current GP or pharmacy, we include the patient's stated values of the GP or pharmacy and add a dummy variable for the current service provider to capture the additional value of staying. To be able to capture the full “status quo bias,” we used effects coding (−1 for the base level and 1 for the other level) to estimate our attributes (Bech and Gyrd-Hansen 2005).
The two sets of choice scenarios, that is, those where a comparison is made between current and hypothetical versus a choice among three hypothetical alternatives, might vary in their complexity. This is likely to affect the degree of choice consistency displayed by patients. Following DeShazo and Fermo (2002) and Louviere et al. (2008), we accommodate this using a scaling factor (λ) for the error in choices with the current service provider.
In the choice decision without the current provider, the labels of the pharmacies and GPs have no meaning; the alternatives only differ in the specified attributes and their location on the screen. During data collection, the alternatives were randomly assigned to one of the three labels and corresponding locations. As a consequence, there will be no relationship between the attributes and the labels. Still, alternative specific constants can be included to control for the presence of possible location effects. In particular, these constants can be interpreted as the difference in average utility between scenario A, B, and C caused by a left/middle/right bias (Scott, Watson, and Ross 2003).
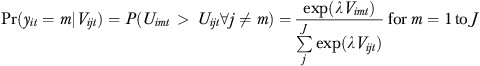
McFadden (1974) shows that if ɛijt is assumed to be type I extreme value and independent, then a logit model can be derived from the random utility model. The parameter estimates of the logit model may be interpreted as parameter estimates of the indirect utility function. For the empirical estimation of the indirect utility model, we used a multinomial logit model.
Each pharmacy and GP in the choice set is composed of a bundle of pharmacy or GP characteristics (X) faced by the i-th individual. Because we observe the choice and not the actual difference in utility, the dependent variable is binary. The conditional probability Pr(yi=m) that individual i in choice occasion t is observed to choose alternative m in each of the first 12 choice sets is given by equation (2),
 |
(2) |
where Vijt=xijtβ and xijt are a vector with choice attributes. For the final two choice sets, involving the current service provider, we allow for a different scale of the error term, as indicated above, resulting in
 |
(3) |
This model is estimated using maximum likelihood. A specification allowing for heterogeneity in the attribute weights (β) across individuals through a normal mixture distribution was estimated, but it turned out not to improve model fit significantly, as was shown by the likelihood ratio test.
The model's parameter estimates are used to compute marginal rates of substitution (based on equation [4]) between each attribute and the price attribute, where we use the impact of a copayment (the negative financial incentive). The marginal rates of substitution represent the willingness to pay for an attribute m, given a marginal change in that attribute (MRSP) (Hanemann 1983). Because we used effects coding for the attributes, the formula for the MRSP is multiplied by 2, with an exception for distance, which is a continuous variable:
| (4) |
To study the effectiveness of the attributes in actually channeling patients to preferred providers, we study their importance in terms of choice shares. The computation of the choice shares will be described in detail in “Results.”
Results
Descriptive Statistics
In total, 1,907 respondents filled in the GP questionnaire, 968 the discount version and 939 the copayment version and 1,875 respondents filled in the pharmacy questionnaire, 952 the discount version and 923 the copayment version. The study population is representative of the adult Dutch population with an average age of 49 years, 48 percent female, 56 percent with a job, and an average net monthly income of about 1,700 euros. Furthermore, over 80 percent indicates to be in good or even excellent health.
The majority of the respondents have a regular GP or pharmacy with a long-term relationship of over 5 years. Moreover, respondents' description of the current GP and pharmacy showed that the majority visit a GP or pharmacy that has no extra features such as extended opening hours or a quality certificate.1 More than 70 percent of the respondents visited a GP and pharmacy last year. This indicates that most respondents have recent experience with visiting a GP and pharmacy. In addition, 44 percent switched between pharmacies and 65 percent between GPs at least once, indicating that most respondents have experience with choosing a new GP or pharmacy. The specific results for the background characteristics of the sample are presented in Appendix SA2.
The answers to the first part of the questionnaire show that consumers are much more aware of quality differences between GPs than between pharmacies. Whereas the majority of the respondents (65 percent) recognize quality differences between GPs, only 26 percent observes quality differences between pharmacies. Preferences for qualitative aspects may therefore play a larger role in choosing a GP than in choosing a pharmacy. In addition, the answers to the general questions show that respondents are more loyal to GPs than to pharmacies. A larger proportion of the respondents are willing to pay a copayment to stick with their current GP (35 percent) than with their current pharmacy (14 percent) and less respondents are willing to switch to another GP (30 percent) than to another pharmacy (40 percent) in return for a financial gain.
Estimation Results
Table 2 reports the results from the estimation results for the pharmacy and GP version of the questionnaire. The estimation results show that the constant terms are significant (for pharmacies, the constant term is only significant for alternative B over alternative C). This could indicate that there might be a left/right bias but because we randomly assigned the alternatives to position A, B, or C, this will not affect our estimates.2 The signs of all coefficients are as expected.
Table 2.
Regression Results for Pharmacy and General Practitioner (GP)
| Pharmacy | GP | |
|---|---|---|
| Distance | −0.0501* | −0.0409* |
| Positive financial incentive | 0.1118* | 0.0623* |
| Negative financial incentive | −0.2107* | −0.1635* |
| Health center | 0.1036* | 0.0464* |
| Primary care center | −0.0588* | −0.0684* |
| Opening hours | 0.2281* | 0.2361* |
| Extended telephone access | — | 0.4386* |
| Meetings on information management | 0.0146** | — |
| Availability of practice assistants | — | 0.1949* |
| Internet service | 0.0955* | 0.1236* |
| Quality certificate | 0.3136* | 0.378* |
| Consumer satisfaction: mediocre | −0.2033* | — |
| Consumer satisfaction: good | 0.6077* | — |
| Consumer satisfaction: excellent | 0.6692* | — |
| Current pharmacy/GP | 1.2354* | 1.4135* |
| ASC1 | −0.017 | 0.0328* |
| ASC2 | −0.0601* | −0.1084* |
| λ | 0.4878* | 0.7659* |
Significant at 1%.
Significant at 10%.
In both the pharmacy and GP version, distance and negative financial incentives are valued negatively by respondents. Positive financial incentives have a positive effect on provider choice. Furthermore, we find that respondents prefer a health center, in which GPs and pharmacies work together in the same building, over a stand-alone practice of GPs or pharmacies. Primary care centers, however, are valued negative with respect to stand-alone practices. The availability of other primary care providers than a pharmacy and GP seems less valuable to respondents. In addition, all qualitative aspects are valued positively by respondents.
The estimated λs are both smaller than one, indicating that choices are not as responsive to changes in the systematic utility component. This is especially the case for pharmacies, suggesting that a consumer's preference for the current pharmacy is to a large extent driven by unobserved factors. In the analyses that follow, we incorporate the estimated scaling effects in all questions that include the current service provider, that is, whenever we analyze the status quo effect.
Marginal Rates of Substitution and Choice Simulations
Table 3 reports the MRSP for contractible aspects of GPs and pharmacies and reports how the various channeling incentives and practice characteristics influence the choice probabilities for GPs and pharmacies. We focus on the MRSP and the impact on choice shares. The MRSP are computed on the basis of the copayment. The impact on choices was simulated by contrasting the choice probability when choosing between two identical products, except for the focal attribute that is present in one and absent in the other, with the choice probability in case the focal attribute is also the same. For distance, we simulated a 10-min decrease in travel time from the home address and for financial incentives a 3-euro increase in out-of-pocket payments. For the other attributes, we simulated the presence versus the absence of each specific attribute.
Table 3.
Willingness to Pay Values and Choice Shares
| Pharmacy | General Practitioner (GP) | |||
|---|---|---|---|---|
| MRS | Choice Probability | MRS | Choice Probability | |
| Distance | −0.24 | 12.3% | −0.25 | 10.10% |
| (−0.31 : −0.16) | (11.9 : 12.7) | (−0.39 : −0.09) | (9.73 : 10.5) | |
| Positive financial incentive | 0.53 | −8.3% | 0.38 | −4.66% |
| (0.49 : 0.57) | (−8.8 : −7.9) | (0.32 : 0.44) | (−5.24 : −4.1) | |
| Negative financial incentive | Reference | −15.3% | Reference | −12.02% |
| — | (−15.7 : −14.9) | — | (−12.54 : −11.5) | |
| Health center | 0.97 | 5.2% | 0.58 | 2.32% |
| (0.71 : 1.22) | (3.8 : 6.6) | (0.29 : 0.88) | (0.95 : 3.7) | |
| Primary care center | −0.56 | −2.9% | −0.86 | −3.42% |
| (−0.83 : −0.3) | (−4.5 : −1.4) | (−1.2 : −0.52) | (−4.7 : −2.1) | |
| Extended opening hours | 2.17 | 11.2% | 2.88 | 11.59% |
| (2.0 : 2.33) | (10.4 : 12.1) | (2.69 : 3.08) | (10.9 : 12.3) | |
| Extended telephone access | — | — | 5.38 | 20.62% |
| — | — | (5.01 : 5.78) | (20.03 : 21.2) | |
| Meetings on medication management | 0.13 | 0.7% | — | — |
| (−0.05 : 0.32) | (−0.4 : 1.8) | — | — | |
| Availability of practice assistants | — | — | 2.38 | 9.62% |
| — | — | (2.19 : 2.57) | (8.7 : 10.5) | |
| Internet service | 0.90 | 4.8% | 1.5 | 6.15% |
| (0.73 : 1.06) | (3.8 : 5.7) | (1.32 : 1.69) | (5.3 : 7.0) | |
| Quality certificate | 2.98 | 15.2% | 4.64 | 18.05% |
| (2.76 : 3.22) | (14.4 : 15.9) | (4.29 : 5.00) | (17.4 : 18.7) | |
| Consumer satisfaction: mediocre | −1.93 | −10.0% | — | — |
| (−2.32 : −1.56) | (−12 : −8) | — | — | |
| Consumer satisfaction: good | 5.77 | 27.1% | — | — |
| (5.29 : 6.33) | (25.6 : 28.5) | — | — | |
| Consumer satisfaction: excellent | 6.36 | 29.2% | — | — |
| (6.01 : 6.75) | (28 : 30.4) | — | — | |
| Current pharmacy/GP | 11.74 | 26.9 | 17.32 | 39.7 |
| (11.14 : 12.36) | (24.8 : 28.9) | (16.24 : 18.48) | (38.6 : 40.7) | |
Qualitative Incentives
The MRSP show that respondents value distance equally in the pharmacy and GP version. Respondents require a compensation of 24 cents per minute extra travel time and are about 10–12 percent more likely to visit a GP or pharmacy that is located 10 minutes closer to their home address. Furthermore, respondents are more willing to pay for qualitative attributes with GPs than with pharmacies and are more willing to switch to GPs with qualitative attributes than to pharmacies. For example, respondents are willing to pay more for a GP with a quality certificate (4.64 euros) than for a pharmacy with a quality certificate (2.98 euros). Consumers are also willing to pay more for Internet services, extended opening hours, and extra services (availability of practice assistants versus extra meetings on medication management) in case of GPs than in case of pharmacies. The differences in MRSP are statistically significant, based on bootstrapped confidence intervals on the mean WTP values obtained from the MNL model (Hole 2007).
When choosing a pharmacy, respondents are quite sensitive to consumer satisfaction ratings. Consumers are between 27 and 29 percent more likely to visit a pharmacy if satisfaction ratings are good to very good instead of reasonable.
Financial Incentives
The positive financial incentives are far less effective than negative financial incentives as shown by the MRSP for the positive financial incentive, which is 0.53 for pharmacies and only 0.38 for GPs. For GPs, a bonus will therefore have to be almost three times as large as a negative financial incentive to have the same impact. The choice simulation also demonstrates that financial incentives have a stronger impact on pharmacy choice than on GP choice. Respondents are 8 percent less likely to visit a pharmacy when the positive financial incentive decreases with 3 euros and 15 percent less likely if the negative financial incentive increases with 3 euros. With GPs, respondents are 4.6 percent less likely in case of a 3-euro decrease in the positive financial incentive and 12 percent less likely if the copayment increases with 3 euros. Financial incentives thus have a smaller impact on GP choice.
To examine the impact of financial incentives, we also simulated different levels of financial incentives for a choice between the current GP or pharmacy and an identical noncurrent alternative.3 Both alternatives have identical attribute levels but differ with respect to the status quo dummy. In the simulation, we choose different levels of out-of-pocket payments for the current provider that vary between 0 and 9 euros.4 The simulation results are illustrated in Figure 1. The dotted lines represent the choice for a GP and the normal lines the choice for a pharmacy.
Figure 1.
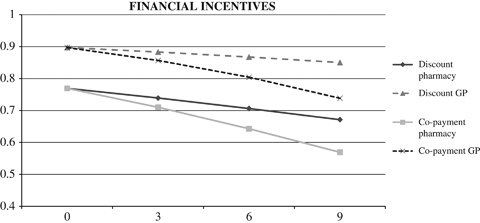
Choice Probabilities for the Current Pharmacy/GP-Given Different Levels of Out-of-Pocket Payments
*The X-axis of the graph shows the net payment consumers have to make to visit the current pharmacy/GP. For the discount version, a copayment of 3 euros is similar to a discount of 6 euros. We thus translated the discount into the corresponding copayment to generate the results in the graph.
Figure 1 shows that for pharmacies the impact of financial incentives is much larger than for GPs. Furthermore, the simulation demonstrates that positive financial incentives have a smaller impact on provider choice than negative financial incentives. Positive financial incentives only have a limited impact on GP choice (a decrease in the probability to choose the current GP from 89 to 85 percent), while similar negative financial incentives have a substantial impact on GP choice (a decrease in the probability to choose the current GP from 89 to 73 percent). For pharmacies, the positive financial incentives have a smaller impact than the negative financial incentives, but both incentives substantially decrease the attractiveness of the current pharmacy (in the discount version a decrease from 77 to 67 percent and in the copayment version a decrease from 77 to 57 percent).
Status Quo Bias
Results also indicate the presence of a considerable status quo bias. Consumers are prepared to pay a substantial amount to stick with their current provider. The willingness to pay for keeping the current GP is 50 percent higher (17.32 euros) than for keeping the current pharmacy (11.74 euros). In terms of positive financial incentives, these translate into bonuses of 45.58 and 20.12 euros, respectively. More important, for both GPs and pharmacies, the value assigned to staying with ones current service provider exceeds the total value assigned to all other attributes. The importance of the status quo bias is also reflected in the computed choice shares. The status quo bias is particularly strong in case of GPs. When people are offered a choice between a current and a hypothetical provider with identical attributes, they are 40 percent-points more likely to choose the current GP than would be the case if both were hypothetical providers, in which case the choice probabilities are 50 percent for both. In other words, introducing a current instead of a hypothetical provider results in a change from a 50–50 percent to a 90–10 percent division of choices between two equal alternatives (see Figure 1). For pharmacies, respondents are 27 percentage points more likely to choose the current pharmacy than the hypothetical alternatives.
Conclusion and Discussion
We examined consumer sensitivity to channeling incentives health insurers can use to influence consumer choice for different types of providers. Although consumer channeling is important in the United States and increasingly relevant in many other countries, little is known about how consumers respond to various channeling incentives for different types of providers.
The most important findings can be summarized as follows: first, negative financial incentives have a two to three times larger impact on provider choice than positive financial incentives. This difference is particularly large in case of GPs, where positive financial incentives show a negligible effect on GP choice. Second, respondents are more aware of and more willing to pay for quality differences between GPs than between pharmacies. Third, we find that many respondents prefer to stick with their current provider even if they have the option to switch to a better alternative (i.e., a provider with higher valued attributes). This status quo bias is much stronger in case of GPs than in case of pharmacies. Consumers require a substantial financial compensation for giving up their current provider. More important, the value of staying with one's current provider exceeds the total value of all other attributes we considered. This suggests that channeling consumers away from their current provider without using financial incentives will be futile.
Moreover, for both types of providers, different channeling incentives appear to be effective. Insurers implementing channeling incentives to influence provider choice should therefore consider the differences in consumer sensitivity to channeling incentives between different providers. For instance, positive financial incentives may well work to motivate consumers to switch to preferred pharmacies, but they are likely to be insufficient to persuade consumers to give up their current GP. On the other hand, qualitative incentives are likely to be more effective in encouraging the use of preferred GPs than preferred pharmacies. In addition, insurers should take the long-term benefits of channeling into account. While influencing GP choice is likely to be more difficult and costly than influencing pharmacy choice, successful channeling toward preferred GPs may have a longer lasting impact on provider choice. Once consumers are persuaded to switch to a preferred GP, they are likely to stay precisely because of the strong status quo bias. Thus, the higher effort of channeling to preferred GPs may be compensated by a more long-term benefit. Moreover, in case GPs function as gatekeepers, the benefits of channeling toward preferred GPs extend beyond the GP to other providers. The difference in status quo bias between the two provider types may also have implications for the targeting and timing of channeling incentives. In the case of pharmacies, insurers may well choose to target channeling incentives to all potential consumers. By contrast, in the case of GPs, channeling incentives are likely to be most effective if they are targeted at people who did not yet register with a GP, for instance, because they recently moved to another area.
There are several limitations to our study. First, we used stated preference designs to estimate consumer sensitivity to channeling incentives. Because no revealed preference data are available, we are not able to compare our stated preferences to revealed preferences. Second, respondents in the Dutch health care system are not familiar with restrictions in provider choice and copayments. This may affect the outcomes of our experiment. Third, differences in health care systems and attitudes between countries may limit the generalizability of our results to other countries. This calls for further research involving similar experiments in other countries.
Acknowledgments
Joint Acknowledgment/Disclosure Statement: The study was supported by a grant (grant number 32570102) of the Netherlands Organization for Health Research and Development (ZonMW), the Hague. The views expressed in this paper are those of the authors and not of the funder. We would like to thank Dennis Scanlon and other participants of the ASHE conference “Equity and Efficiency in Health and Healthcare” in Durham (July 2008) for helpful comments and suggestions. We also thank two anonymous referees for their constructive comments.
Disclosures: None.
Disclaimers: None.
Notes
By describing their current pharmacy and GP, respondents were asked to indicate whether their provider offered specific attributes. Respondents could specify “I don't know,” if they did not know whether their provider offered specific attributes. We recoded these answers to “not having this attribute.” We expect that consumers who are not aware of certain attributes of their current provider will consider their current provider as not having these characteristics when filling in the questionnaire. The proportion of respondents who were not aware of specific attributes of their GP or pharmacy varied between 2 percent (type of practice) and 50 percent (Internet services).
We also estimated a model without the constant term and found no large differences in the results. Furthermore, we only present the results of the main effects. The models including the interaction effects between the attributes and background characteristics and between the attributes and consumers' past experiences with GP and pharmacy care showed only few significant effects. Having a job, for example, was associated with stronger preferences for extended opening hours, while age was associated with a lower preference for Internet services. In addition, interactions with past experiences showed that respondents have stronger preferences for GPs and pharmacies with similar attribute levels as their current GP and pharmacy. We do not present detailed results here because these results do not add to the understanding of the problem. The results are available upon request from the authors.
As this simulation concerns the current service provider, we account for the scaling effects through inclusion of the estimated scaling parameter λ.
In the starting point, both providers face no out-of-pocket payments (no copayment or 9 euro discount). In the simulation, the introduction of a copayment of 3 euro for the current provider is equal to a reduction of the discount from 9 to 6 euro, resulting in out-of-pocket payments of 3 euro.
SUPPORTING INFORMATION
Additional supporting information may be found in the online version of this article:
Appendix SA1: Author Matrix.
Appendix S1: Choice Scenarios between Pharmacies.
Appendix S2: Background Characteristics of the Respondents.
Please note: Wiley-Blackwell is not responsible for the content or functionality of any supporting materials supplied by the authors. Any queries (other than missing material) should be directed to the corresponding author for the article.
References
- Bech M, Gyrd-Hansen D. Effects Coding in Discrete Choice Experiments. Health Economics. 2005;14(10):1079–83. doi: 10.1002/hec.984. [DOI] [PubMed] [Google Scholar]
- Boonen LHHM, Schut FT, Koolman X. Consumer Channeling by Health Insurers: Natural Experiments with Preferred Providers in the Dutch Pharmacy Market. Health Economics. 2008;17(3):299–316. doi: 10.1002/hec.1265. [DOI] [PubMed] [Google Scholar]
- Burgess L, Street DJ. Optimal Designs for 2k Choice Experiments. Communications in Statistics. 2003;32(11):2185–206. [Google Scholar]
- Burgess L, Street DJ. Optimal Designs for Choice Experiments with Asymmetric Attributes. Journal of Statistical Planning and Inference. 2005;134:288–301. [Google Scholar]
- Chu-Weininger MYL, Balkrishnan R. Consumer Satisfaction with Primary Care Provider Choice and Associated Trust. BMC Health Services Research. 2006;6:139. doi: 10.1186/1472-6963-6-139. [DOI] [PMC free article] [PubMed] [Google Scholar]
- DeShazo JR, Fermo G. Designing Choice Sets for Stated Preference Methods: The Effects of Complexity on Choice Consistency. Journal of Environmental Economics and Management. 2002;44(1):123–4. [Google Scholar]
- De Vries T. Sneller Beter. Amsterdam: TNS NIPO; 2006. pp. 1–11. [Google Scholar]
- Enthoven AC, van de Ven WPMM. Going Dutch—Managed-Competition Health Insurance in the Netherlands. New England Journal of Medicine. 2007;357:2421–3. doi: 10.1056/NEJMp078199. [DOI] [PubMed] [Google Scholar]
- Feldman R, Finch M, Dowd B, Cassou S. The Demand for Employment-Based Health Insurance Plans. The Journal of Human Resources. 1989;24(1):115–42. [Google Scholar]
- Garnick DW, Lichtenberg E, Phibbs CS, Luft HS, Peltzman DJ, McPhee SJ. The Sensitivity of Conditional Choice Models for Hospital Care to Estimation Technique. Journal of Health Economics. 1989;8(4):377–97. doi: 10.1016/0167-6296(90)90022-u. [DOI] [PubMed] [Google Scholar]
- Gawande AA, Blendon R, Brodie M, Benson JM, Levitt L, Hugick L. Does Dissatisfaction with Health Plans Stem from Having No Choices? Health Affairs (Millwood) 1998;17(5):184–94. doi: 10.1377/hlthaff.17.5.184. [DOI] [PubMed] [Google Scholar]
- Glied S. Managed Care. In: Culyer AJ, Newhouse JP, editors. Handbook of Health Economics. Amsterdam: Elsevier; 2000. pp. 707–53. [Google Scholar]
- Hanemann W. Marginal Welfare Measures for Discrete Choice Models. Economics Letters. 1983;13:129–36. [Google Scholar]
- Hole AR. A Comparison of Approaches to Estimating Confidence Intervals for Willingness to Pay Measures. Health Economics. 2007;16(8):827–40. doi: 10.1002/hec.1197. [DOI] [PubMed] [Google Scholar]
- Hole AR. Modeling Heterogeneity in Patients' Preferences for the Attributes of a General Practitioner Appointment. Journal of Health Economics. 2008;27(4):1078–94. doi: 10.1016/j.jhealeco.2007.11.006. [DOI] [PubMed] [Google Scholar]
- Huber J, Zwerina K. The Importance of Utility Balance in Efficient Choice Designs. Journal of Marketing Research. 1996;33(3):307–17. [Google Scholar]
- Kahneman D, Knetsch JL, Thaler RH. The Endowment Effect, Loss Aversion and Status Quo Bias. Journal of Economic Perspectives. 1991;5(1):193–206. [Google Scholar]
- Kim BR. A Logit Analysis of Hospital Choice Behavior in Chollabukdo Province of Korea. Social Science & Medicine. 1990;30(10):1119–29. doi: 10.1016/0277-9536(90)90298-7. [DOI] [PubMed] [Google Scholar]
- Kjaer T, Bech M, Gyrd-Hansen D, Hart-Hansen K. Ordering Effect and Price Sensitivity in Discrete Choice Experiments: Need We Worry? Health Economics. 2006;15(11):1217–28. doi: 10.1002/hec.1117. [DOI] [PubMed] [Google Scholar]
- Lancaster K. A New Approach to Consumer Theory. Journal of Political Economy. 1966;74(2):132–57. [Google Scholar]
- Lancaster K. Consumers Demand a New Approach. New York: Columbia University Press; 1971. [Google Scholar]
- Lancsar E. 2002. Deriving Welfare Measures from Stated Preference Discrete Choice Modelling Experiments. CHERE Discussion Paper No 48. Sydney: Center for Health Economics Research and Evaluation.
- Lems S. De huisarts-patiënt relatie anno 2006. Amsterdam: TNS NIPO; 2006. [Google Scholar]
- Longo MF, Cohen DR, Hood K, Edwards A, Robling M, Elwyn G, Russell IT. Involving Patients in Primary Care Consultations: Assessing Preferences Using Discrete Choice Experiments. British Journal of General Practice. 2006;56(522):35–42. [PMC free article] [PubMed] [Google Scholar]
- Louviere JJ, Islam T, Wasi N, Street D, Burgess L. Designing Discrete Choice Experiments: Do Optimal Designs Come at a Price? Journal of Consumer Research. 2008;35(2):360–75. [Google Scholar]
- Manski CF. The Structure of Random Utility Models. Theory and Decision. 1977;8:229–54. [Google Scholar]
- Mark MP. The General Pharmacy Work Explored in the Netherlands. Pharmacy World & Science. 2008;30(4):353–9. doi: 10.1007/s11096-007-9186-z. [DOI] [PMC free article] [PubMed] [Google Scholar]
- McFadden D. Conditional Logit Analysis of Qualitative Choice Behavior. In: Zarembka P, editor. Frontiers in Econometrics. New York: Academic Press; 1974. pp. 105–42. [Google Scholar]
- Melnick GA, Zwanziger J, Bamezai A, Pattison R. The Effects of Market Structure and Bargaining Position on Hospital Prices. Journal of Health Economics. 1992;11(3):217–33. doi: 10.1016/0167-6296(92)90001-h. [DOI] [PubMed] [Google Scholar]
- Miller NH. Insurer-Provider Integration, Credible Commitment, and Managed-Care Backlash. Journal of Health Economics. 2006;25(5):861–76. doi: 10.1016/j.jhealeco.2005.12.007. [DOI] [PubMed] [Google Scholar]
- Neipp J, Zeckhauser R. Persistence in the Choice of Health Plans. Advances in Health Economics and Health Services Research. 1985;6:47–72. [PubMed] [Google Scholar]
- Pauly MV. Monopsony Power in Health Insurance: Thinking Straight While Standing on Your Head. Journal of Health Economics. 1987;6(1):73–81. doi: 10.1016/0167-6296(87)90032-4. [DOI] [PubMed] [Google Scholar]
- Rubin G, Bate A, George A, Shackley P, Hall N. Preferences for Access to the GP: A Discrete Choice Experiment. British Journal of General Practice. 2006;56:743–8. [PMC free article] [PubMed] [Google Scholar]
- RVZ. Kiezen in de gezondheidszorg Raad voor de Volksgezondheid en Zorg. Zoetermeer, The Netherlands: TNS NIPO; 2003. [Google Scholar]
- Ryan M, Netten A, Skatun D, Smith P. Using Discrete Choice Experiments to Estimate a Preference-Based Measure of Outcome—An Application to Social Care for Older People. Journal of Health Economics. 2006;25(5):927–44. doi: 10.1016/j.jhealeco.2006.01.001. [DOI] [PubMed] [Google Scholar]
- Samuelson W, Zeckhauser R. Status Quo Bias in Decision Making. Journal of Risk and Uncertainty. 1988;1:7–59. [Google Scholar]
- Scott A, Watson MS, Ross S. Eliciting Preferences of the Community for Out of Hours Care Provided by General Practitioners: A Stated Preference Discrete Choice Experiment. Social Science & Medicine. 2003;56:803–14. doi: 10.1016/s0277-9536(02)00079-5. [DOI] [PubMed] [Google Scholar]
- Sorensen AT. Insurer-Hospital Bargaining: Negotiated Discounts in Post-Deregulation Connecticut. The Journal of Industrial Economics. 2003;51(4):469–90. [Google Scholar]
- Staten M, Dunkelberg W, Umbeck J. Market Share and the Illusion of Power. Can Blue Cross Force Hospitals to Discount? Journal of Health Economics. 1987;6(1):43–58. doi: 10.1016/0167-6296(87)90030-0. [DOI] [PubMed] [Google Scholar]
- Street DJ, Burgess L, Louviere JJ. Quick and Easy Choice Sets: Constructing Optimal and Nearly Optimal Stated Choice Experiments. International Journal of Research in Marketing. 2005;22:459–70. [Google Scholar]
- Strombom BA, Buchmueller TC, Feldstein PJ. Switching Costs, Price Sensitivity and Health Plan Choice. Journal of Health Economics. 2002;21(1):89–116. doi: 10.1016/s0167-6296(01)00124-2. [DOI] [PubMed] [Google Scholar]
- Tai WT, Porell FW, Adams EK. Hospital Choice of Rural Medicare Beneficiaries: Patient, Hospital Attributes, and the Patient–Physician Relationship. Health Services Research. 2004;39(6):1903–22. doi: 10.1111/j.1475-6773.2004.00324.x. [DOI] [PMC free article] [PubMed] [Google Scholar]
- Tversky A, Kahneman D. Loss Aversion in Riskless Choice: A Reference-Dependent Model. Quarterly Journal of Economics. 1991;106(4):1039–61. [Google Scholar]
- Van de Ven WPMM, Schut FT. Universal Mandatory Health Insurance in the Netherlands: A Model for the United States? Health Affairs. 2008;27(3):771–8. doi: 10.1377/hlthaff.27.3.771. [DOI] [PubMed] [Google Scholar]
- Vick S, Scott A. Agency in Health Care. Examining Patients' Preferences for Attributes of the Doctor–Patient Relationship. Journal of Health Economics. 1998;17(5):587–605. doi: 10.1016/s0167-6296(97)00035-0. [DOI] [PubMed] [Google Scholar]
- Wu VY. Managed Care's Price Bargaining with Hospitals. Journal of Health Economics. 2008;28(2):350–6. doi: 10.1016/j.jhealeco.2008.11.001. [DOI] [PubMed] [Google Scholar]
- Zweifel P, Manning WG. Moral Hazard and Consumer Incentives in Health Care. In: Culyer AJ, Newhouse JP, editors. Handbook of Health Economics. Amsterdam: Elsevier; 2000. pp. 410–59. [Google Scholar]
Associated Data
This section collects any data citations, data availability statements, or supplementary materials included in this article.