

Abstract
Objective
To assess the performance characteristics of the Institute for Healthcare Improvement Global Trigger Tool (GTT) to determine its reliability for tracking local and national adverse event rates.
Data Sources
Primary data from 2008 chart reviews.
Study Design
A retrospective study in a stratified random sample of 10 North Carolina hospitals. Hospital-based (internal) and contract research organization–hired (external) reviewers used the GTT to identify adverse events in the same 10 randomly selected medical records per hospital in each quarter from January 2002 through December 2007.
Data Collection/Extraction
Interrater and intrarater reliability was assessed using κ statistics on 10 percent and 5 percent, respectively, of selected medical records. Additionally, experienced GTT users reviewed 10 percent of records to calculate internal and external teams' sensitivity and specificity.
Principal Findings
Eighty-eight to 98 percent of the targeted 2,400 medical records were reviewed. The reliability of the GTT to detect the presence, number, and severity of adverse events varied from κ=0.40 to 0.60. When compared with a team of experienced reviewers, the internal teams' sensitivity (49 percent) and specificity (94 percent) exceeded the external teams' (34 and 93 percent), as did their performance on all other metrics.
Conclusions
The high specificity, moderate sensitivity, and favorable interrater and intrarater reliability of the GTT make it appropriate for tracking local and national adverse event rates. The strong performance of hospital-based reviewers supports their use in future studies.
Keywords: Patient safety, adverse event assessment, global trigger tool
Despite extensive documentation of risk to hospitalized patients (Kohn, Corrigan, and Donaldson 2000; Leape and Berwick 2005; Joint Commission on the Accreditation of Healthcare Organizations 2009; Ornstein 2007;) and substantial efforts to improve in-hospital patient safety (Milstein et al. 2000; Berwick et al. 2006; Catalano 2006; McCannon, Hackbarth, and Griffin 2007; Vemula, Robyn Assaf, and Al-Assaf 2007; Jha et al. 2008), progress in this area has been slow (Leape and Berwick 2005; Vincent et al. 2008;). Indeed, recent studies suggest that adverse events due to hospital care remain common (Rozich, Haraden, and Resar 2003; Resar et al. 2006; Sharek et al. 2006; Griffin and Classen 2008; Takata et al. 2008;). Assessment of the impact of large-scale patient safety initiatives requires generally accepted, rigorous, standardized, and practical measures of adverse events (Leape and Berwick 2005; Vincent et al. 2008;). Such measures are also necessary for individual hospitals to assess their own adverse event rates, as well as the results of their improvement efforts.
A number of approaches to measuring adverse event rates have been used historically, including voluntary reports (“incident reports”), mining of administrative databases, and the two-stage review process used in the Harvard Medical Practice Study (Brennan, Localio, and Laird 1989; Brennan et al. 1991; Thomas et al. 2002; Sharek and Classen 2006;). Each of these methods has limitations. The “trigger tool” approach to measuring adverse event rates, by guiding chart reviewers to specific times and events during a patient's hospitalization more likely to contain an adverse event, appears to provide a more efficient and focused variation on retrospective chart reviews and may overcome many of these limitations (Rozich, Haraden, and Resar 2003; Resar et al. 2006; Sharek and Classen 2006; Sharek et al. 2006; Griffin and Classen 2008; Takata et al. 2008; Office of the Inspector General March 2010;). Abnormal laboratory results, prescriptions for antidote medications, and other medical record-based “hints” can all serve to “trigger” the suggestion that an adverse event might have occurred, and that a more thorough review of the medical record is indicated. The Institute for Healthcare Improvement's (IHI's) Global Trigger Tool (GTT) is a single, comprehensive, operationalized, and well-described tool (Table 1; Griffin and Resar 2007) currently used by a number of hospitals in the United States and abroad (Classen et al. 2008) for executive and medical leadership to determine the level of safety in their organization and if improvement has occurred over time. We have performed the current study to provide further data on the performance characteristics, practicality, and generalizability of the GTT to evaluate its potential for tracking adverse events rates at institutional, as well as regional and national levels. This study adds to the present trigger tool literature by tracking adverse events over a 6-year time span, involving a large random sample of eligible patients hospitalized in North Carolina, and comparing hospital-based versus externally hired chart review teams.
Table 1.
Triggers Included in the Institute for Healthcare Improvement Global Trigger Tool
| Care module triggers | Medication module triggers | ||
| C1 | Transfusion or use of blood products | M1 | Clostridium difficile positive culture |
| C2 | Any code or arrest | M2 | Partial thromboplastin time >100 seconds |
| C3 | Dialysis | M3 | International Normalized Ratio (INR) >6 |
| C4 | Positive blood culture | M4 | Glucose <50 mg/dL |
| C5 | X-ray or Doppler studies for emboli | M5 | Rising BUN or serum creatinine >2 times baseline |
| C6 | Abrupt drop of >25% in hemoglobin or hematocrit | M6 | Vitamin K administration |
| C7 | Patient fall | M7 | Benadryl (Diphenhydramine) use |
| C8 | Pressure ulcers | M8 | Romazicon (Flumazenil) use |
| C9 | Readmission within 30 days | M9 | Narcan (Naloxone) use |
| C10 | Restraint use | M10 | Antiemetic use |
| C11 | Health care–associated infection of any kind | M11 | Oversedation/hypotension |
| C12 | In-hospital stroke | M12 | Abrupt medication stop |
| C13 | Transfer to higher level of care | M13 | Other |
| C14 | Any procedure complication | Intensive care module triggers | |
| C15 | Other | I1 | Pneumonia onset |
| Surgical module triggers | I2 | Readmission to intensive care | |
| S1 | Return to surgery | I3 | In-unit procedure |
| S2 | Change in procedure | I4 | Intubation/reintubation |
| S3 | Admission to intensive care postop | Perinatal module triggers | |
| S4 | Intubation/reintubation/BiPap in Post-Anesthesia Care Unit (PACU) | P1 | Apgar score <7 at 5 minutes |
| S5 | X-ray intraop or in PACU | P2 | Maternal/neonatal transport/transfer |
| S6 | Intraop or postop death | P3 | Magnesium sulfate or terbutaline use |
| S7 | Mechanical ventilation >24 hours postop | P4 | Third- or fourth-degree laceration |
| S8 | Intraop epinephrine, or norepinephrine | P5 | Induction of delivery |
| S9 | Postop troponin level >1.5 ng/mL | Emergency department (ED) module triggers | |
| S10 | Change of anesthetic during surgery | E1 | Readmission to ED within 48 hours |
| S11 | Consult requested in PACU | E2 | Time in ED greater than 6 hours |
| S12 | Pathology report normal or unrelated to diagnosis | ||
| S13 | Insertion of arterial or central venous line during surgery | ||
| S14 | Operative time greater than 6 hours | ||
| S15 | Removal/injury or repair of organ | ||
The current report presents the results of a study of the GTT in a representative stratified random sample of 10 hospitals in North Carolina. This study had two principal aims: (1) to determine the performance characteristics (including reliability, sensitivity, and specificity) of the GTT and (2) to compare the medical record abstraction performance of internal hospital-selected reviewers with similarly trained external reviewers selected and supervised by a contract research organization (CRO).
METHODS
To determine the performance characteristics of the GTT, we conducted a retrospective chart review study in 10 stratified, randomly selected hospitals in North Carolina. A CRO (Battelle Centers for Public Health Research and Evaluation, Durham, NC, U.S.A.) was contracted to oversee most study logistics, including hiring and supervising the external reviewers, providing database and analytical support, managing all study-related data, and producing the initial analyses. Institutional review board (IRB) approval was obtained for the entire study using the IRB infrastructure at Battelle, and locally by participating hospitals.
An independent scientific advisory group (SAG) discussed, reviewed, and recommended the study methodology and protocol before study initiation, and adjudicated protocol modifications during the study. The SAG included patient safety experts, health services researchers, statisticians, caregivers, and health care administrators.
Participants
Hospitals were eligible if they were identified in the American Hospital Association (AHA) database (AHA Hospital Survey 2004) as an acute care hospital in North Carolina caring for adult inpatients. We limited the potential sample pool to North Carolina hospitals to reduce project travel costs and logistical complexity. Hospitals caring exclusively for pediatric, rehabilitation, psychiatric, or nonacute patients were excluded. Of the 167 North Carolina hospitals in the starting pool, 14 were ultimately removed: 11 because of missing data and 3 because the facility had closed. Based on current Healthcare Cost and Utilization Project (HCUP) National Inpatient Sample (NIS) definitions (Agency for Healthcare Research and Quality 2009), all remaining hospitals in the sample pool were assigned to one of nine categories based on teaching/urban/rural status (“rural,”“urban nonteaching,”“urban teaching”) and bed size (“small,”“medium,”“large”). Using the 2000 NIS dataset, the shares of total national discharges associated with each of these nine categories were calculated (e.g., 26 percent of national discharges that year occurred in large urban nonteaching hospitals) and the appropriate number of sample hospitals from each category, rounded as necessary, were randomly selected. Same category replacements were preselected randomly as well. The chief executive officers of these selected hospitals were notified first by the North Carolina Hospital Association, followed by a letter and conference call from the study investigators and members of the North Carolina Center for Hospital Quality and Patient Safety, and asked to participate. Once committed, each hospital was provided a U.S.$10,000 stipend to support its involvement. If a hospital declined participation, another hospital from the appropriate stratum was randomly selected and the recruitment process was reinitiated as described above.
Patients' retrospective records were eligible for selection if they were admitted for a minimum of 24 hours to one of the selected hospitals and discharged between January 1, 2002 and December 31, 2007. Patients were excluded if they were <18 years of age on admission or admitted with the primary diagnosis related to psychiatric illness or rehabilitation. Ten eligible patients were randomly selected for each calendar year quarter from each of the 10 participating hospitals, providing a total of 240 charts per hospital or 2,400 total charts over the 6-year study time frame. An intentional 20 percent random oversampling provided two extra charts per quarter eligible for review if any of the 10 identified charts were not available. Random study identification numbers were assigned to each chart selected, and neither names nor medical record numbers were abstracted to ensure patient confidentiality.
Reviewers
On committing to participate, each hospital identified between two and four primary and exactly two physician reviewers from its staff who were interested in participating as “internal reviewers.” Primary reviewers were nonphysician clinical personnel (nurses or clinical pharmacists) with experience reviewing patient records at their institution. They were required to have sufficient clinical experience to navigate the record quickly, understand the trigger definitions, and link the triggers to potential adverse events. Physician reviewers were actively practicing clinical medicine and were recruited primarily from the target group of chief patient safety officers, medical directors of quality, or the physicians overseeing peer review. Eight primary and two physician reviewers, with similar characteristics though unaffiliated with the 10 selected hospitals, were hired independently as “external reviewers” by the CRO. Finally, four primary and two physician reviewers comprised the “experienced reviewers.”
Training
In accordance with GTT methods (Griffin and Resar 2007), training of all primary and physician reviewers for both internal and external review teams included the following:
Orientation: Reviewers read the IHI GTT white paper (Griffin and Resar 2007) and participated in a 1-hour web-based review with IHI faculty with extensive experience using the GTT (F. G., R. R.).
Review of standardized set of training medical records: Nonphysician reviewers then reviewed 10 sample Health Insurance Portability and Accountability Act (HIPAA)-compliant training patient records (designed to cover a broad range of triggers and adverse events), as described below. Physician reviewers reviewed a random selection of 5 of the 10 training patient records. Reviewers documented the triggers and adverse events identified in each training record and graded the severity of each adverse event. Each trainee then participated in a 1-hour web-based training session with IHI faculty (F. G., R. R.) to debrief the results of their record reviews, focusing on the cause and remediation of errors in trigger and adverse event identification and classification. Faculty answered questions related to the record review process and reviewed frequently asked questions from previous training sessions.
Review of site-specific hospital medical records: Internal review teams then reviewed 10 inpatient records from their own organizations. Nonphysician reviewers conducted the initial primary record review looking through the chart for the occurrence of any of the triggers listed on the GTT to guide them to potential adverse events. Suspected adverse events, either associated with a trigger or identified by other means, were then reported to their physician reviewers for physician review. External review teams conducted a similar review on 10 patient records from the first hospital to which they were assigned. All trainees, internal and external, participated in a final 1-hour conference call to review the findings from these individual hospital record reviews.
In addition to the GTT training process, training on the web application and data collection instruments was conducted by the CRO via a webinar.
Data Collection
External and internal review teams performed a two-stage review of the same 2,400 patient records: One nonphysician reviewer conducted a primary review (Stage 1), and if this primary reviewer suspected an adverse event, then two physician reviewers independently performed the secondary, definitive review (Stage 2, Figure 1). Based on previous experience using the GTT, each chart was estimated to require approximately 20 minutes for primary review, beyond which few additional triggers and adverse events would be detected. Accordingly, the protocol specified that primary reviewers would not spend more than 20 minutes reviewing any individual medical record. The depth of electronic medical record penetration varied across the 10 study sites; electronic and paper records were reviewed using the same standard methodology across all sites.
Figure 1.
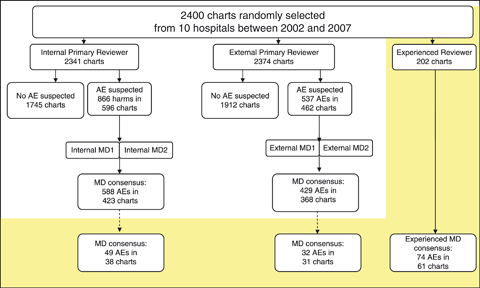
Description and Number of Medical Record Reviews, by Reviewer Type (AE, Adverse Event)
Stage 1
In Stage 1, the primary reviewer (external and internal teams) reviewed the chart in the following order:
Coding summary (looking for e-codes and obvious events)
Discharge summary
Lab results
Medication administration record
Orders
Radiology reports
Procedure notes
Nursing/multidisciplinary notes
For each record reviewed, the primary reviewer completed an electronic “chart review” form on a secure encrypted website. This form was used to record demographic information on the patient and initial information on any triggers or adverse events identified. For each “suspected” adverse event identified, the primary reviewer completed an “adverse event” electronic form, including study ID, patient demographic data, adverse event date, hospital location where the adverse event occurred (including before admission), primary hospital service when the adverse event occurred, free text description of the adverse event, determination whether the adverse event was identified by a GTT trigger, severity level of the adverse event, immediate response to the adverse event, category of the adverse event, and a specific adverse event code.
Stage 2
In Stage 2 (external and internal review teams), each suspected adverse event was presented verbally by the primary reviewer to the two physician reviewers. Each physician reviewer then independently completed a “physician reviewer classification form.” Components of this form included the following: determination (yes/no) of whether each individual suspected adverse event was an actual adverse event, determination of the total number of adverse events based on the sum of all physician confirmed adverse events, adverse event severity level (level E-I, Table 2), and adverse event preventability assessment (definitely preventable, probably preventable, probably not preventable, and definitely not preventable). The determination of preventability was subjective, consistent with previous studies using the implicit review methods of the trigger tool process (Sharek et al. 2006; Takata et al. 2008;). After independent physician review of each event, the two physician reviewers reached consensus for each of the listed adverse events. One of the two physician reviewers then completed the second half of the “physician reviewer classification form,” listing final consensus regarding adverse event, severity level, and preventability.
Table 2.
Severity Categories of Adverse Events Based on the System Used for Classifying Medication Errors by the National Coordinating Council for Medication Error Reporting and Prevention (National Coordinating Council for Medication Error Reporting and Prevention 2001)
| Category E: | contributed to or resulted in temporary harm to the patient and required intervention |
| Category F: | contributed to or resulted in temporary harm to the patient and required initial or prolonged hospitalization |
| Category G: | contributed to or resulted in permanent patient harm |
| Category H: | required intervention to sustain life |
| Category I: | contributed to or resulted in the patient's death |
Assessing the Quality of Documentation
In each study hospital, the quality of documentation was assessed for one randomly selected record from each quarter (10 percent sample; 240 records total) by the primary reviewer from the external review team. The quality of documentation within the entire medical record was measured by a subjective rating of “available,”“not available,” or “not applicable” for each of the following components: (1) initial medical assessment, (2) medical progress notes, (3) nursing progress notes, (4) procedure documentation, (5) pathology reports, (6) discharge summary, and (7) “other” (representing any other critical documentation not listed above identified by the reviewer). The summary score of “percent of charts with zero required components missing” was then determined. Similarly a summary score of percent of charts with 1, 2, 3, 4, 5, 6, or 7 required components missing was calculated.
PERFORMANCE CHARACTERISTICS
To assess the reliability of the GTT, we compared levels of agreement between several individuals and groups. Our chart review was completed in the following way:
Two types of individual reviewers (primary nonphysician screeners, physicians)
Organized into teams (one primary screener with two physician reviewers)
With three different team types (internal, external, and experienced)
We identified levels of agreement by calculating the following κs:
Between individual reviewers within each team
Between teams of the same team type
Between teams of different team types
Interrater reliability (between individual reviewers within each team): To examine interrater reliability between the individual reviewers within each team, agreement between the following reviewer types was assessed with κ statistics using the same 24 randomly selected charts: (1) physician reviewers versus primary reviewers for adverse event severity and (2) physician reviewer #1 versus #2 regarding “any adverse event occurred,”“total number of adverse events,”“adverse event severity,” and “preventability” (definitely preventable, probably preventable, probably not preventable, and definitely not preventable).
Interrater reliability (between teams of the same type): Similarly, for both the internal and external team types, we assessed agreement of the initial review with a second full review by a distinct team of the same type (an independent external team for external team reviews, and an independent internal team for internal team reviews). This comparison was carried out on a random selection of 10 percent (24 charts) of each hospital's 240 selected records. The same 24 charts were used for both the external and internal review teams. Agreement between teams of the same type in detecting adverse events was measured using κ statistics (Landis and Koch 1977).
Reliability between teams of different types: Comparisons for number of adverse events suspected, number of adverse events confirmed, and consensus adverse event severity were evaluated between teams of different types (external and internal) using κ statistics (Landis and Koch 1977).
Comparison of external and internal review teams to an experienced review team: Primary reviewers and physician reviewers experienced and skilled in the use of the GTT served as a third review team for further evaluating the reliability of the external and internal review processes. For that purpose, one of four experienced primary reviewers (F. G., N. K., M. M., and D. R.) and two experienced physician reviewers (R. R., L. A.) reviewed a 10-percent random sample (n=24) of study records in each hospital adhering to the same methods used by the internal and external review teams. Specifically, an experienced primary reviewer reviewed all charts using the GTT for potential adverse events and then presented these potential adverse events to the experienced physician reviewers who confirmed or rejected each adverse event. Sensitivity and specificity were determined based on the outcome of “patient with 1 or more adverse events” for both internal and external review teams using their first review of those specific charts as compared with the experienced review team.
Intrarater reliability (between primary reviewers): Finally, to examine the reliability of individual reviewers over time, we assessed agreement at the level of the primary reviewers by conducting a rereview of the first 5 percent of medical records (12 records) at each site. The original primary reviewer (internal and external) of the selected charts rereviewed each selected chart and extracted all relevant information in the same manner as previously. κ statistics (Landis and Koch 1977) were used to assess the levels of agreement between the first review and the rereview with regard to total number of adverse events.
Statistical Methods
Power
With two groups of reviewers, internal and external, each reviewing 2,400 charts, and an anticipated rate of 40 adverse events per 100 admissions based on data previously obtained using the GTT (McCannon, Hackbarth, and Griffin 2007), we anticipated 89 percent power to detect a 10 percent difference in rates of adverse events detected between the two reviewer groups with a .05 significance level. A random sample of 240 (10 percent) of the 2,400 charts was also reviewed by the experienced review team. This was anticipated to provide 80 percent power to detect a 33 percent difference in rates of adverse events detected between the internal and external reviewers and the experienced review team with a .05 significance level.
Kappas (κ)
Simple κs, and when considering multiple categories weighted κs (using Fleiss–Cohen κ weights; Fleiss and Cohen 1973), with 95 percent confidence intervals (CIs) were calculated using SAS software (SAS Institute, Inc., Cary, NC).
RESULTS
Participants
Hospitals
Based on AHA descriptors, our stratified random sample of 10 hospitals had the following characteristics: medium rural nonteaching (1), large rural nonteaching (1), medium urban nonteaching (1), large urban nonteaching (3), small urban nonteaching (1), and large urban teaching (3). Of the ten hospitals initially contacted, three declined to participate due to resource constraints, and one declined for unspecified reasons. Although not ideal, a 60 percent participation rate is reasonable given the demands on participating institutions and their internal reviewers to meet the requirements of this comprehensive study. Replacement hospitals were then contacted to fill those slots, with all four replacement hospitals agreeing to participate.
Patients
The total number of reviews included the following: (1) 2,400 total medical charts for review, (2) 240 charts for interrater reviews, and (3) 120 charts for intrarater reviews. The actual reviews completed for each of the relevant categories were 2,341, 212, and 108 for the internal review teams, and 2,374, 217, and 117 for the external review teams, respectively. Of the 240 targeted experienced review team charts, 202 were completed. Thus, in total, 98 percent of targeted primary chart reviews, 89 percent of interrater reliability reviews, 94 percent of intrarater reliability reviews, and 88 percent of experienced review team reviews were completed. Demographic characteristics of the study patients are described in Table 3.
Table 3.
Patient Characteristics by External and Internal Review Teams
| Internal Total Number (%) | External Total Number (%) | |
|---|---|---|
| Gender | ||
| Male | 857 (37) | 874 (37) |
| Female | 1,484 (63) | 1,500 (63) |
| Age | ||
| 65+ | 1,008 (43) | 1,037 (44) |
| <65 | 1,333 (57) | 1,337 (56) |
| Race | ||
| Black | 445 (19) | 454 (19) |
| White | 1,631 (70) | 1,692 (71) |
| Other and unknown | 265 (11) | 228 (10) |
| Length of stay (days) | ||
| 1 | 262 (11) | 271 (11) |
| 2–7 | 1,743 (74) | 1,777 (75) |
| 8–14 | 237 (10) | 242 (10) |
| 15+ | 99 (4) | 84 (4) |
| Admitted to an intensive care unit | ||
| Yes | 96 (4) | 49 (2) |
| No | 2,245 (96) | 2,325 (98) |
| Surgery | ||
| Yes | 466 (20) | 454 (19) |
| No | 1,875 (80) | 1,920 (81) |
| Obstetrics/Gynecology | ||
| Yes | 341 (15) | 312 (13) |
| No | 2,000 (85) | 2,062 (87) |
| Insurance | ||
| Private | 1,169 (50) | 1,282 (54) |
| Public | 968 (41) | 885 (37) |
| All others | 204 (9) | 207 (9) |
| Total | 2,341 | 2,374 |
Training
All primary and physician reviewers involved in the study completed the GTT training.
Intervention
Quality of Documentation
Of the 240 charts randomly selected, the external primary reviewers scored 87 percent as having no missing relevant documentation. An additional 9.2 percent of charts were scored as missing only one component, and 3.4 percent were missing two components. Only one chart (0.4 percent) was rated as missing more than two relevant components of documentation.
Interrater and Intrarater Reliability
The weighted κs with 95 percent CIs for all tested comparisons between internal reviewers and between external reviewers are depicted in Figure 2. The range of these weighted κs places them in the categories of “moderate” to “almost perfect” agreement between reviewers (Landis and Koch 1977). Of particular note is that the internal teams' κs were uniformly higher than the external teams'.
Figure 2.
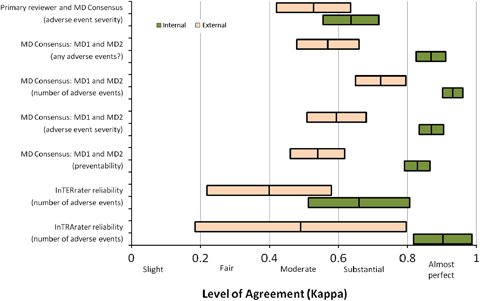
Level of Agreement within the Internal and External Reviewer Teams Using the Same Subjects
Note. Each bar shown is centered on the weighted κ estimate and extends to illustrate the associated 95 percent confidence interval.
Intergroup Comparisons (Internal versus External Reviewers)
The external primary reviewers identified 537 suspected adverse events (2,374 charts reviewed), of which 429 (79.9 percent) were confirmed by external MD consensus for an overall adverse event rate of 18.1 per 100 patients (95 percent CI: 16.4, 19.9). Internal reviewers identified 866 suspected adverse events (2,341 charts reviewed), of which 588 (67.9 percent) were confirmed by internal MD consensus, resulting in an overall internal review team adverse event rate of 25.1 per 100 patients (95 percent CI: 23.1, 27.2) (Table 4; Figure 1). Using a random effects Poisson regression model, with number of adverse events as the outcome, this represents an increase in the relative detection rate of adverse events between the internal and external review team of 1.37 (95 percent CI: 1.23, 1.53). This difference did not vary significantly over time (interaction term for reviewer type and year explained an additional model deviance of 0.37, 5df, p=.996), indicating no evidence of instability in the detection rate over time between the internal and external reviewers. The agreement between internal reviewer teams and external reviewer teams for number of adverse events suspected (n=2,336 charts), number of adverse events confirmed (n=2,336 charts), and adverse event severity (n=276 charts) was moderate (Landis and Koch 1977; Figure 3).
Table 4.
Number of Suspected and Confirmed Adverse Events, along with Severity of Confirmed Adverse Events, by Review Team Type
| Severity of Harm | |||||||
|---|---|---|---|---|---|---|---|
| Suspected | Confirmed | E | F | G | H | I | |
| Internal | |||||||
| Number of adverse events (rate) | 866 | 588 (25.12) | 246 (10.51) | 258 (11.02) | 18 (0.77) | 52 (2.22) | 14 (0.6) |
| Charts with one or more adverse events (%) | 596 | 423 (18.07) | 192 (8.2) | 223 (9.53) | 14 (0.6) | 40 (1.71) | 9 (0.38) |
| External | |||||||
| Number of adverse events (rate) | 537 | 429 (18.07) | 119 (5.01) | 264 (11.12) | 11 (0.46) | 26 (1.1) | 9 (0.38) |
| Charts with one or more adverse events (%) | 462 | 368 (15.5) | 110 (4.63) | 249 (10.49) | 11 (0.46) | 24 (1.01) | 8 (0.34) |
| Internal and external | |||||||
| Number of adverse events (rate) | 1,105 | 787 (32.96) | 327 (13.69) | 421 (17.63) | 27 (1.13) | 67 (2.81) | 19 (0.8) |
| Charts with one or more adverse events (%) | 781 | 583 (24.41) | 266 (11.14) | 374 (15.66) | 23 (0.96) | 54 (2.26) | 13 (0.54) |
Figure 3.
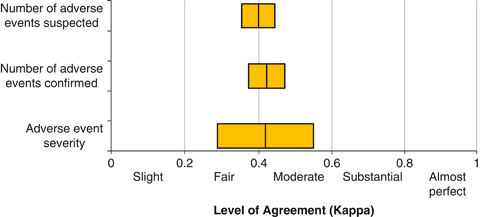
Level of Agreement between the Internal and External Reviewer Teams
Comparing Internal and External Review Teams to the Experienced Review Team
Of the 24 randomly selected charts targeted for experienced team review in each of the 10 hospitals, 202 total charts were ultimately reviewed by all three teams (internal, external, and experienced). Of these 202 charts, the experienced review team identified 30.2 percent of patients as having one or more adverse events, while the external team identified one or more adverse events in 15.3 percent and the internal review team in 18.8 percent. The total number of adverse events identified in these 202 charts by the experienced team was 74 (rate 36.6 per 100 patients), while the external team identified 32 (rate 15.8 per 100 patients), and the internal team identified 49 (rate 24.3 per 100 patients). Using a random effects Poisson regression model, with number of adverse events as the outcome, compared with the experienced team, the relative detection rate of the internal and external review teams was lower by 0.66 (95 percent CI: 0.55, 0.80) and 0.43 (95 percent CI: 0.31, 0.61), respectively. These differences did not vary significantly over time (interaction term for reviewer type and year explained an additional model deviance of 1.44, 8df, p=.994), indicating no evidence of instability in the detection rate over time between the internal, external, and experienced reviewers. The level of agreement between the experienced team and the external or internal teams was “fair” to “moderate,” with the internal team performing better than the external team (Figure 4). The sensitivity and specificity of the review teams using the experienced team as the comparison group were 34 percent and 93 percent (external) and 49 percent and 94 percent (internal), respectively. Thus, although it appears that both the internal and external teams identified fewer adverse events than the experienced team (a reflection of their sensitivity), those adverse events that were identified by the internal and external review teams were frequently identified by the experienced review team as well (high specificity). We did not identify enough adverse events in the more severe categories of G, H, and I to determine with confidence the sensitivity and specificity of the internal and external team reviews for these more severe adverse events (Table 4).
Figure 4.
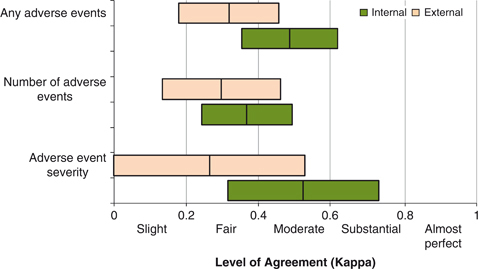
Level of Agreement between Internal and External Review Teams and the Experienced Review Team
DISCUSSION
With almost 2,400 charts from 10 North Carolina hospitals over a 6-year time frame evaluated by internal, external, and experienced review teams, this report represents the largest and most systematic study performed to date using the GTT adverse event measurement methodology. The results suggest that the GTT methodology provides reproducible estimates of adverse event rates and thus can be used reliably by individual hospitals, states, and the nation to estimate rates of adverse events and trends over time. In addition, the findings of this study may guide the use of the GTT for future large-scale evaluations of adverse events.
Most important, both interrater and intrarater reliability were significantly higher for the internal review team than for the external review team in every comparison made, with internal weighted κs ranging from 0.64 (“substantial” agreement) to 0.93 (“almost perfect” agreement; Landis and Koch 1977). Moreover, internal review teams identified significantly more adverse events than did the external review teams. More specifically, internal primary reviewers identified 38 percent more suspected adverse events than their external counterparts, and internal physician reviewers identified 25 percent more consensus adverse events than their external counterparts. This translated into higher sensitivity of internal reviewers compared with the experienced review team (49 percent versus 34 percent), while specificity was comparable (94 percent versus 93 percent). Levels of agreement between same team physicians regarding preventability classification were also higher for internal teams compared with external teams (κ=0.83 versus 0.54), reaching a level of agreement higher than previously published (Baker et al. 2004, κ=0.69). Overall, the levels of agreement for the internal team chart reviews were equal to or better than those seen in other studies using similar methods as exemplified in the levels of agreement between physician reviewers that an adverse event occurred (Classen et al. 2008, κ=0.847; Brennan et al. 1991, κ=0.61; Baker et al. 2004, κ=0.47; Sari et al. 2007, κ=0.76).
The superiority of internal reviewers was not anticipated. One possible explanation is that internal reviewers are more familiar with their local charting format and language, and thus more adept at finding triggers than the external reviewers. A second explanation could be that internal teams' conclusions were not independent and were discussed among themselves before data submission. We believe this to be unlikely because each team had different personnel, were provided strict instructions to function and report independently from the others, and entered all study data independently without access to other team's data. These results suggest that internal hospital reviewers may be preferable to teams of external reviewers when undertaking large-scale national or regional studies. Additional potential advantages of using internal reviewers include lower cost, reviewer availability, familiarity with local charting habits, and the opportunity to train and continue to use these reviewers to identify local adverse event rates routinely over time. Indeed, hospitals that wish to estimate and track their rates of adverse events over time should be reassured that internal reviewers perform with high reliability, and that adverse event detection by internal reviewers is highly specific and reasonably sensitive.
However, even the internal reviewers failed to detect adverse events found by the experienced team reviewers. The experienced team identified 36.6 adverse events per 100 patients, approximately 1.5- and 2.3-fold more than the internal and external review teams, respectively. It is likely that more intensive training, including monitoring and feedback regarding performance of reviewers over time, would improve reliability and sensitivity of both external and internal reviewers in detecting adverse events (Classen et al. 2008). It is also possible that external and internal reviewers more accurately detect the most severe adverse events, but the number of records with these higher levels of adverse events reviewed by the experienced team was insufficient to address this important issue.
This study has several limitations. First, although the GTT appears to be a suitable methodology for detecting and tracking adverse events, there remains no true “gold standard” for adverse event identification. We anticipated that the experienced users of the GTT (the experienced team) would identify higher numbers of adverse events than did the newly trained internal and external reviewers; however, we recognize that even the experienced team reviewers may have missed some adverse events. In addition, we were unable to ascertain whether the experienced team reviewers were more aggressive in classifying borderline cases as adverse events (false-positives). Alternatively it is conceivable that the experienced team reviewers, some of whom helped create the GTT and may be invested in demonstrating its superior sensitivity, may have been subconsciously biased to overestimate the number and severity of adverse events. Second, by confining chart reviews to 20 minutes, we recognize that some adverse events could be missed. However, previous studies have suggested that the vast majority of adverse events can be detected within 20 minutes, even in complex charts (Griffin and Resar 2007; Classen et al. 2008;). Third, the physician reviewers heard the primary reviewer's summaries of all suspected adverse events at the same time so may not have rated these cases completely independently before concluding consensus. This potential bias would have minimal effect on the primary focus of the study, which was the reliability between internal, external, and experienced reviewer teams rather than the reliability of the physician reviewers individually. Finally, the training period was relatively short, and reviewers may have worked along a steep learning curve during the initial part of the study.
CONCLUSION
Based on the satisfactory interrater and intrarater reliability at the primary review stage, high levels of agreement between physician reviewers, high specificity, and reasonable and stable sensitivity when comparing the internal and external review teams with the experienced review team, we conclude that the GTT is a reliable and practical method for estimating the occurrence of adverse events to hospitalized patients. Our study suggests that the GTT can be used in a random sample of hospitals to determine regional or national rates of adverse events. Additionally, the GTT could be used to assess the effectiveness of interventions to improve patient safety over time. Future studies related to the performance of the IHI GTT, in particular the establishment of a true gold standard to which various approaches to GTT use could be compared, may be warranted. In this study, the internal teams performed better than the external teams, suggesting that internal teams could form the basis of future large-scale adverse event studies. Internal review teams are also advantageous with respect to cost, availability of personnel, and the ability to continue local adverse event measurements over time. A future publication will describe the burden and types of overall adverse events (preventable and total), as well the change in rates of adverse events over time, in North Carolina.
Acknowledgments
Joint Acknowledgment/Disclosure Statement: The authors would like to acknowledge the valuable contributions made by the members of the Scientific Advisory Group including: Jerry Gurwitz, M.D.; Donna Isgett, R.N., M.S.N.; Brent James, M.D., M.Stat.; Bruce Landon, M.D.; Lucian Leape, M.D.; Elizabeth McGlynn, Ph.D.; David Pryor, M.D.; Richard Thomson; and James Ware, Ph.D. In addition, we would like to thank David Classen, M.D., for providing guidance to the development of the study protocol; Warren Strauss, Sc.M., for providing additional statistical analysis; and Charles Knott, M.P.A., for supervising the data collection. We would also like to thank Lee Adler, D.O.; Nancy Kimmel; Marjorie McKeever; and Diedre Rahn, who in addition to coauthors Frances Griffin and Roger Resar, M.D., conducted the “expert review team” reviews for this study. Additionally, we wish to think Frank Davidoff, M.D., and Jane Roessner, Ph.D., for their critical review and editing of this manuscript. Finally, this study was partially funded by a grant from the Rx Foundation (Walnut, CA) that had no role in the design of the study; the collection, analysis, and interpretation of the data; or the decision to approve publication of the finished manuscript. The remaining financial support to complete this study was provided by the Institute for Healthcare Improvement (IHI) that (with the exception of the participation of authors and those acknowledged above that are affiliated with the IHI) had no role in the design of the study; the collection, analysis, and interpretation of the data; or the decision to approve publication of the finished manuscript.
Disclosures: Multiple authors (G. P., D. G., C. B., F. G.) are or were at the time of the study (A. H.) employees of the IHI and one author (R. R.) is an IHI faculty member. As employees and faculty members of the IHI, each of these authors has encouraged the use of the Global Trigger Tool as an important tool for use in identifying adverse events in the hospital setting. Once funding from the Rx Foundation was exhausted, the IHI contributed financial support to the expert reviewer team members (time, travel, and expenses for RR and FG; travel and expenses for LA, NK, MM, and DR) and to the Clinical Research Organization to complete the study. As a courtesy, only six of the authors (G. P., D. G., C. B., A. H., R. R., F. G.) distributed the draft manuscript to IHI staff not included in the authorship or acknowledgements for their information. There was no requirement by the IHI for previous approval or notification of the study findings or the manuscript.
Disclaimers: None.
SUPPORTING INFORMATION
Additional supporting information may be found in the online version of this article:
Appendix SA1: Author Matrix.
Please note: Wiley-Blackwell is not responsible for the content or functionality of any supporting materials supplied by the authors. Any queries (other than missing material) should be directed to the corresponding author for the article.
REFERENCES
- Agency for Healthcare Research and Quality. 2009. “Healthcare Cost and Utilization Project (HCUP)” [accessed on December 28, 2009]. Available at http://hcupnet.ahrq.gov/HCUPnet.jsp?Id=537A491834DBC7EC&Form=SelDB&JS=Y&Action=%3E%3ENext%3E%3E&_DB=NIS06. [DOI] [PubMed]
- AHA Annual Survey Database for Fiscal Year 2005 and AHA Annual Survey Database for Fiscal Year 2004. [accessed on July 27, 2010]. Available at http://www.ahadata.com/ahadata/html/AHASurvey.html.
- Baker GR, Norton PG, Flintoft V, Blais R, Brown A, Cox J, Etchells E, Ghali WA, Hébert P, Majumdar SR, O'Beirne M, Palacios-Derflingher L, Reid RJ, Sheps S, Tamblyn R. The Canadian Adverse Event Study: The Incidence of Adverse Events among Hospital Patients in Canada. Canadian Medical Association Journal. 2004;170(11):1678–86. doi: 10.1503/cmaj.1040498. [DOI] [PMC free article] [PubMed] [Google Scholar]
- Berwick DM, Calkins DR, McCannon CJ, Hackbarth AD. The 100,000 Lives Campaign: Setting a Goal and a Deadline for Improving Health Care Quality. Journal of the American Medical Association. 2006;295(3):324–7. doi: 10.1001/jama.295.3.324. [DOI] [PubMed] [Google Scholar]
- Brennan TA, Leape LL, Laird NM, Hebert L, Localio AR, Lawthers AG, Newhouse JP, Weiler PC, Hyatt HH. Incidence of Adverse Events and Negligence in Hospitalized Patients. Results of the Harvard Medical Practice Study I. New England Journal of Medicine. 1991;324(6):370–7. doi: 10.1056/NEJM199102073240604. [DOI] [PubMed] [Google Scholar]
- Brennan TA, Localio RJ, Laird NL. Reliability and Validity of Judgments Concerning Adverse Events Suffered by Hospitalized Patients. Medical Care. 1989;27(12):1148–58. doi: 10.1097/00005650-198912000-00006. [DOI] [PubMed] [Google Scholar]
- Catalano K. JCAHO's National Patient Safety Goals 2006. Journal of Perianesthesia Nursing. 2006;21(1):6–11. doi: 10.1016/j.jopan.2005.11.005. [DOI] [PubMed] [Google Scholar]
- Classen DC, Lloyd RC, Provost L, Griffin FA, Resar R. Development and Evaluation of the Institute for Healthcare Improvement Global Trigger Tool. Journal of Patient Safety. 2008;4(3):169–77. [Google Scholar]
- Fleiss JL, Cohen J. The Equivalence of Weighted Kappa and the Intraclass Correlation Coefficient as Measures of Reliability. Educational and Psychological Measurement. 1973;33:613–9. [Google Scholar]
- Griffin FA, Classen D. Detection of Adverse Events in Surgical Patients Using the Trigger Tool Approach. Quality and Safety in Health Care. 2008;17(4):253–8. doi: 10.1136/qshc.2007.025080. [DOI] [PubMed] [Google Scholar]
- Griffin FA, Resar RK. IHI Global Trigger Tool for Measuring Adverse Events. IHI Innovation Series White Paper. Cambridge, MA: Institute for Healthcare Improvement; 2007. [Google Scholar]
- Jha AK, Orav EJ, Ridgway AB, Zheng J, Epstein AM. Does the Leapfrog Program Help Identify High-Quality Hospitals? Joint Commission Journal on Quality and Patient Safety. 2008;34(6):318–25. doi: 10.1016/s1553-7250(08)34040-9. [DOI] [PubMed] [Google Scholar]
- Joint Commission on the Accreditation of Healthcare Organizations. 2009. Facts about Patient Safety [accessed on July 27, 2010]. Available at http://www.jointcommission.org/PatientSafety/facts_patient_safety.htm.
- Kohn LT, Corrigan JM, Donaldson MS, editors. To Err Is Human: Building a Safer Health System. Washington, DC: National Academy Press; 2000. [PubMed] [Google Scholar]
- Landis JR, Koch GG. The Measurement of Observer Agreement for Categorical Data. Biometrics. 1977;33(1):159–74. [PubMed] [Google Scholar]
- Leape LL, Berwick DM. Five Years after To Err Is Human: What Have We Learned? Journal of the American Medical Association. 2005;293(19):2384–90. doi: 10.1001/jama.293.19.2384. [DOI] [PubMed] [Google Scholar]
- McCannon CJ, Hackbarth AD, Griffin FA. Miles to Go: An Introduction to the 5 Million Lives Campaign. Joint Commission Journal on Quality and Patient Safety. 2007;33(8):477–84. doi: 10.1016/s1553-7250(07)33051-1. [DOI] [PubMed] [Google Scholar]
- Milstein A, Galvin RS, Delbanco SF, Salber P, Buck CR., Jr Improving the Safety of Health Care: The Leapfrog Initiative. Effective Clinical Practice. 2000;3(6):313–6. [PubMed] [Google Scholar]
- National Coordinating Council for Medication Error Reporting and Prevention. 2001. “NCC MERP Endex for Categorizing Medication Errors” [accessed on April 6, 2010]. Available at http://www.nccmerp.org.
- Office of the Inspector General. 2010. “Adverse Events in Hospitals: Methods for Identifying Events,” OEI-06-08-00221 [accessed on April 6, 2010]. Available at http://www.oig.hhs.gov/oei/reports/oei-06-08-00221.pdf.
- Ornstein C. 2007. “Dennis Quaid Files Suit over Drug Mishap. LA Times. December 5 [accessed on April 6, 2010]. Available at http://www.latimes.com/features/health/la-me-quaid5dec05,1,1883436.story.
- Resar RK, Rozich JD, Simmonds T, Haraden CR. A Trigger Tool to Identify Adverse Events in the Intensive Care Unit. Joint Commission Journal on Quality and Patient Safety. 2006;32(10):585–90. doi: 10.1016/s1553-7250(06)32076-4. [DOI] [PubMed] [Google Scholar]
- Rozich JD, Haraden CR, Resar RK. Adverse Drug Event Trigger Tool: A Practical Methodology for Measuring Medication Related Harm. Quality and Safety in Health Care. 2003;12(3):194–200. doi: 10.1136/qhc.12.3.194. [DOI] [PMC free article] [PubMed] [Google Scholar]
- Sari AB, Sheldon TA, Cracknell A, Turnbull A. Sensitivity of Routine System for Reporting for Reporting Patient Safety Incidents in an NHS Hospital: Retrospective Patient Case Note Review. British Medical Journal. 2007;334(7584):51–4. doi: 10.1136/bmj.39031.507153.AE. [DOI] [PMC free article] [PubMed] [Google Scholar]
- Sharek PJ, Classen D. The Incidence of Adverse Events and Medical Error in Pediatrics. Pediatric Clinics of North America. 2006;53(6):1067–7. doi: 10.1016/j.pcl.2006.09.011. [DOI] [PubMed] [Google Scholar]
- Sharek PJ, Horbar JD, Mason W, Bisarya H, Thurm CW, Suresh G, Gray JE, Edwards WH, Goldmann D, Classen D. Adverse Events in the Neonatal Intensive Care Unit: Development, Testing, and Findings of an NICU-Focused Trigger Tool to Identify Harm in North American NICUs. Pediatrics. 2006;118(4):1332–40. doi: 10.1542/peds.2006-0565. [DOI] [PubMed] [Google Scholar]
- Takata GS, Mason W, Taketomo C, Logsdon T, Sharek PJ. Development, Testing, and Findings of a Pediatric-Focused Trigger Tool to Identify Medication-Related Harm in US Children's Hospitals. Pediatrics. 2008;121(4):e927–35. doi: 10.1542/peds.2007-1779. [DOI] [PubMed] [Google Scholar]
- Thomas EJ, Lipsitz SR, Studdert DM, Brennan TA. The Reliability of Medical Record Review for Estimating Adverse Event Rates. Annals of Internal Medicine. 2002;136(11):812–6. doi: 10.7326/0003-4819-136-11-200206040-00009. [DOI] [PubMed] [Google Scholar]
- Vemula R, Robyn Assaf R, Al-Assaf AF. Making the Patient Safety and Quality Improvement Act of 2005 Work. Journal of Healthcare Quality. 2007;29(4):6–10. doi: 10.1111/j.1945-1474.2007.tb00199.x. [DOI] [PubMed] [Google Scholar]
- Vincent C, Aylin P, Franklin BD, Holmes A, Iskander S, Jacklin A, Moorthy K. Is Healthcare Getting Safer? British Medical Journal. 2008;337:1205–7. doi: 10.1136/bmj.a2426. [DOI] [PubMed] [Google Scholar]
Associated Data
This section collects any data citations, data availability statements, or supplementary materials included in this article.