Abstract
A cell-penetrating, fluorescent protein substrate was developed to monitor intracellular protein kinase A (PKA) activity in cells without the need for cellular transfection. The PKA substrate (PKAS) was prepared with a 6×histidine purification tag, an enhanced green fluorescent protein (EGFP) reporter, an HIV-TAT protein transduction domain for cellular translocation and a pentaphosphorylation motif specific for PKA. PKAS was expressed in Escherichia coli and purified by metal affinity chromatography. Incubation of PKAS in the extracellular media facilitated translocation into the intracellular milieu in HeLa cells, βTC-3 cells and pancreatic islets with minimal toxicity in a time and concentration dependent manner. Upon cellular loading, glucose-dependent phosphorylation of PKAS was observed in both βTC-3 cells and pancreatic islets via capillary zone electrophoresis. In pancreatic islets, maximal PKAS phosphorylation (83± 6%) was observed at 12 mM glucose, whereas maximal PKAS phosphorylation (86±4%) in βTC-3 cells was observed at 3 mM glucose indicating a left-shifted glucose sensitivity. Increased PKAS phosphorylation was observed in the presence of PKA stimulators forskolin and 8-Br-cAMP (33% and 16%, respectively), with corresponding decreases in PKAS phosphorylation observed in the presence of PKA inhibitors staurosporine and H-89 (40% and 54%, respectively).
Keywords: Capillary electrophoresis, Protein kinase A, Cell-penetrating peptides, Fluorescent protein
Introduction
Protein phosphorylation dynamics play a key role in the regulation of biological function. As such, protein kinases and phosphatases are key participants in cellular signal transduction cascades and are ubiquitous throughout biology [1]. Protein kinases regulate these functions by catalyzing the phosphorylation of target substrates and signaling molecules whereas phosphatases remove phosphates, thereby switching the activity of the signal [2, 3]. The capability to monitor the catalytic activity of protein kinases and phosphatases provides an important indicator of the information flow inside the cell as well as the effects of a variety of modulators on cellular function.
Protein kinase A (PKA) activity is pivotal in a number of biological signaling cascades, including glucose stimulated insulin secretion in the pancreatic β-cell [4, 5]. Primary methods for analysis of PKA activity include enzyme assays using a variety of labeled substrates, mass spectrometry, immunoprecipitation, western blot analysis and many others [6–8]. Generally, these assays rely on large numbers of cells and require significant sample preparation, during which time competing dephosphorylation may occur, skewing the true phosphorylation state at the moment of cellular function. To overcome the batch assays, a series of fluorescent indicators have been developed based on fluorescence resonance energy transfer resulting from changes in protein conformation following phosphorylation of the substrate, or activation of the kinase itself [9, 10]. These probes allowed the analysis of single cells and provided temporally correlated data regarding kinase activity via fluorescence microscopy [11]. However, in each of these cases, the probes must be transfected into the cell or microinjected to cross the cell membrane, potentially altering the intracellular environment.
Recently, capillary zone electrophoresis (CZE) of fluorescent peptide kinase substrates has been used to monitor cellular kinase activity [12, 13]. CZE provides a fast, highly efficient and highly sensitive separation facilitating analysis of small masses and volumes [14]. Phosphorylation of the fluorescently labeled peptide substrates changes the electrophoretic mobility resulting in differing migration times in CZE. This approach has been used to study the activity of kinases in smaller populations of mammalian cells as well as single cells [15, 16] once the substrate was introduced into the cellular environment.
Peptide substrates for kinase studies can be introduced into the intracellular milieu via a number of approaches. Most commonly, microinjection of peptide substrates is utilized, however, this approach is highly invasive, suffers from low success rates and damages the cell membrane, which may in turn activate intracellular enzymatic cascades, including kinases, and thus interfere with the analysis [13]. More recently, transient expression of fluorescent protein kinase substrate fusion proteins was used to monitor PKA in mammalian cells via an enhanced green fluorescent protein (EGFP)-PKA substrate chimera with eight phosphorylation sites [12]. When cells expressing the PKA-EGFP chimera were stimulated with PKA activating 8-bromo-cAMP, the fully phosphorylated form of the substrate was observed via CZE. Transfection and subsequent expression of the protein substrate is more complicated in primary cells and many other cell lines, thus necessitating alternate approaches for intracellular loading of fluorescent kinase substrates.
Cell-penetrating peptides (CPP), also known as protein transduction domains (PTD), have been used to deliver a wide range of biomolecules including peptides, full-length proteins, nucleic acids, nanoparticles, and quantum dots into mammalian cells [17, 18]. Of the large number of CPPs discovered, the PTD of HIV-1 TAT, has been most widely used to non-invasively deliver biomolecules into a variety of cell types [19, 20]. TAT contains a region of 9 amino acid residues (RKKRRQRRR) with a high density of basic amino acids that facilitates membrane translocation and may prove useful for intracellular loading of protein kinase substrates. Allbritton and coworkers prepared fluorescent kinase substrate fusion peptides by linking the TAT sequence with a short peptide substrate for calcium-calmodulin-activated kinase II (CamK II) and showed the kinetic properties of CamII for the TAT-conjugated substrate were degraded [21]. Further, when loaded into rat basophilic leukemia (RBL) cells no peaks were observed when analyzed by CZE, likely due to (a) the enhanced sequestration of small molecule- TAT conjugates or (b) alteration of the peptide activity via TAT fusion. These deleterious effects may be overcome via fusion to a larger protein substrate [17, 18].
Here, we describe the development and application of a cell-penetrating, fluorescent PKA substrate protein (PKAS) that allows analysis of PKA activity in vitro as well as within the intracellular milieu of insulin-secreting βTC-3 cells and rat pancreatic islets of Langerhans under different stimulatory and inhibitory conditions. PKAS was introduced to cells and subsequently used to analyze the cellular phosphorylation state via CZE.
Experimental section
Reagents
Protease inhibitor cocktail, [4-(2-aminoethyl)benzenesulfonyl fluoride hydrochloride], H-89 dihydrochloride hydrate, isopropyl-beta-D-thiogalactopyranoside (IPTG), adenosine 5′-triphosphate disodium salt (ATP), dithiothreitol (DTT), protein kinase A catalytic subunit, forskolin, carboxyfluorescein, alkaline phosphatase (AP), propidium iodide, imidazole and all buffer reagents were purchased from Sigma-Aldrich (St. Louis, MO) and used as received. PhosSTOP phosphatase inhibitor cocktail tablets were purchased from Roche (Indianapolis, IN). Staurosporine was purchased from LC laboratories (Woburn, MA). The reagents and kits for molecular biology were from Promega (Madison, WI). Plasmids were from BD Biosciences (San Jose, CA) and Novagen (Gibbstown, NJ). All chemicals for cell culture were obtained from Invitrogen (Palo Alto, CA). Luria–Bertani (LB) broth and benzonase were purchased from EMD/Novagen chemicals (Gibbstown, NJ). All solutions were prepared using deionized water with a minimum resistivity of 18 MΩ cm.
Preparation of PKAS
Polymerase chain reaction (PCR) was used to amplify the sequence coding for EGFP using pEGFP (BD Biosciences) as the template. The amplified fragment was inserted between the Nhe I and BamH I restriction sites of the pET28a(+) vector (EMD/Novagen). The DNA encoding the TAT sequence (RKKRRQRRR) was inserted between the Nde I and Nhe I sites upstream of the EGFP gene. Two complementary oligonucleotides encoding the substrate for PKA with five phosphorylation sites (98 total base pairs) was custom synthesized (Integrated DNA Technology, Inc). The 5′ ends of these sequences were phosphorylated and directly ligated between BamH I and Hind III sites downstream of the EGFP gene. Constructs were verified by sequencing (DNA Sequencing Facility, University of Arizona).
Expression and purification of PKAS
The plasmid encoding PKAS was transformed into Escherichia coli DE3-Rosetta (Novagen) strain and positive transformants were selected in the presence of 50 μg/mL kanamycin (Kan) and 50 μg/mL of chloramphenicol (Chl). A single colony was chosen for protein expression, inoculated in a 5 mL starter culture (LB/Kan/Chl), and incubated on a temperature controlled shaker at 37 °C and 250 rpm overnight to obtain a saturated culture. The culture was centrifuged, and the supernatant was discarded. The bacterial pellet was re-suspended in 2 mL LB/Kan/Chl, added into a 400 mL culture of LB/Kan/Chl, and grown at 37 °C and 250 rpm until O.D.600 ~0.6. The culture was cooled to room temperature, induced for protein expression with IPTG to a final concentration of 0.2 mM, and maintained at room temperature for 10 h. Cells were harvested by centrifugation and lysed by sonication in lysis buffer (50 mM Tris–succinate, 300 mM NaCl, pH 7.8) in the presence of protease inhibitor cocktail. The lysate was then treated with benzonase for 30 min to digest the nucleic acids. The lysed suspension was centrifuged and the clear lysate loaded onto a pre-equilibrated Ni2+-NTA agarose column (Qiagen, Valencia, CA). The resin was rinsed sequentially with 10, 20, and 50 mM imidazole in lysis buffer followed by elution of PKAS with 250 and 500 mM imidazole. The collected fractions were stored at −20 °C in 50% glycerol in the presence of 3 mM DTT until use.
Isolation of pancreatic islets and cell culture
Pancreatic islets were isolated from Sprague–Dawley rats and cultured as previously described [22]. βTC-3 cells were cultured at 37 °C, 5% CO2, pH 7.4 in RPMI 1640 containing 10% fetal bovine serum, 4 mM L-glutamine, 100 units/mL penicillin, and 100 μg/mL streptomycin. HeLa cells were cultured at 37 °C, 5% CO2, pH 7.4 in Minimum Essential Media with 10% fetal bovine serum, 100 units/mL penicillin, and 100 μg/mL streptomycin.
Fluorescent-activated cell sorting
Cells were plated on 35-mm culture dishes and grown to 80% confluency. Different concentrations of PKAS in Opti-Mem reduced serum media were added to cells and incubated for the indicated time periods, ranging from 1 to 6 h. Cells were then washed five times in Krebs–Ringer Buffer (KRB) (118 mM NaCl, 5.4 mM KCl, 2.4 mM CaCl2, 1.2 mM MgSO4, 1.2 mM KH2PO4, 3 mM D-glucose, 25 mM HEPES) and trypsinized for 10 min to remove membrane-bound peptides [23]. The cells were collected, re-suspended in ice-cold phosphate buffered saline (PBS; 137 mM NaCl, 2.7 mM KCl, 10 mM Na2HPO4, 2 mM KH2PO4, pH 7.4) and analyzed by fluorescent-activated cell sorting (FACS). Cells were also stained with propidium iodide (PI) to exclude non-viable cells. Cellular uptake of PKAS was assessed by considering the shift in the distribution of the fluorescence of the sample loaded with the substrate PKAS as opposed to the control samples (untreated cells and cells treated with EGFP lacking the protein transduction domain).
Confocal microscopy
HeLa cells, βTC-3 cells and pancreatic islets were seeded on glass-bottom microwell dishes (MatTek, Ashland MA). PKAS (5 μM in Opti-Mem reduced serum media) was added to HeLa and βTC-3 cells and incubated at 37 °C, 5% CO2 for 3 h. Pancreatic islets were treated with 1 μM PKAS for 10 h. Cells were washed with KRB buffer and treated with heparin (0.5 mg/ ml in PBS, 3× 5-min treatments) to remove extracellular bound substrate. The live cells were viewed using a Nikon confocal microscope following excitation with an Ar+ (488 nm) laser. A z axis image series was collected for each cell type.
Capillary electrophoresis of PKAS
Capillary zone electrophoresis (CZE) was performed using an instrument constructed in-house [24]. Separation was performed in 25-μm inner diameter (i.d.) capillaries (InnovaQuartz, Phoenix, AZ) following 5 s hydrodynamic injection of sample. Separation was performed at positive polarity with an electric field of 400 V/cm using 20 mM borate, pH 9.3. Capillaries were conditioned with 0.1 M NaOH, nanopure water, and running buffer for 10 min each prior to separation. Due to the basic nature of PKAS, the capillary was reconditioned after each run with 0.1 M HCl, nanopure water, 0.1 M NaOH, nanopure water and running buffer for 5 min each to minimize the effects of protein adsorption to the wall. Laser-induced fluorescence was excited using the 488 nm line of an Ar+ laser. Data collection was performed using software written in-house using LabView (National Instruments). Data analysis was performed using Cutter 7.0 (beta) [25].
Evaluation of phosphorylation levels
The extent of phosphorylation was determined by calculating the ratio of the peak heights of unphosphorylated substrate peaks to phosphorylated product peaks. The peak height for each peak in the electropherograms was measured and summed to generate a total peak height for substrate and a total peak height for product. When multiple, poorly resolved peaks were present, new peaks were considered upon a change in inflection. To validate this approach, we also compared the sum of the peak areas for substrate and product peaks for one set of data and found the numbers to agree within statistical errors. The degree of phosphorylation is presented as the ratio of phosphorylated products to substrate which provides a quantitative approximation of the number of phosphorylated molecules, rather than the degree of phosphorylation per molecule, which was not resolvable.
In vitro phosphorylation of PKAS
Purified PKAS was treated with 20 catalytic units of PKA in the presence of 500 μM ATP, 100 μM cAMP, and 10 mM Mg2+ in 50 mM Tris buffer, pH 7.8, at 30 °C. The dephosphorylation reaction was carried out by incubating the mixture with 20 units of AP.
Analysis of PKA activity in βTC-3 cells
βTC-3 cells were cultured on 35-mm dishes as described. One hour before loading PKAS, the media was changed to DMEM glucose-free media supplemented with 3 mM glucose followed by a 3-h incubation of 5 μM PKAS in the same medium. Following incubation, cells were washed with KRB and treated with trypsin to remove non-specifically bound PKAS from the cell membrane. The cells were collected and centrifuged then the cell pellet was washed twice with PBS. Finally, the cell pellet was re-suspended in 100 μL PBS and lysed via six freeze–thaw cycles in dry ice/isopropanol and 37 °C water bath. Cell debris was discarded by centrifugation and the supernatant was frozen until analysis by CZE. The dephosphorylation reaction was carried out by incubating the lysates at 37 °C with 20 units AP.
Glucose-dependent phosphorylation, was monitored by incubating βTC-3 cells in DMEM glucose-free media for 30 min followed by stimulation with differing glucose concentrations ranging from 0 to 12 mM glucose for 3 h. The effects of PKA activators were monitored by incubation of βTC-3 cells in 0 or 0.5 mM glucose for 3 h followed by addition of 10 μM forskolin or 0.5 mM 8-Br-cAMP for 30 min. The effect of PKA inhibitors H-89 (10 μM) and staurosporine (1 μM) on PKA activity was investigated in βTC-3 cells that were treated for 10 min prior to loading 5 μM PKAS and were continuously treated during the time of incubation. In all cases, cell extracts were prepared as described above.
Phosphorylation of PKAS in pancreatic islets
Isolated islets were incubated in 1 μM PKAS in DMEM glucose-free media supplemented with differing glucose concentrations for 10 h. After incubation, cell extracts were prepared as described above.
Results and discussion
Preparation of PKAS
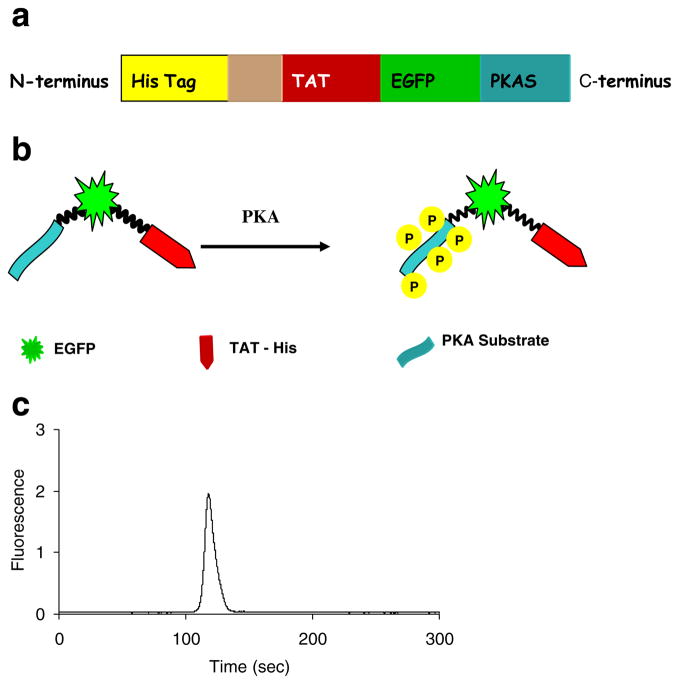
To avoid the need for cellular transfection, and thus facilitate delivery of kinase substrates, as well as more readily analyze primary cells, we have developed a cell-penetrating, fluorescent PKA substrate. PKAS was designed as a modular substrate that could be loaded into cells simply via addition to the extracellular medium. PKAS was constructed as shown schematically in Fig. 1a. Briefly, the gene encoding the PTD of HIV-TAT was ligated into a pET28a (+) vector downstream (c-terminal) of a 6×His purification tag. The sequence encoding EGFP was inserted downstream to TAT. EGFP, with an approximate molecular mass of 27 kDa, is an exceptionally stable protein with a defined structure compared to many small peptide kinase substrates. Thus, fusion of the large protein to the small TAT sequence might improve cellular translocation and reduce deleterious effects observed with small TAT-substrate fusions. In addition, the EGFP also serves as the fluorescent label for PKAS, with a defined stoichiometry. Since EGFP does not naturally possess PKA kinase phosphorylation sequences, it does not itself participate in the phosphorylation events, necessitating the insertion of a phosphorylation domain [26]. A pentaphosphorylation motif for PKAS containing five independent phosphorylation sites (RRRSIN)5 was inserted into the C-terminus of EGFP (Fig. 1b). Multiple phosphorylation sites increase the electrophoretic mobility shift of the phosphorylated products and help to resolve phospho-PKAS from unphosphorylated PKAS [12]. The resulting PKAS was expressed efficiently in bacteria and purified in high quantities as seen in an SDS-polyacrylamide gel (Fig. SI-1) of the purified recombinant peptide and CZE separation of purified PKAS (Fig. 1c).
Fig. 1.
Preparation and purification of PKAS. a Domain structure of PKAS, b Schematic of PKAS phosphorylation, c CZE separation of purified PKAS. Separation conditions: 25 μm i.d. capillary, 20 mM borate, pH=9.3, 575 V/cm
Analysis of membrane translocation efficiency of PKAS
FACS was used to monitor the cellular uptake of PKAS. To ensure that FACS quantifies only the internalized substrate, residual extracellular membrane-bound PKAS was removed via trypsinization prior to analysis. As seen in Fig. 2a, βTC-3 cells incubated with PKAS (iii) showed a strong fluorescence signal and a right-shifted distribution indicating a substantially higher fluorescence intensity compared to untreated cells (i) and cells treated with EGFP lacking a PTD (ii). Figure 2b summarizes the effects of incubation concentration and time on cellular uptake of PKAS in βTC-3 cells. The auto-fluorescence of untreated cells was used as the threshold, wherein the population of cells exceeding this level was considered EGFP positive. As seen in Fig. 2b, cellular translocation of PKAS increases with increasing concentrations and with longer incubation times, eventually reaching a point of cytotoxicity when the highest concentrations were incubated for the longest times (5 and 10 μM for 6 h; note: in all cases, cell viability was assessed using propidium iodide).
Fig. 2.
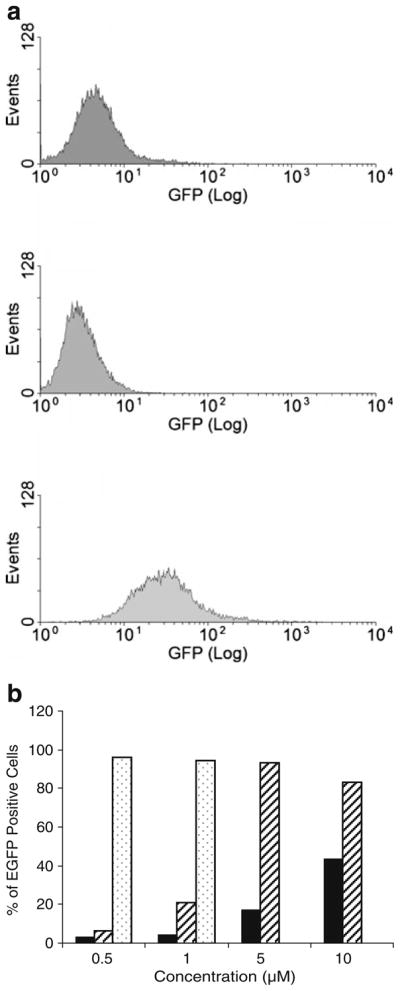
FACS analysis showing the cellular uptake of PKAS into βTC-3 cells. a Distribution of fluorescent intensity in cells exposed to (i) buffer, (ii) EGFP-lacking TAT, and (iii) PKAS. b Concentration and time dependent translocation of PKAS. Incubation times were (filled bar) 1 h, (striped bar) 3 h, and (dotted bar) 6 h
Confocal microscopy was used to further confirm the translocation of PKAS into mammalian cells. Prior reports suggested that errant results regarding the efficiency of cellular uptake attained using PTDs are common when using fixed cells [27], thus we utilized only live cells. Figure 3 shows a series of confocal fluorescence images obtained for HeLa and βTC-3 cells as well as pancreatic islets following exposure to PKAS. While all cell types translocate PKAS into the intracellular space, the punctate fluorescence observed in some images, particularly for HeLa cells, suggest enhanced vesicular trapping of PKAS that may lower accessibility to intracellular PKA. In βTC-3 cells and particularly in pancreatic islets, diffuse fluorescence was most often observed suggesting that substantial PKAS was translocated and accessible for phosphorylation by PKA.
Fig. 3.
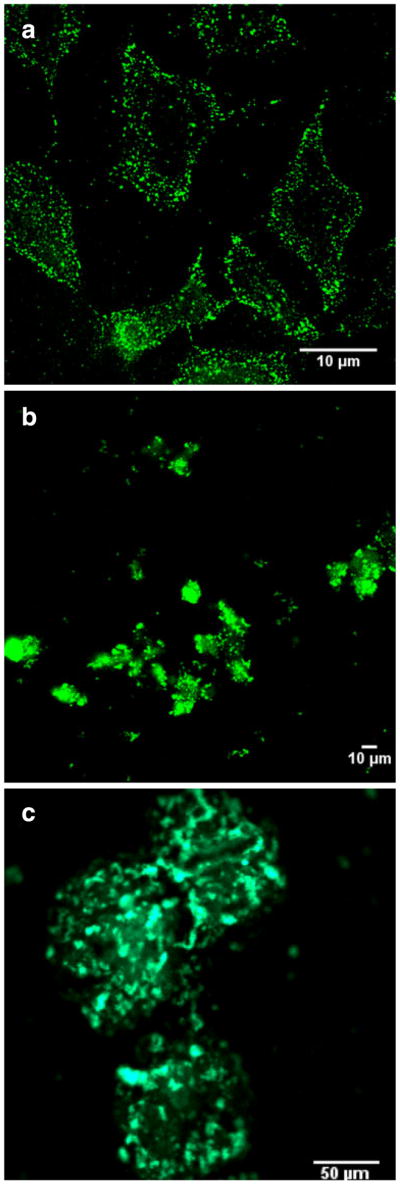
Confocal images of PKAS in a HeLa cells b βTC-3 cells, and c rat pancreatic islets. HeLa and βTC-3 cells were loaded with PKAS for 3 h at 5 μM and rat pancreatic islets for 10 h at 1 μM
Previous reports using PTDs revealed that large proteins, e.g., β-galactosidase (119 kDa), can be delivered into cells in less than 15 min [28]. However, our results from both confocal microscopy and FACS analysis indicate that the translocation efficiency varies upon the cell type, concentration, and incubation time. HeLa cells incubated with 5 μM PKAS showed ca. 90% translocation efficiency within 1 h (data not shown), whereas under similar conditions, βTC-3 cells took 3 h to achieve maximal translocation (Fig. 2b). Pancreatic islets were treated for at least 10 h to ensure translocation to the core of the islet, which is ca. 10–50× larger than single clonal cells and represents a densely packed population of cells. The mechanism of uptake for TAT fusion proteins is not well understood but experimental evidence suggest membrane association of TAT occurs through cell surface glycosaminoglycans such as heparin sulfate glycosaminoglycans (HPSGs) [29]. Expression of HPSGs depends upon the state of differentiation and growth rate of cells. Thus, differential expression of HPSGs may account for the observed differences in transduction efficiencies in different mammalian cell types.
In vitro phosphorylation of PKAS
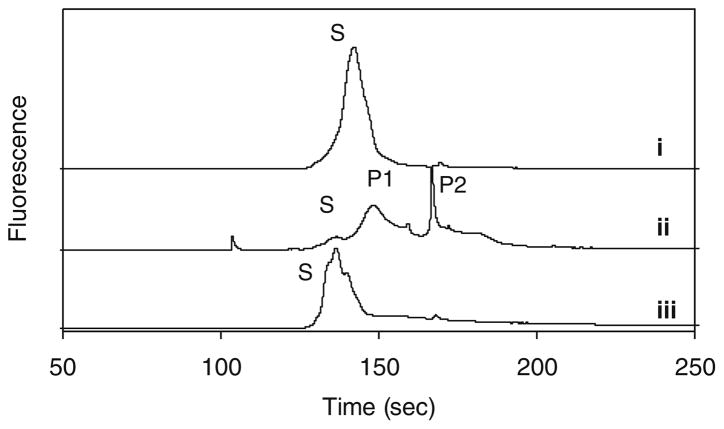
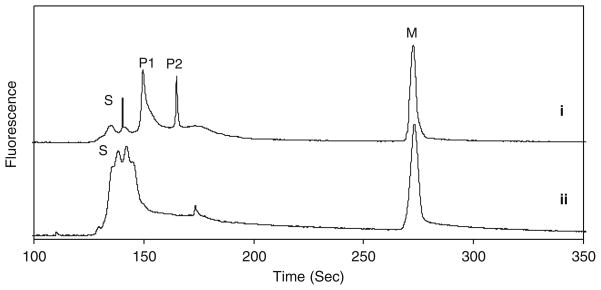
To verify the function of PKAS and subsequent CZE separation, we performed a series of in vitro phosphorylation experiments. When purified PKAS was analyzed by CZE, a single peak (S) with slight asymmetry was observed (Fig. 4i). The nature of the peak width and the number of poorly resolved peaks, particularly for the non-phosphorylated PKAS are unknown, but highly reproducible. Likely possibilities include proteolytic splice products and conformation alterations. The complex nature of the electropherograms led to treatment of regions denoted substrate (S) and phosphorylated product (P). Upon treatment with the catalytic subunit of PKA in the presence of cAMP and ATP, a shift in migration time and the number of peaks was observed (ii in Fig. 4) where the peak height corresponding to (S) decreased and two new peaks (P1 and P2) appear. To confirm whether P1 and P2 correspond to the phosphorylated PKAS products, AP was added to the reaction mixture to non-specifically dephosphorylate any phosphopeptides present (iii in Fig. 4). P1 and P2 were both eliminated upon treatment with AP, whereas peak S increased in height and area, further supporting that P1 and P2 arise from phosphorylation of PKAS by PKA.
Fig. 4.
In vitro phosphorylation of PKAS. (i) PKAS in the absence of PKA. (ii) PKAS treated with catalytic subunit of PKA. (iii) PKAS treated with PKA followed by treatment with AP. Peak S is the substrate and peaks P1 and P2 arise from phosphorylation products
Analysis of PKA activity in insulin-secreting cells
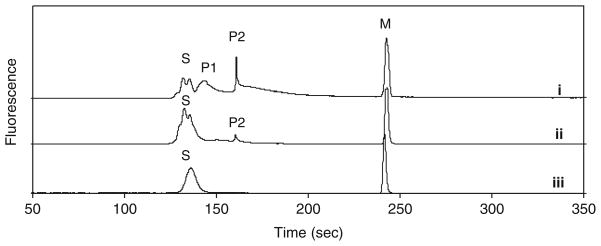
Following in vitro characterization, we utilized PKAS to monitor PKA activity in insulin-secreting βTC-3 cells [30], a common cellular model for pancreatic β-cell functional assays. We first used these cells to monitor glucose stimulated intracellular PKA activity. Figure 5 shows the electropherograms obtained from βTC-3 cells incubated in 3 mM glucose. As seen in Fig. 5, series of peaks correlating to PKAS and phospho-PKAS was obtained and provide an indication of the basal PKA activity within the cells (i). To confirm that P1 and P2 resulted from PKAS phosphorylation, AP was added to the cell extract, after which primarily unphosphorylated PKAS was observed (ii). The origin of multiple (P1 and P2) and broad (P1) peaks following phosphorylation is likely the result of the multiple phosphorylation sites present in PKAS, thus resulting in heterogeneous phosphorylation of PKAS. Further, the distribution of phosphorylation sites likely lead to skewed peak shapes and increased number of unresolved peaks observed in the S region of the electropherograms. The features of the electropherograms, particularly the observed peak shapes, are highly reproducible (Fig. SI-2). The ratio of product and substrate peaks provides an approximation of the PKA activity at the time of cell lysis and reveal that 83±6% of the PKAS is phosphorylated to some extent under basal glucose levels.
Fig. 5.
PKA catalyzed phosphorylation of PKAS in βTC-3 cells. Cells were loaded with PKAS and incubated in 3 mM glucose for 3 h. Cell lysate was analyzed by CZE (i) before and (ii) after addition of alkaline phosphatase. (iii) PKAS was added to a control βTC-3 cell lysate prepared in the absence of PKAS. Peak S is the substrate, peaks P1 and P2 are the phosphorylated products and peak M is a carboxyfluorescein internal standard. Separation conditions: 25 μm i. d. capillary, 20 mM borate, pH=9.3, 400 V/cm
To ensure that PKAS was not further phosphorylated or dephosphorylated in the time between cell lysis and CZE analysis, PKA inhibitor H-89 was added to the extract and the mixture was stored at −20°C immediately following lysis. To validate this condition, we spiked PKAS into βTC-3 cell extracts that were initially lacking PKAS and subsequently froze the extracts as described. Under these conditions, only one, broad unphosphorylated PKAS was observed (iii in Fig. 5) strongly supporting that PKAS phosphorylation occurs only inside intact cells prior to cell lysis. Finally, the electropherograms indicate that a significant proportion of PKAS is accessible to PKA within the cell and not trapped in endosomal compartments, as previously observed with a number of TAT-conjugated small peptides [31].
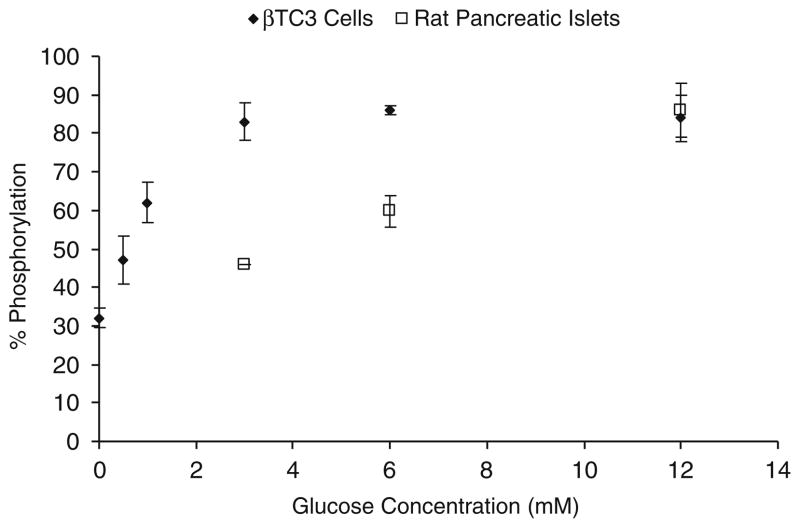
A number of factors, most importantly glucose elevations, modulate cAMP levels, and thus PKA levels in insulin-secreting cells. The resultant glucose-dependent phosphorylation of endogenous PKA substrates further activates the insulin secretory response [32, 33]. PKAS was used to monitor glucose-dependent PKA activation in βTC-3 cells and primary culture rat islets of Langerhans (Fig. 6). In the absence of glucose, ca. 32% of PKAS was phosphorylated in βTC-3 cells. Upon elevation of glucose concentration from 0.5 to 3 mM, a gradual increase in the proportion of phosphorylated PKAS was observed up to 83±4% phosphorylation for 3 mM glucose. However, beyond this level, no further significant changes in phosphorylation of PKAS was observed, thus indicating that PKA activity reaches a maximum level around 3 mM glucose in these cells. Earlier reports have shown that glucose-induced insulin release in βTC-3 cells is shifted to the left as compared to primary pancreatic islets, [34] and thus, βTC-3 cells are much more sensitive to extracellular glucose compared to primary cells.
Fig. 6.
Glucose-dependent phosphorylation of PKAS in βTC-3 and rat pancreatic islets
To ensure that the glucose-dependent PKAS phosphorylation resulted from elevated cAMP activation of PKA, we monitored PKAS phosphorylation in the presence of the cAMP modulators forskolin and 8-Br-cAMP. Forskolin directly activates adenylate cyclase resulting in elevated cAMP [35], whereas 8-Br-cAMP is a membrane permeant cAMP analog capable of directly activating PKA [36]. When βTC-3 cells were incubated at 0.5 mM glucose in the presence of forskolin or 8-Br-cAMP increases in PKAS phosphorylation of 35% and 16%, respectively, were observed (Table 1). These results compare favorably with prior reports of forskolin and 8-Br-cAMP activation of PKA, where forskolin is shown to stimulate PKA faster and at lower concentrations compared to 8-Br-cAMP [10].
Table 1.
Effect of inhibitors and stimulators on phosphorylation
| Inhibitors | % Phosphorylation | Stimulators | % Phosphorylation |
|---|---|---|---|
| (−) H-89 | 82±6 | (−) Br-cAMP | 55±6 |
| (+) H-89 | 28±4 | (+) Br-cAMP | 71±5 |
| (−) Staurosporine | 74±7 | (−) Forskolin | 47±3 |
| (+) Staurosporine | 34±3 | (+) Forskolin | 82±6 |
n=3 cell lysate preparations analyzed in triplicate for all measurements
In addition to cAMP activators, PKA inhibitors H-89 and staurosporine were used to further investigate the role of PKA on PKAS phosphorylation. Staurosporine is a potent inhibitor of a large spectrum of protein kinases including PKA [37], whereas H-89 is a selective PKA inhibitor [38]. When βTC-3 cells were incubated at 3 mM glucose, a concentration sufficient to fully activate PKAS, in the presence of staurosporine or H-89, decreases in PKAS phosphorylation of 40% and 54%, respectively, were observed (Table 1). These results suggest that PKA is primarily responsible for phosphorylation of PKAS and that PKAS can be used to report PKA activation in insulin-secreting βTC-3 cells.
The primary advantage of the cell permeant PKAS compared to transfection of EGFP-kinase substrates is the ability to less invasively load the fluorescent kinase substrate into primary cells and tissues to avoid reliance on immortalized cell lines. βTC-3 cells provide a reasonable model of glucose stimulated insulin secretion but possess a shifted glucose response curve, as well as other deviations from primary pancreatic β-cells [34]. Thus, we have explored the use of PKAS for elucidation of PKA activation in primary pancreatic islets, which are comprised primarily of pancreatic β-cells. To monitor PKA activation in pancreatic islets, we incubated PKAS-loaded islets under varying glucose concentrations for 10 h. As seen in Fig. 7 the electropherogram contains a series of peaks corresponding to phosphorylated PKAS and unphosphorylated PKAS (i), the identities of which were identified via AP (ii). When the islets were treated with 6 and 12 mM glucose, an increase to ca. 60% and 86% (n=3) phosphorylation was observed, respectively (Fig. 6), agreeing well with glucose sensitivity of pancreatic islets [39]. These data strongly support the utility of the PKAS-CZE approach for monitoring cellular phosphorylation in glucose responsive primary cells and tissues.
Fig. 7.
PKA catalyzed phosphorylation of PKAS in rat pancreatic islets. Islets were loaded with PKAS and incubated in 12 mM glucose for 10 h. Islet lysate was analyzed by CZE (i) before and (ii) after addition of AP. Peak S is the substrate, peaks P1 and P2 are the phosphorylated products and peak M is a carboxyfluorescein an internal standard. Separation conditions: 25 μm i.d. capillary, 20 mM borate, pH=9.3, 400 V/cm
Conclusion
A cell-penetrating kinase substrate was prepared to selectively monitor glucose-dependent PKA activity in clonal and primary cells using CZE. The resultant PKAS was translocated to the intracellular environment in mammalian cells via simple addition to the extracellular media. Under appropriate loading conditions, minimal damage to the cell membrane, and resultant loss of cell viability was observed. PKAS proved useful to investigate PKA activity on pancreatic islets where transient expression of peptide substrates is difficult. This cell-penetrating substrate for PKA was phosphorylated inside both βTC-3 cells and pancreatic islets in a glucose concentration dependant manner demonstrating the importance of PKA in glucose stimulated signaling. This approach may be readily extended to study different kinase pathways in a variety of clonal and primary culture cells.
Supplementary Material
Acknowledgments
We thank Dr. Sergey N. Krylov from York University Canada for providing the plasmid for the protein kinase A substrate used for preliminary studies. This work was supported by National Institute of Health (NIH-GM074522) and National Science Foundation (NSF-0548167).
Footnotes
Electronic supplementary material The online version of this article (doi:10.1007/s00216-010-3776-7) contains supplementary material, which is available to authorized users.
References
- 1.Hunter T. Cell. 2000;100:113–127. doi: 10.1016/s0092-8674(00)81688-8. [DOI] [PubMed] [Google Scholar]
- 2.Taylor SS, Knighton DR, Zheng JH, Teneyck LF, Sowadski JM. Annu Rev Cell Biol. 1992;8:429–462. doi: 10.1146/annurev.cb.08.110192.002241. [DOI] [PubMed] [Google Scholar]
- 3.Hunter T. Cell. 1995;80:225–236. doi: 10.1016/0092-8674(95)90405-0. [DOI] [PubMed] [Google Scholar]
- 4.Renstrom E, Eliasson L, Rorsman P. J Physiol-Lond. 1997;502:105–118. doi: 10.1111/j.1469-7793.1997.105bl.x. [DOI] [PMC free article] [PubMed] [Google Scholar]
- 5.Charles MA, Fanska R, Schmid FG, Forsham PH, Grodsky GM. Science. 1973;179:569–571. doi: 10.1126/science.179.4073.569. [DOI] [PubMed] [Google Scholar]
- 6.Macala LJ, Hayslett JP, Smallwood JI. Kidney Int. 1998;54:1746–1750. doi: 10.1046/j.1523-1755.1998.00140.x. [DOI] [PubMed] [Google Scholar]
- 7.McLachlin DT, Chait BT. Curr Opin Chem Biol. 2001;5:591–602. doi: 10.1016/s1367-5931(00)00250-7. [DOI] [PubMed] [Google Scholar]
- 8.Fang XJ, Yu SX, Lu YL, Bast RC, Woodgett JR, Mills GB. Proc Natl Acad Sci USA. 2000;97:11960–11965. doi: 10.1073/pnas.220413597. [DOI] [PMC free article] [PubMed] [Google Scholar]
- 9.Nagai Y, Miyazaki M, Aoki R, Zama T, Inouye S, Hirose K, Iino M, Hagiwara M. Nat Biotechnol. 2000;18:313–316. doi: 10.1038/73767. [DOI] [PubMed] [Google Scholar]
- 10.Zhang J, Ma YL, Taylor SS, Tsien RY. Proc Natl Acad Sci USA. 2001;98:14997–15002. doi: 10.1073/pnas.211566798. [DOI] [PMC free article] [PubMed] [Google Scholar]
- 11.Sato M, Ozawa T, Inukai K, Asano T, Umezawa Y. Nat Biotechnol. 2002;20:287–294. doi: 10.1038/nbt0302-287. [DOI] [PubMed] [Google Scholar]
- 12.Zarrine-Afsar A, Krylov SN. Anal Chem. 2003;75:3720–3724. doi: 10.1021/ac034463+. [DOI] [PubMed] [Google Scholar]
- 13.Meredith GD, Sims CE, Soughayer JS, Allbritton NL. Nat Biotechnol. 2000;18:309–312. doi: 10.1038/73760. [DOI] [PubMed] [Google Scholar]
- 14.Quigley WWC, Dovichi NJ. Anal Chem. 2004;76:4645–4658. doi: 10.1021/ac040100d. [DOI] [PubMed] [Google Scholar]
- 15.Dawson JF, Boland MP, Holmes CFB. Anal Biochem. 1994;220:340–345. doi: 10.1006/abio.1994.1347. [DOI] [PubMed] [Google Scholar]
- 16.Li H, Sims CE, Kaluzova M, Stanbridge EJ, Allbritton NL. Biochemistry. 2004;43:1599–1608. doi: 10.1021/bi035597k. [DOI] [PubMed] [Google Scholar]
- 17.Dietz GPH, Bahr M. Mol Cell Neurosci. 2004;27:85–131. doi: 10.1016/j.mcn.2004.03.005. [DOI] [PubMed] [Google Scholar]
- 18.Schwarze SR, Hruska KA, Dowdy SF. Trends Cell Biol. 2000;10:290–295. doi: 10.1016/s0962-8924(00)01771-2. [DOI] [PubMed] [Google Scholar]
- 19.Manceur A, Wu A, Audet J. Anal Biochem. 2007;364:51–59. doi: 10.1016/j.ab.2007.02.015. [DOI] [PubMed] [Google Scholar]
- 20.Jones SW, Christison R, Bundell K, Voyce CJ, Brockbank SMV, Newham P, Lindsay MA. Br J Pharmacol. 2005;145:1093–1102. doi: 10.1038/sj.bjp.0706279. [DOI] [PMC free article] [PubMed] [Google Scholar]
- 21.Soughayer JS, Wang Y, Li H, Cheung SH, Rossi FM, Stanbridge EJ, Sims CE, Allbritton NL. Biochemistry. 2004;43:8528–8540. doi: 10.1021/bi036296d. [DOI] [PubMed] [Google Scholar]
- 22.Aspinwall CA, Lakey JRT, Kennedy RT. J Biol Chem. 1999;274:6360–6365. doi: 10.1074/jbc.274.10.6360. [DOI] [PubMed] [Google Scholar]
- 23.Holm T, Johansson H, Lundberg P, Pooga M, Lindgren M, Langel U. Nat Protoc. 2006;1:1001–1005. doi: 10.1038/nprot.2006.174. [DOI] [PubMed] [Google Scholar]
- 24.Hapuarachchi S, Aspinwall CA. Electrophoresis. 2007;28:1100–1106. doi: 10.1002/elps.200600567. [DOI] [PubMed] [Google Scholar]
- 25.Shackman JG, Watson CJ, Kennedy RT. J Chromatogr A. 2004;1040:273–282. doi: 10.1016/j.chroma.2004.04.004. [DOI] [PubMed] [Google Scholar]
- 26.Yang F, Liu Y, Bixby SD, Friedman JD, Shokat KM. Anal Biochem. 1999;266:167–173. doi: 10.1006/abio.1998.2885. [DOI] [PubMed] [Google Scholar]
- 27.Richard JP, Melikov K, Vives E, Ramos C, Verbeure B, Gait MJ, Chernomordik LV, Lebleu B. J Biol Chem. 2003;278:585–590. doi: 10.1074/jbc.M209548200. [DOI] [PubMed] [Google Scholar]
- 28.Schwarze SR, Ho A, Vocero-Akbani A, Dowdy SF. Science. 1999;285:1569–1572. doi: 10.1126/science.285.5433.1569. [DOI] [PubMed] [Google Scholar]
- 29.Tyagi M, Rusnati M, Presta M, Giacca M. J Biol Chem. 2001;276:3254–3261. doi: 10.1074/jbc.M006701200. [DOI] [PubMed] [Google Scholar]
- 30.Efrat S, Linde S, Kofod H, Spector D, Delannoy M, Grant S, Hanahan D, Baekkeskov S. Proc Natl Acad Sci USA. 1988;85:9037–9041. doi: 10.1073/pnas.85.23.9037. [DOI] [PMC free article] [PubMed] [Google Scholar]
- 31.Fittipaldi A, Ferrari A, Arcangeli C, Monica M, Pellegrini V, Beltram F, Giacca M. Mol Ther. 2003;7:S372. doi: 10.1016/s1525-0016(03)00122-9. [DOI] [PubMed] [Google Scholar]
- 32.Thams P, Anwar MR, Capito K. Eur J Endocrinol. 2005;152:671–677. doi: 10.1530/eje.1.01885. [DOI] [PubMed] [Google Scholar]
- 33.Christie MR, Ashcroft SJH. Biochem J. 1984;218:87–99. doi: 10.1042/bj2180087. [DOI] [PMC free article] [PubMed] [Google Scholar]
- 34.Dambra R, Surana M, Efrat S, Starr RG, Fleischer N. Endocrinology. 1990;126:2815–2822. doi: 10.1210/endo-126-6-2815. [DOI] [PubMed] [Google Scholar]
- 35.Seamon KB, Padgett W, Daly JW. Proc Natl Acad Sci USA-Biol Sci. 1981;78:3363–3367. doi: 10.1073/pnas.78.6.3363. [DOI] [PMC free article] [PubMed] [Google Scholar]
- 36.Muneyama K, Bauer RJ, Shuman DA, Robins RK, Simon N. Biochemistry. 1971;10:2390–2395. doi: 10.1021/bi00788a033. [DOI] [PubMed] [Google Scholar]
- 37.Tamaoki T, Nomoto H, Takahashi I, Kato Y, Morimoto M, Tomita F. Biochem Biophys Res Commun. 1986;135:397–402. doi: 10.1016/0006-291x(86)90008-2. [DOI] [PubMed] [Google Scholar]
- 38.Chijiwa T, Mishima A, Hagiwara M, Sano M, Hayashi K, Inoue T, Naito K, Toshioka T, Hidaka H. J Biol Chem. 1990;265:5267–5272. [PubMed] [Google Scholar]
- 39.Ashcroft SJ, Bassett JM, Randle PJ. Diabetes. 1972;21:538–545. [PubMed] [Google Scholar]
Associated Data
This section collects any data citations, data availability statements, or supplementary materials included in this article.


