

Abstract
α-Tocopherol (αTocH), a member of the vitamin E family, is essential for normal neurological function. Despite the importance of αTocH transport into the CNS, transfer mechanisms across the blood–brain barrier (BBB) are not entirely clear. We here investigate whether afamin, a known αTocH-binding protein, contributes to αTocH transport across an in vitro model of the BBB consisting of primary porcine brain capillary endothelial cells (BCEC) and basolaterally cultured astrocytoma cells. Exogenously added afamin had no adverse effects on BCEC viability or barrier function and was transported across BCEC Transwell cultures. Furthermore, αTocH transport across polarized BCEC cultures to astrocytoma cells is facilitated by afamin, though to a lesser extent than by high-density lipoprotein-mediated transport, an essential and in vivo operating αTocH import pathway at the cerebrovasculature. We also demonstrate that porcine BCEC endogenously synthesize afamin. In line with these in vitro findings, afamin was detected by immunohistochemistry in porcine, human postmortem, and mouse brain, where prominent staining was observed almost exclusively in the cerebrovasculature. The demonstration of afamin mRNA expression in isolated brain capillaries suggests that afamin might be a new family member of binding/transport proteins contributing to αTocH homeostasis at the BBB in vivo.
Keywords: astrocytes, brain microvascular endothelial cells, high-density lipoprotein, neurovascular unit, vitamin E
Members of the vitamin E family [α-, β-, γ-, and δ-tocopherols and –trienols] are transported in association with lipoproteins and/or specific carrier proteins (Kayden and Traber 1993). Dietary vitamin E is absorbed in the proximal intestine, assembled with chylomicrons, and secreted into lymphatic vessels. Chylomicrons are hydrolyzed in the circulation, and chylomicron remnants are subjected to receptor-mediated endocytosis by the liver. This organ discriminates between various members of the vitamin E family and preferentially incorporates α-tocopherol (αTocH) into newly synthesized very low-density lipoproteins [VLDL; a process facilitated by αTocH transfer and binding proteins (for review see Kaempf-Rotzoll et al. 2003; Traber and Atkinson 2007], which are subsequently secreted into the circulation. Low-density lipoprotein (LDL) and/or high-density lipoprotein (HDL)-associated αTocH is further delivered to cells/tissues/organs, where it is taken up by receptor-mediated pathways.
We have previously shown that uptake of HDL-associated αTocH by brain capillary endothelial cells (BCEC) via scavenger receptor class B, type I (SR-BI), an HDL receptor (Zannis et al. 2006), is a major uptake pathway across the blood–brain barrier (BBB) (Goti et al. 2001). In line with our in vitro results, Mardones et al. (2002) subsequently demonstrated that SR-BI−/− mice have significantly reduced (up to 70%) αTocH levels in the brain and other organs. However, although significantly reduced, αTocH was still present in brains of SR-BI−/− mice, indicating the existence of backup transport mechanisms. One alternative route is the uptake of lipoprotein-associated αTocH via the LDL receptor pathway, which operates at the BBB and mediates transcytosis across the cerebrovasculature (Dehouck et al. 1997). Along this line it is noteworthy that apolipoprotein E (a high-affinity ligand for the LDL receptor) plays an important regulatory role in αTocH turnover and depletion in the CNS (Vatassery et al. 2007, 2008).
Another potential candidate for αTocH transport into the CNS is afamin. Afamin is a member of the albumin superfamily, which comprises albumin, vitamin D-binding protein, α-fetoprotein, and afamin (Lichenstein et al. 1994). It was recently shown that afamin concentrations closely correlate with the αTocH content in CSF but not with plasma, suggesting a transport function of afamin for αTocH in CSF (Jerkovic et al. 2005). Afamin has a relatively low binding affinity but a high binding capacity for both α- and γTocH with a binding dissociation constant of approx. 18 μM, indicating that afamin acts as a vitamin E transport protein via multiple binding sites (Jerkovic et al. 2005).
During this study, we tested whether and to what extent afamin undergoes transport across an in vitro model of the BBB, thereby facilitating delivery of protein-bound αTocH to astrocytes cocultured in the basolateral compartment of Transwell inserts. If operative in vivo, this pathway could represent a new transport route for αTocH delivery to the CNS.
Materials and methods
Materials
Earl’s medium M199, penicillin/streptomycin (P/S), gentamycin, and trypsin were from Gibco (Berlin, Germany). Ox serum was from PAA Laboratories (Linz, Austria). Plastic ware for cell culture was from Costar (Vienna, Austria). 125INa (specific activity 629 GBq/mmol) was from NEN (Vienna, Austria) and [14C]all-rac-αTocH ([14C]αTocH; specific activity 2.07 GBq/mmol) was from Amersham (Tokyo, Japan). Opti-Fluor® scintillation cocktail was from Perkin Elmer (Vienna, Austria). PD-10 size-exclusion columns and enhanced chemiluminescence plus western blotting detection reagents were from Amersham Pharmacia Biotech (Vienna, Austria). Polyvinylidene difluoride (PVDF) transfer membrane (BioTrace™PVDF) was from Pall Corporation (Vienna, Austria). Protease inhibitors were from Sigma Aldrich (Vienna, Austria). RIPA (50 mM Tris, 150 mM NaCl, 1 mM EDTA, 1% NP-40, 200 mM Na3VO4, 200 mM NaF, pH 7.4) buffer was from Roche (Vienna, Austria). The Laboratory-Tek® Chamber Slide™ System was from Nalge Nunc International (Naperville, IL, USA) and Mowiol was from Calbiochem-Novabiochem (La Jolla, CA, USA). RNeasy kit was from Qiagen (Vienna, Austria). Turbo Rnase-free Dnase was from Ambion (Mannheim, Germany), dNTPs, RNA guard, and random hexamer primers were from Amersham Biosciences (Vienna, Austria), dithiothreitol, SuperScript II reverse transcriptase (RT) and First Strand Buffer were from Life Invitrogen (Vienna, Austria), Biotherm Taq DNA polymerase and PCR buffer were from Genecraft (Cologne, Germany), and primers used for amplification of porcine afamin and megalin were self-designed and obtained from Life Invitrogen. All solvents were from Sigma (Vienna, Austria) and all other chemicals were from Roche.
Production and isolation of recombinant afamin
Afamin was over-expressed in chinese hamster ovary cells using the pEF-neo vector containing human or mouse afamin cDNA under regulation of the EF-1A promoter as described (Jerkovic et al. 2005). Afamin expression/secretion was monitored by a specific ELISA (Jerkovic et al. 2005) and the recombinant His6-tagged protein was isolated from supernatants of cells cultivated under serum-free conditions by Ni-mediated adsorption chromatography.
Primary and secondary antibodies
Polyclonal rabbit and monoclonal mouse anti-human afamin antibodies were obtained by immunizing respective animals with afamin purified from human plasma (Jerkovic et al. 2005). Monoclonal afamin antibody was purified from serum-free hybridoma culture supernatants by Protein A Sepharose chromatography. Polyclonal anti-mouse afamin antibody was obtained by immunizing rabbits with purified recombinant murine afamin. Cyanine (Cy)-2 and Cy-3-labeled goat anti-rabbit IgG was from Dianova (Hamburg, Germany), mouse anti-human glial fibrillary acidic protein (GFAP), rabbit anti-human von Willebrand factor (vWF), horseradish peroxidase (HRP)-conjugated goat anti-rabbit IgG, non-immune mouse and rabbit serum, and antibody diluent were from Dako (Carpinteria, CA, USA). Cy-2-labeled goat anti-mouse IgG was from Jackson (Hamburg, Germany). Goat anti-human megalin antiserum was kindly provided by Dr. Thomas Willnow.
Sodium dodecyl sulfate–polyacrylamide gel electrophoresis and immunoblotting
Sodium dodecyl sulfate–polyacrylamide gel electrophoresis (SDS–PAGE) was performed on proteins that were extracted with RIPA buffer according to the protocol of Upstate Cell Signaling (50 mM Tris, pH 7.5, 150 mM NaCl, 1 mM Na3VO4, 1 mM NaF, 1 mM EDTA, 1 mM phenylmethylsulfonyl fluoride, and protease inhibitors) (Frankfurt, Germany). BCEC proteins were separated by 5% (megalin) or 8% (afamin) SDS–PAGE under reducing conditions (150 V, 90 min). To analyze afamin secretion by BCEC, cellular supernatants were centrifuged (17 950 g) to remove cell debris. Proteins were then precipitated with 3 M trichloroacetic acid (0.1 mL/mL supernatant, 30 min, 4°C), pelleted by centrifugation (17 950 g), washed with 0.5 mL acetone, re-suspended in 40 μL sample buffer (0.1 M Tris/HCl, pH 6.8, 4% SDS, 15% glycerol, and 5% mercaptoethanol) and incubated at 95°C for 5 min before application to gels. For immunoblotting, proteins were electrophoretically transferred to PVDF membranes at 150 mA and 4°C for 60 min (afamin) or 120 min (megalin). Polyclonal rabbit antihuman afamin (1 : 2000) or goat anti-human megalin (1 : 1000) were used as primary antibodies. Bands were visualized with HRP-conjugated goat anti-rabbit (1 : 5000) or rabbit anti-goat IgG (1 : 5000) and subsequent enhanced chemiluminescence development. Densitometric evaluation was performed using camera, scanner, and software from Herolab (Heidelberg, Germany).
Isolation of human high-density lipoprotein
Human, apolipoprotein E-poor HDL subclass 3 (d = 1.125–1.21 g/mL) was prepared by density ultracentrifugation of plasma obtained from normolipidemic donors (Sattler et al. 1994). HDL was recovered from the tubes and desalted on PD-10 columns. Protein content was determined using the Bradford assay. The presence of afamin in HDL was analyzed by western blotting. As porcine lipoproteins contain significantly less αTocH when compared with their human counterparts (and thus are more susceptible to inadvertent oxidation during isolation and handling; Knipping et al. 1990) we decided to use human lipoproteins. As HDL3 is devoid of afamin (see Fig. S1), this HDL subclass was used during the present study.
Transwell cultures of brain capillary endothelial cells
For isolation of BCEC, porcine brains were obtained from freshly slaughtered pigs. After removing the meninges and secretory areas, the gray and white matter of the brain cortex was minced. BCEC were isolated by enzymatic digestion and subsequent centrifugation steps as described (Panzenboeck et al. 2006). To establish polarized cultures, cells were seeded on calf-skin collagen-coated 12-well Transwell culture trays at a density of 40 000 cells/cm2. Tight junction formation was induced in Dulbecco’s modified Eagle’s medium/Ham’s F12 medium supplemented with 500 nM hydrocortisone for barrier induction (Hoheisel et al. 1998), 1% P/S, and 0.25% glutamine. After 3 days in culture, the tightness of the monolayer was assessed by measuring the transendothelial electrical resistance (TEER) using an Endohm tissue resistance measurement chamber. TEERs of coated, cell-free filters were subtracted from Transwell TEER to achieve the actual resistance of the cell monolayers. Functionally, increasing TEER values indicate the formation of intact tight junctions and provide a measure for the barrier function (i.e. BBB phenotype) of BCEC in Transwell cultures.
Brain capillary endothelial/astrocytoma cell cocultures
To establish cocultures, BCEC were cultivated in Transwell inserts as described above and assembled with human astrocytoma cells (CCF-STTG1; ATCC, Rockville, MD, USA) that were kept separately in monolayers in RPMI 1640 medium [containing 1% P/S and 10% fetal calf serum (FCS)]. When BCEC reached TEER values of ≥200 ohm × cm2 and astrocytes were almost confluent, cocultures were assembled in the Transwell system and incubated in M199 (containing 10% ox serum and 1% P/S) for 1 day, then M199 medium was replaced with Dulbecco’s modified Eagle’s medium/Ham’s F12 medium supplemented with 500 nM hydrocortisone, 1% P/S, and 0.25% glutamine. To test for effects of afamin and HDL on BCEC viability the 3-(4,5-dimethylthiazol-2-yl)-2,5-diphenyltetrazolium bromide (MTT) assay (Rauh et al. 2008) was used (see below).
Isolation of brain capillaries
Porcine capillaries
Porcine brains were obtained and processed as described above. After removal of the meninges and secretory areas, the gray and white matter of the brain cortex was minced. Capillaries were isolated by enzymatic digestion with dispase (70 mg/brain) and gentle stirring (water bath 37°C for 1 h). After mixing with dextran solution (final concentration 10% w/v) and subsequent centrifugation (6800 g, 10 min, 4°C), the pellets were re-suspended in preparation medium (M199, antibiotics) without serum. Capillaries were checked by light microscopy and carefully transferred on top of a Percoll gradient (15 mL of 1.07 g/mL; 20 mL of 1.03 g/mL) and centrifuged at 1300 g for 10 min in a swinging bucket rotor. Capillaries were recovered from the interphase of the gradient and washed in serum-free medium to remove Percoll. Intactness of capillaries was verified by light microscopy. An aliquot (approx. 7 mg protein/mL) was lysed in RIPA buffer for protein analysis and a second aliquot was lysed in RNA-lysis buffer (Qiagen) containing β-mercaptoethanol (10 μL/mL) for RNA isolation.
Murine capillaries
Mice (C57BL/6; 10 weeks) were killed by cervical dislocation. Brains were transferred into phosphate-buffered saline (PBS; containing 1% P/S) on ice and dissected mechanically. After addition of 5 mg dispase, brains in a final volume of 5 mL serum-free M199 medium were stirred in a water bath at 37°C for 1 h. The digestion was controlled microscopically to obtain intact capillaries. Then, 7.5 mL dextran was added and the solution was centrifuged at 11 000 rpm (14 400 g) for 15 min (4°C). After microscopic control, the pellet was re-suspended in 2 mL serum-free preparation medium and transferred to a Percoll gradient consisting of 4 mL of 1.03 g/mL density and 3 mL of 1.07 g/mL density Percoll solution. Following a centrifugation step at 900 rpm (970 g; 10 min at 22°C without brake), the interphase was transferred into a fresh tube, washed in serum-free medium, and lysed in RNA-lysis buffer with β-mercaptoethanol for RNA isolation.
Radiolabeling of afamin and high-density lipoprotein
High-density lipoprotein labeling was performed with 125INa using N-Br-succinimide as the oxidizing agent (Sinn et al. 1988). Routinely, 1 mCi 125INa was used to label 5 mg HDL protein (resulting in specific activities between 200 and 400 cpm per ng HDL protein) as described (Balazs et al. 2004). Afamin was labeled with 125INa in a similar manner and resulted in specific activities between 300 and 400 cpm/ng protein. Non-(lipo)protein associated radioactivity was removed by size exclusion chromatography on PD-10 columns.
High-density lipoprotein labeling with [14C]αTocH was performed by adding [14C]αTocH as ethanolic solution (30 μL per 1.5 mg protein in 2 mL PBS) followed by incubation at 37°C (3 h under argon in a shaking water bath; specific activities of 10–20 cpm/ng HDL protein). Afamin was also labeled with [14C]αTocH by incubating the protein solution (0.4 mg protein/mL) in PBS with the tracer (30 μL) resulting in specific activities of 15–20 cpm/ng protein. Non-(lipo)protein-associated [14C]αTocH was removed by size-exclusion chromatography on PD-10 columns.
Cell experiments
For transcytosis experiments, 125I- and [14C]αTocH-labeled afamin and HDL were used for comparative reasons and added (at the indicated concentrations) to the apical compartment. At the time points indicated the medium of the basolateral compartment was removed and the radioactivity was counted on a γ- or β-counter. To assess the amount of BCEC-associated afamin or HDL, polycarbonate filters were washed, cut from the insert, lysed in NaOH (0.3 M), and the radioactivity was counted. The lysates were also used to determine the cellular protein content using the Lowry method. The radioactivity associated with basolateral astrocytoma cells was measured by γ- or β-counting of NaOH (0.3 M) lysates. Experiments shown were performed at least in triplicate and results shown represent mean ± SD.
3-(4,5-Dimethylthiazol-2-yl)-2,5-diphenyltetrazolium bromide test
To test effects of afamin on BCEC viability the MTT system was used. Cells were incubated in the presence of the indicated afamin concentrations for 6 h, then 50 μL of the MTT solution was added to the cells (in 500 μL medium) and incubated for 2 h at 37°C. After 1 h monolayers were washed (PBS) and lysed in propanol : HCl (0.4 M) (25 : 1, v/v; 300 μL). Lysates were transferred to Eppendorf tubes and centrifuged to remove cellular debris [13 000 rpm (17 950 g), 2 min]. Then, 100 μL of the supernatant was transferred to 96-well microtiter plates and absorbance was measured at 570 nm and corrected for background absorption (650 nm).
RNA isolation and reverse transcriptase-PCR
Total RNA from pBCEC or brain capillaries (porcine and murine) was isolated according to the RNeasy protocol (Qiagen). Three micrograms of total RNA was treated with Rnase-free Turbo Dnase (Ambion). Equal amounts of RNA were used as a template for first-strand cDNA synthesis (the reaction mix contained 0.5 mM dNTPs, 27.6 U/μL of RNAguard, 4 μM random hexamer primers, 10 mM dithiothreitol, 1x First Strand Buffer, and 200 U Superscript II RT). Reverse transcription was performed according to the manufacturer’s suggestions (Life Invitrogen manual for superscript II first-strand cDNA synthesis).
Human afamin sequence was blasted and primers were generated from the obtained pig sequences high scoring segment pair (HSP) sus scrofa chromosome 8 clone CH242-230P13, 15 unordered pieces (CU606945.2). Primers were designed using Primer Design 2.0 (Scientific & Educational Software, Cary, NC, USA). The RT-PCR reaction was performed using 1 μL of cDNA in a 50 μL PCR reaction containing the following solutions: 0.2 mM dNTPs, 0.5 μM oligonucleotide primers (for sequences see Table S1), 1x PCR buffer and 0.2 U of Biotherm Taq DNA polymerase (Genecraft). PCR conditions were as follows: 2 min at 94°C for initial denaturation, followed by 50 cycles of denaturation, 30 s at 94°C; annealing, 30 s at 55°C; extension 20 s at 72°C with a final extension of 5 min at 72°C. RT-PCR products were separated on 1% agarose gels in 0.5x Tris-Acetate-EDTA (TAE) buffer and pictures were taken with the Kodak EDAS photo system (purchased from UniLab, Vienna, Austria). Sequence analysis on a CEQ 8000 (Beckman Coulter, Vienna, Austria) instrument was used to confirm the identity of PCR products.
Immunofluorescence
Brain capillary endothelial cells were cultured on Permanox chamberslides. The cells were incubated with afamin (10 μg) for 2 h at 4°C (binding) or 37°C (binding and internalization). Coverslips were washed twice in PBS and dried for 2 h, fixed in acetone for 5 min at 25°C, re-hydrated in PBS for 5 min, and treated with protein blocking solution for 20 min. Coverslips were incubated with primary afamin antibodies [rabbit anti-afamin antiserum (1 : 50)] for 30 min. Coverslips were rinsed with PBS and incubated with Cy-3-conjugated secondary antibodies (1 : 300) for 30 min, rinsed again and mounted with Mowiol. Confocal laser scanning microscopy was performed on a Leitz/Leica TCSSP2 microscope (Leica Lasertechnik GmbH, Heidelberg, Germany).
Double immunofluorescence
Fresh porcine brains (obtained from the local slaughterhouse) were immediately frozen in a cryostat (Microm HM 500 OM; Microm, Walldorf, Germany), supported by tissue freezing medium (Tissue Tec OCT-compound; Miles, Elkhard, IN, USA). Serial cryosections (5 μm) were collected on glass slides, air-dried for 2 h at 22°C, fixed in acetone for 5 min at 22°C, and stored at −40°C until required.
For double immunofluorescence the sections were thawed, air dried, and fixed in acetone for 5 min at 22°C. After re-hydrating in PBS, pH 7.4, sections were blocked with UV ultra block (Lab Vision, Fremont, CA, USA) for 10 min and incubated for 30 min with either a rabbit anti-human afamin (diluted with antibody diluent; 1 : 400, Dako) or a rabbit anti-human vWF (1 : 500) antibody. The samples were rinsed in PBS, and incubated with a Cy-3-labeled goat anti-rabbit antibody (1 : 300) for 30 min. Afterwards a further incubation step using a mouse anti-human GFAP (1 : 20) followed by a Cy-2-labeled goat anti-mouse antibody (1 : 300) for 30 min was performed. The sections were rinsed in PBS, mounted with Mowiol, and analyzed on a confocal laser scanning microscope (Leica SP2), using the 488 nm laser line for the excitation of Cy-2 and the 543 nm line for Cy-3. Detection settings were: 500–535 nm for Cy-2 and 555–620 nm for Cy-3. All incubation steps were performed in a moist chamber at 25°C. PBS was used to wash the slides between the incubation steps. Negative controls were performed by replacing the primary antibodies with non-immune rabbit or -mouse serum or omitting the primary antibody.
Immunohistochemistry of porcine and murine brain sections
(i) Porcine brain cryosections (5 μm), postmortem sections from hippocampus (40 μm), and brain slices of striatum and cortex from C57BL/6 mice (20 μm) were chosen for immunohistochemical localization of afamin in brain tissues.
Porcine brain sections were treated as described above and after blocking they were incubated with either a rabbit polyclonal anti-vWF antiserum (1 : 500) or the rabbit anti-afamin antiserum (1 : 400) for 30 min at 22°C, followed by a goat anti-rabbit HRP-conjugated IgG (1 : 500). The slides were developed with aminoethylcarbazole (Lab Vision) for 4 min at 25°C. The sections were counterstained with Mayer’s hemalum and mounted with Kaiser’s glycerolgelatine (Merck, Darmstadt, Germany). Negative controls were performed with non-immune rabbit serum. Sections were viewed through an Axiphot microscope and photos were taken using an AxioCam HRC digital camera (Zeiss, Oberkochen, Germany).
(ii) Mouse brain sections were prepared from 6-month-old C57BL/6 mice that were killed using an overdose of ketamine. Animals were perfused with 50 mM PBS followed by 4% p-formaldehyde in 50 mM PBS at 120 mmHg for 5 min. Brains were removed, fixed overnight in 4% p-formaldehyde, transferred to ascending concentrations of sucrose (5/10/20%), and frozen in isopentane at −80°C. Cryostat sections (20 μm) were thaw-mounted onto poly-l-lysine-coated slides, rinsed with Tris-buffered saline (TBS; 150 mM NaCl and 100 mM Tris, pH 7.4) and permeabilized in 0.2% Triton X-100 in TBS (TBS-T). Endogenous peroxidase was blocked in 0.6% H2O2/25% methanol in TBS for 25 min, followed by washes with TBS and TBS-T. Slides were pre-incubated in 2% non-immune goat serum/2% bovine serum albumin/0.2% skim milk powder in TBS-T, and incubated overnight with anti-mouse afamin antiserum (1 : 1000 in 1% bovine serum albumin in TBS-T). Sections were washed for 1 h with TBS-T and incubated with HRP-conjugated goat anti-rabbit IgG (#0448, 1 : 500; Dako). After washing with TBS, immunoreactive areas were visualized using the diaminobenzidine method. Sections were dehydrated in an ascending series of ethanol (70/96/100%), cleared in xylene, and sealed with Entellan (Merck). Imaging was performed with a Zeiss Axioplan 2 imaging microscope equipped with an AxioCam camera (Zeiss).
Results
First, the effects of afamin and HDL on viability and barrier function of BCEC were assessed. During these experiments it became evident that neither afamin nor HDL adversely affects cell viability up to 6 h, as monitored by the MTT assay (Fig. 1a). To study potential effects of HDL and afamin on BCEC barrier function, TEER measurements were performed in BCEC/astrocyte cocultures cultivated in the presence of hydrocortisone (a barrier-inducing agent; Hoheisel et al. 1998) plus afamin (Fig. 1b) or HDL (Fig. 1c). These experiments revealed that neither afamin nor HDL adversely affects barrier function. Western blot analyses revealed that HDL isolated by density gradient ultracentrifugation is devoid of afamin (Fig. S1).
Fig. 1.

Effects of afamin and HDL on BCEC cell viability and barrier function. (a) BCEC were incubated in the absence or presence of the indicated concentrations of afamin (white bars) or HDL (black bars) in 12-well plates for 6 h. The plates were washed, and 50 μL of the MTT solution was added to cells in 500 μL medium. After 1 h the cells were washed again, lysed, and processed for MTT measurement as described in Materials and methods. Results are mean ± SD (n = 3) and expressed as percentage of control. (b and c) BCEC were cultured in 12-well Transwell clusters in the presence of hydrocortisone (500 nM; 18 h) to induce tight junction formation. After this incubation the TEER of the corresponding Transwells was measured. Cells were then incubated in the absence (open symbols) or presence (closed symbols) of afamin (b) or HDL (c) for 4 h at the indicated concentrations, followed by TEER measurement to determine effects of the added compounds on barrier function. Results are mean ± SD (n = 4).
To investigate binding/uptake of afamin by BCEC, Transwell cultures were incubated in the presence of increasing concentrations of 125I-labeled afamin. Uptake rates were compared with those obtained with 125I-labeled HDL. These experiments revealed that cell association of 125I-afamin was lower than for 125I-HDL at all concentrations used. At the highest protein concentrations the corresponding values for cell association by BCEC were 776 ± 168 (afamin) and 1503 ± 47 ng (HDL) protein/mg cell protein (Fig. 2a). To assess the degree of afamin and HDL transcytosis the radioactivity in the basolateral medium was counted. These experiments demonstrated that afamin transport across polarized BCEC layers increased in a concentration-dependent manner. However, at all concentrations afamin transcytosis was lower than observed for HDL (Fig. 2b). At the concentrations used, HDL transcytosis rates were almost saturable, while afamin transport linearly increased, resulting in final transcytosis rates of 67 ± 24 (afamin) and 211 ± 24 (HDL) ng/1.5 mL medium. These values correspond to apparent permeability coefficients of 3.1 × 10⁻⁷ ± 1.1 × 10⁻⁷ (afamin) and 9.9 × 10⁻⁷ ± 1.2 × 10⁻⁷ (HDL) cm/s at the highest concentration added. Finally, uptake rates of both radioactively labeled compounds were assessed in astrocytes cultured in the basolateral compartment of Transwells, where linear uptake of both tracers was observed (Fig. 2c). Maximum cell association at the highest protein concentrations used was 11 (afamin) and 24 ng (HDL) protein/mg cell protein.
Fig. 2.

Transport of 125I-labeled afamin and HDL in BCEC/astrocytoma cocultures. BCEC were cultured on polycarbonate filter inserts and astrocytoma cells in the basolateral compartment. After induction of tight junctions, 125I-labeled afamin or HDL was added at the concentrations indicated. (a) After 4 h the polycarbonate filter inserts containing BCEC were washed, cut out, and lysed in NaOH (0.3 M) to determine the cell associated radioactivity. An aliquot was used to determine the cellular protein content. (b) The basolateral medium was removed and aliquots were counted on a γ-counter. (c) Astrocytes were washed, lysed in NaOH, and processed as described for BCEC. Results are mean ± SD (n = 3).
Next, the efficacy of tracer uptake/transport from [14C]αTocH-labeled afamin or HDL to (i) BCEC, (ii) the medium in the basolateral compartment, and (iii) uptake by basolaterally cultured astrocytes was studied. Using [14C]αTocH-labeled afamin or HDL quantitatively similar results as observed with 125I-labeled proteins emerged: uptake of [14C]αTocH-loaded HDL by BCEC was greater than afamin uptake (Fig. 3a; 1556.4 ± 589.1 vs. 2028.3 ± 332.3 ng/mg cell protein; afamin and HDL, respectively). αTocH transport across endothelial monolayers to the basolateral compartment was greater for HDL and accounted for 18 ± 1.6 (afamin) and 37 ± 1.3 (HDL) ng protein/1.5 mL medium. These values correspond to apparent permeability coefficients of 8.4 × 10⁻⁸ ±7 × 10⁻⁹ and 1.7 × 10⁻⁷ ± 6 × 10⁻⁹ cm/s for afamin and HDL (Fig. 3b). Moreover, uptake of [14C]αTocH-afamin by astrocytoma cells in the basolateral compartment (Fig. 3c) was lower than for HDL (64 ± 12 and 85 ± 27 ng afamin or HDL/mg cell protein).
Fig. 3.

Transport of [14C]αTocH-labeled afamin and HDL in BCEC/astrocytoma cell cocultures. Experiments were performed exactly as described in Fig. 2 except that [14C]αTocH-labeled afamin and HDL were used to determine: (a) uptake by BCEC, (b) transcytosis to the basolateral compartment, and (c) uptake by astrocytoma cells. Results are mean ± SD (n = 3).
The next set of experiments aimed to confirm afamin uptake at the cellular level using immunocytochemistry. Prior to uptake experiments BCEC were cultured in serum-free medium and subsequently incubated in the absence or presence of afamin at 4°C (to detect binding only) and 37°C (to visualize internalization) (Fig. 4). Surprisingly, these experiments revealed prominent afamin staining in cells that were incubated in the absence of exogenously added afamin (Fig. 4a and c). The addition of purified afamin to the culture medium had no effect on fluorescence intensities at 4°C (Fig. 4b), while immunofluorescence staining was strongly enhanced at 37°C (Fig. 4d), indicating increased cell association/internalization. These observations could be because of (i) antibody cross-reactivity or (ii) endogenous afamin synthesis by BCEC. The first possibility was excluded as pre-adsorption of the antibody with recombinant afamin resulted in almost complete loss of immunofluorescence (Fig. 4e), comparable to auto-fluorescence levels (Fig. 4f).
Fig. 4.

Immunocytochemical evidence for endogenous afamin expression by BCEC. BCEC were cultured for 24 h under serum-free conditions on collagen-coated chamber slides. Cells were then incubated at either 4°C (a and b) or 37°C (c and d) in the absence (a and c) or presence (b and d) of afamin (10 μg/mL). Detection was performed with rabbit anti-human afamin antiserum followed by 30 min incubation with Cy3-labeled goat anti-rabbit IgG. (e) Negative control (primary antibody pre-adsorbed with afamin at a molar ratio of 1 : 25); (f) autofluorescence.
To test for endogenous afamin synthesis by BCEC, RT-PCR analysis was performed. For these studies RNA from porcine liver was used as a positive control and primer pairs for afamin at the expected amplicon sizes were designed (Fig. S2). Afamin mRNA expression in BCEC was detected with primer pair 1/2 (Table S1). The expected amplicon of 767 bp was detected in three different BCEC preparations (Fig. 5a), and its identity was confirmed by sequencing (Fig. S3). However, it is noteworthy that also larger (lanes 3 and 4) and smaller (lane 4) products were detected (Fig. 5a). Whether this is because of alternative splicing (frequently observed in the CNS) is currently under investigation.
Fig. 5.
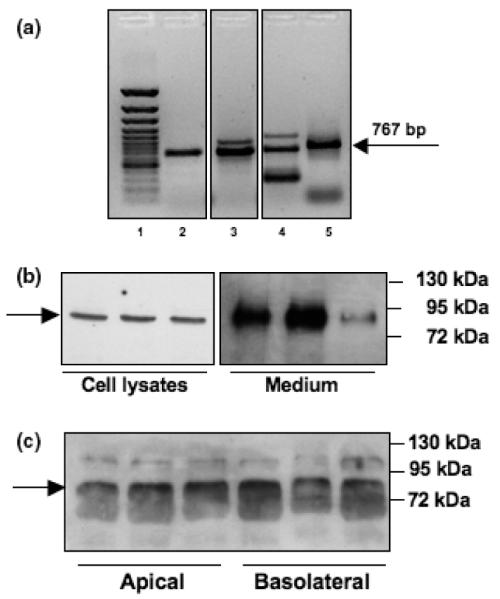
Synthesis of endogenous afamin by BCEC. (a) Afamin mRNA expression in porcine BCEC. Lane 1: Gene Ruler 100 bp ladder; lane 2–4: BCEC cultures established from different porcine brains (n = 3; primer pair 1/2); lane 5: positive control (pig liver). (b) Afamin protein expression by porcine BCEC. Cell associated and secreted afamin was analyzed by western blot experiments of trichloroacetic acid-precipitated proteins (30 μg total protein/lane) obtained from BCEC cell lysates and the corresponding supernatants, respectively, collected after 24 h incubation in serum-free medium. Triplicate samples are shown. The arrow indicates immunoreactive afamin. (c) Polarized secretion of afamin was determined from trichloroacetic acid precipitates of the apical and basolateral media of Transwell cultures and subsequent western blotting. Triplicate samples are shown. The arrow indicates afamin.
Next, afamin expression by BCEC kept under serum-free conditions for 24 h prior to analysis was followed at the protein level. Again, as shown by immunocytochemistry (Fig. 4), endogenous expression of afamin was confirmed in BCEC cell lysates as well as in the culture medium using western blot analysis (Fig. 5b). The expected molecular mass of approx. 85 kDa was detected in three individual BCEC preparations. To get an indication of whether afamin secretion occurs in a polarized manner, proteins in media from the apical and basolateral compartment of Transwell cultures were precipitated with trichloroacetic acid, separated by SDS–PAGE and analyzed by western blotting (Fig. 5c). In these samples an immunoreactive band at approx. 85 kDa and a second, larger protein of unknown identity (approx. 110 kDa) were detected. No preferential polarized secretion to either compartment was observed during these studies.
Finally, immunohistochemical and immunofluorescence analysis of porcine and mouse brain was performed to localize sites of preferential afamin expression. An antiserum raised against the endothelium specific marker vWF was used to establish the morphological appearance of small blood vessels in porcine brain sections (Fig. 6a). The immune reaction with the afamin antiserum gave a nearly identical staining pattern as for vWF, whereas in the control slides, incubation with non-immune serum did not show any reaction at all (data not shown). In a higher magnification the staining could clearly be localized in the structures forming small blood vessels (Fig. 6a). Double immunofluorescence staining was performed for afamin, together with the astrocyte marker GFAP or the endothelial marker vWF on sections of porcine brain (Fig. 6b). GFAP immunofluorescence from astrocytes was observed in fine processes projecting to vessels and forming end-feet around them. In an oblique longitudinal section that was cut through the wall of a blood vessel intense immunofluorescence could be observed for vWF in the BCEC layer forming the barrier between the peripheral circulation and the brain. A serial section stained with the antibody against afamin showed the same intense signal on these cells. Sometimes a co-localization of the afamin signal and the one for astrocytic end-feet could be observed.
Fig. 6.

Immunohistochemical and immunofluorescence staining for afamin in porcine brain sections. (a) Porcine brain sections were thawed, air-dried, fixed in acetone, and re-hydrated in PBS. After blocking with UV ultra block, the sections were incubated with either a rabbit anti-human afamin (1 : 400) or a rabbit anti-human vWF (1 : 500), followed by an incubation step with a Cy-3 (red)-labeled goat anti-rabbit antiserum (1 : 300). Scale bars are indicated. (b) For double immunofluorescence porcine brain sections were thawed, airdried, fixed in acetone, and re-hydrated in PBS. After blocking, the sections were incubated with either a rabbit anti-human afamin antiserum (1 : 400) or a rabbit anti-human vWF (1 : 500), followed by an incubation step with a Cy-3 (red)-labeled goat anti-rabbit antiserum (1 : 300). Afterwards the sections were incubated with a mouse anti-human GFAP (1 : 20), followed by incubation with Cy-2 (green)-labeled goat anti-mouse antiserum (1 : 300); [b(i)] vWF (red) and GFAP (green); [b(ii)] GFAP (green) and afamin (red). Scale bars are indicated.
In mouse brain sections afamin staining was observed in large as well as small blood vessels throughout the cortex and the striatum (Fig. 7a). We have also obtained preliminary immunohistochemical evidence for afamin expression in the cerebrovasculature using human postmortem brain cryosections (Fig. S4). To further confirm that BCEC are capable of endogenous afamin synthesis in vivo, afamin mRNA expression was analyzed in isolated brain capillaries. RNA was isolated from murine (C57BL/6) and porcine brains. During these experiments mouse brains were pooled and brain capillaries were isolated as described in Materials and methods. Porcine capillaries were isolated from one brain. In mouse capillaries afamin expression was detected by nested PCR, while in porcine capillaries normal PCR was performed (Fig. 7b). In all cases the expected amplicon of 351 bp was detected, indicating that BCEC are capable of endogenous afamin synthesis in vivo. Western blot analyses revealed afamin protein expression in porcine capillaries (Fig. S5) and whole mouse brain (Fig. S6).
Fig. 7.

Evidence for afamin expression in mouse brain and isolated murine and porcine brain capillaries. (a) Immunohistochemical staining for afamin expression in mouse brain sections. Anti-mouse afamin antiserum was used at a dilution of 1 : 2000, followed by the secondary antibody used at 1 : 250. Afamin expression is observed in small and larger blood vessels throughout the brain section. The enlarged areas shown in [a(ii and iii)] are indicated by the boxes in [a(i and ii)], respectively. Scale bars are indicated. (b) Afamin mRNA expression in mouse and porcine brain capillaries. RT-PCR was performed with primer pairs 8/9 (866 bp) and 4/7 (351 bp) for nested PCR with cDNA of mouse and 4/7 for normal PCR with cDNA of porcine capillaries (Table S1). Prior to RT-PCR, capillaries were Dnase treated and EtOH precipitated. Three microliters of the PCR products and 2 μL of Lonza dye were applied to a Lonza gel and separated at 200 V. Lanes 1 and 8: Lonza bp standard; lane 2: mouse capillaries (three brains of C57BL/6 mice were pooled for capillary isolation; nested PCR); lane 3: mouse capillaries (four brains of C57BL/6 mice were pooled; nested PCR); lane 4: positive control (pig liver; nested PCR); lane 5 and 6: capillaries isolated from two porcine brains (PCR products generated with primer pair 4/7); lane 7: negative control (primers only; 4/7). Arrow indicates the position of the expected 351 bp amplicon.
Discussion
It is generally accepted that maintenance of sufficient cerebral αTocH concentrations is essential for normal neurological function. This became evident from in vitro experiments using various cerebral cell types, experimental animal models, as well as in patients suffering from vitamin E deficiency because of mutations in the αTocH transfer protein (αTTP). The cerebral αTocH pool is subject to strict homeostatic mechanisms (Kaempf-Rotzoll et al. 2003), which is highlighted by supplementation and depletion studies: First, megadose supplementation (100 times the recommended daily intake) in humans resulted in only marginally increased αTocH concentrations in the CSF (Pappert et al. 1996). In contrast, under depletion conditions the brain is the last organ that becomes deficient in αTocH (Vatassery et al. 1984).
Currently, three major pathways contributing to brain αTocH homeostasis are elucidated: (i) in vitro and in vivo studies clearly demonstrated a quantitatively important contribution of SR-BI-dependent αTocH uptake into the brain (Goti et al. 2001; Mardones et al. 2002; Balazs et al. 2004); (ii) phospholipid-transfer protein was shown to catalyze transfer of αTocH from lipoproteins to cells (Kostner et al. 1995) and phospholipid-transfer protein−/− mice have significantly reduced αTocH brain concentrations (30% less than littermates) (Desrumaux et al. 2005); (iii) The most devastating effects with regards to impaired αTocH supply of the CNS are observed in a knockout mouse model: Deletion of the αTTP gene results in severe αTocH depletion in all regions of the brain to a much greater extent than observed in mice fed a αTocH-deficient diet (Gohil et al. 2008). These animals suffer from severe ataxia and retinal degeneration (Yokota et al. 2001) although the onset of ataxia occurs in a time-delayed (approx. 9 months after birth) manner (Gohil et al. 2008). In patients suffering from ataxia associated with vitamin E deficiency disease, which is caused by mutations in the αTTP gene (Ben Hamida et al. 1993; Cavalier et al. 1998), neuronal loss, retinal atrophy, lipofuscin accumulation and retinitis pigmentosa were reported (Yokota et al. 2000, 2001). The neurological symptoms of ataxia associated with vitamin E deficiency patients may be stabilized and sometimes reversed in response to αTocH supplementation (Labauge et al. 1998; Benomar et al. 1999).
Cell culture experiments demonstrated a protective function of αTocH on brain endothelial cells, neurons and glial cells: In a rat model of ethanol-induced cerebral vascular damage it was demonstrated that αTocH prevented or at least greatly ameliorated cerebrovascular damage (Altura and Gebrewold 1996). A bioactive derivative of αTocH, αTocH-phosphate (Gianello et al. 2005), was shown to protect human BCEC from telomere shortening, thereby inducing cellular longevity (Tanaka et al. 2007). In microglia, αTocH-induced cell proliferation was, in contrast to BCEC, accompanied by telomere shortening (Flanary and Streit 2006). A protective function on cell viability was observed in astrocytes, where αTocH significantly reduced H2O2-induced apoptosis (Mazlan et al. 2006). Which mechanism(s) (anti-oxidant vs. signaling) mediate(s) the protective effects of αTocH is a matter of ongoing debate (for reviews see Azzi 2007; Traber and Atkinson 2007).
Our present findings may add another piece to the puzzle of αTocH uptake mechanisms: We show that afamin efficiently transports αTocH across an in vitro model of the BBB and that afamin is synthesized endogenously by BCEC. Our immunohistochemical studies revealed strong afamin staining in brain vessels of porcine, human postmortem and mouse brain sections. This infers some important in vivo implications: Afamin is present not only in plasma but also in follicular (Angelucci et al. 2006) and CSF (Jerkovic et al. 2005), where αTocH and afamin concentrations closely correlate. These findings provide indirect evidence that afamin could act as an in vivo αTocH carrier. In vitro binding experiments of αTocH to afamin demonstrated that afamin has 18 binding sites for αTocH, where binding occurs with positive cooperativity (Voegele et al. 2002). In line with αTocH-binding properties of afamin and neuroprotective properties of αTocH, it was shown that αTocH-loaded afamin displays neuroprotection on primary chicken neurons that were challenged by H2O2 or amyloid β25–35 (Heiser et al. 2002). These reports and our present findings suggest that afamin acts as a hitherto unidentified αTocH transport protein across the endothelial layer of the cerebrovasculature into the CNS. Although it is presently unclear how afamin contributes to αTocH transport in vivo, one might envisage that, in the cerebrovasculature, afamin could act as an intracellular binding/transport protein for αTocH that was delivered via receptor-mediated selective uptake. This mode of αTocH uptake at the BBB is facilitated by the HDL/SR-BI and the lipoprotein lipase/LDL system, both operative in vivo (Goti et al. 2002; Mardones et al. 2002).
Another remaining question concerns the uptake mechanism responsible for internalization of αTocH/afamin complexes by BCEC that are formed in the extracellular milieu. Along this line one could speculate that, because of its high homology to albumin, afamin could bind to cubilin and/or megalin. Both of these receptors are responsible for albumin transport in the kidneys (for review see: (Birn and Christensen 2006)) and both receptors are expressed at the BBB (Zlokovic et al. 1996) and in the CNS, respectively (Drake et al. 2004). Megalin mediates binding of apolipoprotein J to brain microvessels (Zlokovic et al. 1996) and plays a role as leptin transporter at the blood–CSF barrier (Dietrich et al. 2008). Besides albumin, megalin binds a variety of other ligands including vitamin D-binding protein, another member of the albumin gene family (Barth and Argraves 2001; Willnow and Nykjaer 2002). Results obtained during the present study revealed megalin mRNA (primers given in Table S2) and protein expression by porcine liver and BCEC (Fig. S7a–c). However, as reported by others (Chun et al. 1999), megalin expression is quite low at the mRNA and protein level. Irrespective of these observations the role of megalin as a potential afamin-binding protein is currently under investigation by our groups.
In summary, results of the present study indicate that afamin-bound αTocH is transported across an in vitro model of the BBB, resulting in further uptake by astrocytoma cells cultured in the basolateral compartment. Endogenous synthesis and secretion of afamin by primary pBCEC, expression of afamin mRNA, and protein in isolated brain capillaries, as well as the almost exclusive presence of afamin in the cerebrovasculature of porcine, human, and mouse brain sections strongly suggest that afamin could be involved in the regulation of αTocH uptake and transport at the BBB.
Acknowledgements
Financial support was provided by the Austrian Science Fund (FWF; Grant No. F3007, P19074-B05, P19464), the Austrian Research Promotion Agency (FFG; Grant No. Bridge P810994), and the Austrian National Bank (Jubiläumsfonds, Grant No. 12529). S. W. is funded by the FWF (F3007) and participates in the PhD program Molecular Medicine of the Medical University of Graz. We thank Dr Thomas Willnow (Max Delbrück Center for Molecular Medicine, Berlin, Germany) for providing the goat antihuman megalin antiserum. Excellent technical assistance by Linda Fineder, Anna Wieselthaler, and Helga Reicher is gratefully acknowledged.
Abbreviations used
- [14C]αTocH
[14C]all-rac-αTocH
- αTocH
α-tocopherol
- αTTP
αTocH transfer protein
- BBB
blood–brain barrier
- BCEC
brain capillary endothelial cells
- Cy-2
cyanine-2
- GFAP
glial fibrillary acidic protein
- HDL
high-density lipoprotein
- HRP
horseradish peroxidase
- LDL
low-density lipoprotein
- MTT
3-(4,5-dimethylthiazol-2-yl)-2,5-diphenyltetrazolium bromide
- P/S
penicillin/streptomycin
- PBS
phosphate-buffered saline
- PVDF
polyvinylidene difluoride
- RT
reverse-transcriptase
- SDS–PAGE
sodium dodecyl sulfate–polyacrylamide gel electrophoresis
- SR-BI
scavenger receptor class B, type I
- TBS
Tris-buffered saline
- TBS-T
TBS containing 0.2% Triton X-100
- TEER
transendothelial electrical resistance
- vWF
von Willebrand factor
Footnotes
Supporting information
Additional Supporting Information may be found in the online version of this article:
Supplementary data Afamin is synthesized by cerebrovascular endothelial cells and mediates α-tocopherol transport across an in vitro model of the blood–brain barrier.
Please note: Wiley-Blackwell are not responsible for the content or functionality of any supporting materials supplied by the authors. Any queries (other than missing material) should be directed to the corresponding author for the article.
References
- Altura BM, Gebrewold A. alpha-Tocopherol attenuates alcohol-induced cerebral vascular damage in rats: possible role of oxidants in alcohol brain pathology and stroke. Neurosci. Lett. 1996;220:207–210. doi: 10.1016/s0304-3940(96)13268-7. [DOI] [PubMed] [Google Scholar]
- Angelucci S, Ciavardelli D, Di Giuseppe F, Eleuterio E, Sulpizio M, Tiboni GM, Giampietro F, Palumbo P, Di Ilio C. Proteome analysis of human follicular fluid. Biochim. Biophys. Acta. 2006;1764:1775–1785. doi: 10.1016/j.bbapap.2006.09.001. [DOI] [PubMed] [Google Scholar]
- Azzi A. Molecular mechanism of alpha-tocopherol action. Free Radic. Biol. Med. 2007;43:16–21. doi: 10.1016/j.freeradbiomed.2007.03.013. [DOI] [PubMed] [Google Scholar]
- Balazs Z, Panzenboeck U, Hammer A, Sovic A, Quehenberger O, Malle E, Sattler W. Uptake and transport of high-density lipoprotein (HDL) and HDL-associated alpha-tocopherol by an in vitro blood–brain barrier model. J. Neurochem. 2004;89:939–950. doi: 10.1111/j.1471-4159.2004.02373.x. [DOI] [PubMed] [Google Scholar]
- Barth JL, Argraves WS. Cubilin and megalin: partners in lipoprotein and vitamin metabolism. Trends Cardiovasc. Med. 2001;11:26–31. doi: 10.1016/s1050-1738(01)00080-9. [DOI] [PubMed] [Google Scholar]
- Ben Hamida C, Doerflinger N, Belal S, et al. Localization of Friedreich ataxia phenotype with selective vitamin E deficiency to chromosome 8q by homozygosity mapping. Nat. Genet. 1993;5:195–200. doi: 10.1038/ng1093-195. [DOI] [PubMed] [Google Scholar]
- Benomar A, Yahyaoui M, Marzouki N, Birouk N, Bouslam N, Belaidi H, Amarti A, Ouazzani R, Chkili T. Vitamin E deficiency ataxia associated with adenoma. J. Neurol. Sci. 1999;162:97–101. doi: 10.1016/s0022-510x(98)00284-6. [DOI] [PubMed] [Google Scholar]
- Birn H, Christensen EI. Renal albumin absorption in physiology and pathology. Kidney Int. 2006;69:440–449. doi: 10.1038/sj.ki.5000141. [DOI] [PubMed] [Google Scholar]
- Cavalier L, Ouahchi K, Kayden HJ, Di Donato S, Reutenauer L, Mandel JL, Koenig M. Ataxia with isolated vitamin E deficiency: heterogeneity of mutations and phenotypic variability in a large number of families. Am. J. Hum. Genet. 1998;62:301–310. doi: 10.1086/301699. [DOI] [PMC free article] [PubMed] [Google Scholar]
- Chun JT, Wang L, Pasinetti GM, Finch CE, Zlokovic BV. Glycoprotein 330/megalin (LRP-2) has low prevalence as mRNA and protein in brain microvessels and choroid plexus. Exp. Neurol. 1999;157:194–201. doi: 10.1006/exnr.1999.7052. [DOI] [PubMed] [Google Scholar]
- Dehouck B, Fenart L, Dehouck MP, Pierce A, Torpier G, Cecchelli R. A new function for the LDL receptor: transcytosis of LDL across the blood–brain barrier. J. Cell Biol. 1997;138:877–889. doi: 10.1083/jcb.138.4.877. [DOI] [PMC free article] [PubMed] [Google Scholar]
- Desrumaux C, Risold PY, Schroeder H, et al. Phospholipid transfer protein (PLTP) deficiency reduces brain vitamin E content and increases anxiety in mice. FASEB J. 2005;19:296–297. doi: 10.1096/fj.04-2400fje. [DOI] [PubMed] [Google Scholar]
- Dietrich MO, Spuch C, Antequera D, Rodal I, de Yebenes JG, Molina JA, Bermejo F, Carro E. Megalin mediates the transport of leptin across the blood–CSF barrier. Neurobiol. Aging. 2008;29:902–912. doi: 10.1016/j.neurobiolaging.2007.01.008. [DOI] [PubMed] [Google Scholar]
- Drake CJ, Fleming PA, Larue AC, Barth JL, Chintalapudi MR, Argraves WS. Differential distribution of cubilin and megalin expression in the mouse embryo. Anat. Rec. A Discov. Mol. Cell Evol. Biol. 2004;277:163–170. doi: 10.1002/ar.a.10123. [DOI] [PubMed] [Google Scholar]
- Flanary BE, Streit WJ. Alpha-tocopherol (vitamin E) induces rapid, nonsustained proliferation in cultured rat microglia. Glia. 2006;53:669–674. doi: 10.1002/glia.20313. [DOI] [PubMed] [Google Scholar]
- Gianello R, Libinaki R, Azzi A, et al. Alpha-tocopheryl phosphate: a novel, natural form of vitamin E. Free Radic. Biol. Med. 2005;39:970–976. doi: 10.1016/j.freeradbiomed.2005.05.016. [DOI] [PubMed] [Google Scholar]
- Gohil K, Oommen S, Quach HT, Vasu VT, Aung HH, Schock B, Cross CE, Vatassery GT. Mice lacking alpha-tocopherol transfer protein gene have severe alpha-tocopherol deficiency in multiple regions of the central nervous system. Brain Res. 2008;1201:167–176. doi: 10.1016/j.brainres.2008.01.044. [DOI] [PMC free article] [PubMed] [Google Scholar]
- Goti D, Hrzenjak A, Levak-Frank S, Frank S, van der Westhuyzen DR, Malle E, Sattler W. Scavenger receptor class B, type I is expressed in porcine brain capillary endothelial cells and contributes to selective uptake of HDL-associated vitamin E. J. Neurochem. 2001;76:498–508. doi: 10.1046/j.1471-4159.2001.00100.x. [DOI] [PubMed] [Google Scholar]
- Goti D, Balazs Z, Panzenboeck U, Hrzenjak A, Reicher H, Wagner E, Zechner R, Malle E, Sattler W. Effects of lipoprotein lipase on uptake and transcytosis of low density lipoprotein (LDL) and LDL-associated alpha-tocopherol in a porcine in vitro blood–brain barrier model. J. Biol. Chem. 2002;277:28537–28544. doi: 10.1074/jbc.M203989200. [DOI] [PubMed] [Google Scholar]
- Heiser M, Hutter-Paier B, Jerkovic L, Pfragner R, Windisch M, Becker-Andre M, Dieplinger H. Vitamin E binding protein afamin protects neuronal cells in vitro. J. Neural Transm. Suppl. 2002;62:337–345. doi: 10.1007/978-3-7091-6139-5_32. [DOI] [PubMed] [Google Scholar]
- Hoheisel D, Nitz T, Franke H, Wegener J, Hakvoort A, Tilling T, Galla HJ. Hydrocortisone reinforces the blood–brain barrier properties in a serum free cell culture system. Biochem. Biophys. Res. Commun. 1998;244:312–316. doi: 10.1006/bbrc.1997.8051. [DOI] [PubMed] [Google Scholar]
- Jerkovic L, Voegele AF, Chwatal S, et al. Afamin is a novel human vitamin E-binding glycoprotein characterization and in vitro expression. J. Proteome Res. 2005;4:889–899. doi: 10.1021/pr0500105. [DOI] [PubMed] [Google Scholar]
- Kaempf-Rotzoll DE, Traber MG, Arai H. Vitamin E and transfer proteins. Curr. Opin. Lipidol. 2003;14:249–254. doi: 10.1097/00041433-200306000-00004. [DOI] [PubMed] [Google Scholar]
- Kayden HJ, Traber MG. Absorption, lipoprotein transport, and regulation of plasma concentrations of vitamin E in humans. J. Lipid Res. 1993;34:343–358. [PubMed] [Google Scholar]
- Knipping G, Rotheneder M, Striegl G, Esterbauer H. Antioxidants and resistance against oxidation of porcine LDL subfractions. J. Lipid Res. 1990;31:1965–1972. [PubMed] [Google Scholar]
- Kostner GM, Oettl K, Jauhiainen M, Ehnholm C, Esterbauer H, Dieplinger H. Human plasma phospholipid transfer protein accelerates exchange/transfer of alpha-tocopherol between lipoproteins and cells. Biochem. J. 1995;305:659–667. doi: 10.1042/bj3050659. [DOI] [PMC free article] [PubMed] [Google Scholar]
- Labauge P, Cavalier L, Ichalalene L, Castelnovo G. Friedreich’s ataxia and hereditary vitamin E deficiency. Case study. Rev. Neurol. (Paris) 1998;154:339–341. [PubMed] [Google Scholar]
- Lichenstein HS, Lyons DE, Wurfel MM, Johnson DA, McGinley MD, Leidli JC, Trollinger DB, Mayer JP, Wright SD, Zukowski MM. Afamin is a new member of the albumin, alpha-fetoprotein, and vitamin D-binding protein gene family. J. Biol. Chem. 1994;269:18149–18154. [PubMed] [Google Scholar]
- Mardones P, Strobel P, Miranda S, Leighton F, Quinones V, Amigo L, Rozowski J, Krieger M, Rigotti A. Alpha-tocopherol metabolism is abnormal in scavenger receptor class B type I (SR-BI)-deficient mice. J. Nutr. 2002;132:443–449. doi: 10.1093/jn/132.3.443. [DOI] [PubMed] [Google Scholar]
- Mazlan M, Sue Mian T, Mat Top G, Zurinah Wan Ngah W. Comparative effects of alpha-tocopherol and gamma-tocotrienol against hydrogen peroxide induced apoptosis on primary-cultured astrocytes. J. Neurol. Sci. 2006;243:5–12. doi: 10.1016/j.jns.2005.10.006. [DOI] [PubMed] [Google Scholar]
- Panzenboeck U, Kratzer I, Sovic A, Wintersperger A, Bernhart E, Hammer A, Malle E, Sattler W. Regulatory effects of synthetic liver X receptor- and peroxisome-proliferator activated receptor agonists on sterol transport pathways in polarized cerebrovascular endothelial cells. Int. J. Biochem. Cell Biol. 2006;38:1314–1329. doi: 10.1016/j.biocel.2006.01.013. [DOI] [PubMed] [Google Scholar]
- Pappert EJ, Tangney CC, Goetz CG, Ling ZD, Lipton JW, Stebbins GT, Carvey PM. Alpha-tocopherol in the ventricular cerebrospinal fluid of Parkinson’s disease patients: dose-response study and correlations with plasma levels. Neurology. 1996;47:1037–1042. doi: 10.1212/wnl.47.4.1037. [DOI] [PubMed] [Google Scholar]
- Rauh A, Windischhofer W, Kovacevic A, DeVaney T, Huber E, Semlitsch M, Leis HJ, Sattler W, Malle E. Endothelin (ET)-1 and ET-3 promote expression of c-fos and c-jun in human choriocarcinoma via ETB receptor-mediated Gi- and Gq-pathways and MAP kinase activation. Br. J. Pharmacol. 2008;154:13–24. doi: 10.1038/bjp.2008.92. [DOI] [PMC free article] [PubMed] [Google Scholar]
- Sattler W, Mohr D, Stocker R. Rapid isolation of lipoproteins and assessment of their peroxidation by high-performance liquid chromatography postcolumn chemiluminescence. Methods Enzymol. 1994;233:469–489. doi: 10.1016/s0076-6879(94)33053-0. [DOI] [PubMed] [Google Scholar]
- Sinn HJ, Schrenk HH, Friedrich EA, Via DP, Dresel HA. Radioiodination of proteins and lipoproteins using N-bromosuccinimide as oxidizing agent. Anal. Biochem. 1988;170:186–192. doi: 10.1016/0003-2697(88)90107-8. [DOI] [PubMed] [Google Scholar]
- Tanaka Y, Moritoh Y, Miwa N. Age-dependent telomere-shortening is repressed by phosphorylated alpha-tocopherol together with cellular longevity and intracellular oxidative-stress reduction in human brain microvascular endotheliocytes. J. Cell. Biochem. 2007;102:689–703. doi: 10.1002/jcb.21322. [DOI] [PubMed] [Google Scholar]
- Traber MG, Atkinson J. Vitamin E, antioxidant and nothing more. Free Radic. Biol. Med. 2007;43:4–15. doi: 10.1016/j.freeradbiomed.2007.03.024. [DOI] [PMC free article] [PubMed] [Google Scholar]
- Vatassery GT, Angerhofer CK, Peterson FJ. Vitamin E concentrations in the brains and some selected peripheral tissues of selenium-deficient and vitamin E-deficient mice. J. Neurochem. 1984;42:554–558. doi: 10.1111/j.1471-4159.1984.tb02713.x. [DOI] [PubMed] [Google Scholar]
- Vatassery GT, Quach HT, Smith WE, Santacruz KS, Roy S. Apolipoprotein e deficiency leads to altered brain uptake of alpha tocopherol injected into lateral cerebral ventricles. Biochim. Biophys. Acta. 2007;1772:797–803. doi: 10.1016/j.bbadis.2007.04.006. [DOI] [PubMed] [Google Scholar]
- Vatassery GT, Quach HT, Smith WE, Kuskowski M. Deletion of apolipoprotein E gene modifies the rate of depletion of alpha tocopherol (vitamin E) from mice brains. Biochim. Biophys. Acta. 2008;1782:414–420. doi: 10.1016/j.bbadis.2008.03.002. [DOI] [PubMed] [Google Scholar]
- Voegele AF, Jerkovic L, Wellenzohn B, Eller P, Kronenberg F, Liedl KR, Dieplinger H. Characterization of the vitamin E-binding properties of human plasma afamin. Biochemistry. 2002;41:14532–14538. doi: 10.1021/bi026513v. [DOI] [PubMed] [Google Scholar]
- Willnow TE, Nykjaer A. Pathways for kidney-specific uptake of the steroid hormone 25-hydroxyvitamin D3. Curr. Opin. Lipidol. 2002;13:255–260. doi: 10.1097/00041433-200206000-00004. [DOI] [PubMed] [Google Scholar]
- Yokota T, Uchihara T, Kumagai J, et al. Postmortem study of ataxia with retinitis pigmentosa by mutation of the alpha-tocopherol transfer protein gene. J. Neurol. Neurosurg. Psychiatry. 2000;68:521–525. doi: 10.1136/jnnp.68.4.521. [DOI] [PMC free article] [PubMed] [Google Scholar]
- Yokota T, Igarashi K, Uchihara T, et al. Delayed-onset ataxia in mice lacking alpha-tocopherol transfer protein: model for neuronal degeneration caused by chronic oxidative stress. Proc. Natl Acad. Sci. USA. 2001;98:15185–15190. doi: 10.1073/pnas.261456098. [DOI] [PMC free article] [PubMed] [Google Scholar]
- Zannis VI, Chroni A, Krieger M. Role of apoA-I, ABCA1, LCAT, and SR-BI in the biogenesis of HDL. J. Mol. Med. 2006;84:276–294. doi: 10.1007/s00109-005-0030-4. [DOI] [PubMed] [Google Scholar]
- Zlokovic BV, Martel CL, Matsubara E, McComb JG, Zheng G, McCluskey RT, Frangione B, Ghiso J. Glycoprotein 330/megalin: probable role in receptor-mediated transport of apolipoprotein J alone and in a complex with Alzheimer disease amyloid beta at the blood–brain and blood–cerebrospinal fluid barriers. Proc. Natl Acad. Sci. USA. 1996;93:4229–4234. doi: 10.1073/pnas.93.9.4229. [DOI] [PMC free article] [PubMed] [Google Scholar]