

Abstract
Consistent with the goals of a comprehensive carbohydrate sequencing strategy, we extend earlier reports to include the characterization of structural (constitutional) isomers. Protocols were developed around ion trap instrumentation providing sequential mass spectrometry (MSn) and supported with automation and related computational tools. These strategies have been built on the principle that for a single structure all product spectra upon sequential fragmentation are reproducible and each stage represents a rational spectrum of its precursor; i.e., all major fragments should be accounted for. Anomalous ions at any stage are clues indicating the presence of structural isomers. Gas-phase isolation and subsequent fragmentation of such ions provide an opportunity to specifically resolve selected structures for their detailed characterization. Importantly, some isomers were not detected following MS2 and required multiple (MSn>2) stages for their characterization. Derivatization remains critical to position substructures in a glycan array since product ions carry fragmentation “scars” throughout the MSn tree. Equally as important are the pathway relationships between each stage and the greater yield of fragments with the smaller number of oscillators. Applications were directed to the structural isomers in ovalbumin and IgG, where, in the latter case, several previously unreported glycans were detected. Procedures were supported with bioinformatics tools for assimilating structure from the MSn data sets.
A comprehensive carbohydrate sequence is particularly challenging when considering the constitutional and stereoisomers that are abundant in glycan arrays. Constitutional isomers, also referred to as structural isomers, are defined as an identical atomic composition arranged in a different structure. Stereoisomers are exemplified with those frequently encountered in the hexoses, mannose, galactose, and glucose, while the two G1 glycans found in IgG are representative of simple structural isomers. In this latter case, an identical monomer may be linked on either of two antennae providing a different topology. In another nomenclature clarification, the term isomer is often confused with isobar. which relates to a different composition of atoms occurring at a nominal (unit) mass resolution.1 At the MS profile stage, isobars are not usually a significant problem in carbohydrate structural characterization, but structural isomers and stereoisomers are. During fragmentation, however, isobaric fragments may be formed, but identification will require higher mass resolving power and mass accuracy.
The high sensitivity provided by mass spectrometry-based methods has made this instrument essential for the elucidation of glycan structures. However, isomer resolution is frequently considered outside the domain of mass measuring instruments, and alternative chromatographic techniques have long supported these structural efforts. Foremost has been GC/MS of samples following methylation, hydrolysis, reduction, and acetylation. Analysis of these products (methylated alditol acetates) remains a major supporting component to MS/MS analysis,2 although the combined data sets rarely provide adequate information for an exacting definition of structure. Thus, such proposed sequences are supplemented with intuition and biological insight, not physical measurement, exposing opportunities for misinterpretation. Several reports have shown stereoisomer resolution of monomers by MS, but these techniques are generally limited to specific applications.3–5
Significant progress has been reported with LC–MS/MS using numerous configurations, and supported with model standards, but using LC to resolve the subtle and contrasting structural differences in carbohydrate isomers appears insurmountable to consider as a generalized sequencing strategy. In this regard, ion mobility instruments may be comparable, although more fitting to the goals of high-throughput (HTP) analysis.6 In both cases, however, the product structures remain to be characterized. A large body of work has shown that spectral comparisons of isomers at different stages of sequential molecular fragmentation (MSn)7–24 are clearly different, although in one case, reproducibility has been reported to be “vague”.25 In our experience, spectral reproducibility has been excellent,26 and this very feature has provided an opportunity to build a searchable fragment library27 and derive glycan structure with supporting tools.28
It has been effectively argued that the transfer of energy by gas-phase collisions maybe too broad to define the subtle isomeric features within carbohydrate structures. For this reason, an alternative excitation strategy, infrared multiple-photon dissociation (IR-MPD),29 was evaluated with a series of glucose disaccharide isomers.30 In IR-MPD, the internal energy distribution, using mid-infrared wavelengths, is narrower than the thermal distributions acquired during CID,31 and this method of energy transfer needs careful consideration. These studies appear to be progressing.32,33 However, minor energy differences in native structures may not be the case for the more prominent stabilities of metal ion adduction that captures stereospecific features with a modulation of fragmentation.26 Moreover, in this MSn application, the energy is not a constant and is effectively increased inversely to the molecular size of the ion,26 so energy fine-tuning may not be critical when considering methylated, metal-adducted samples. But, whatever may be an effective instrumental configuration, we know from long experience that MS instrumentation has proven to be most adaptable, and any combination of MSn coupled with improvements in fragment specificity may be the coup de grâce for unraveling carbohydrate structures and providing definitive structural relationships that map to function.
In this report, we demonstrate the use of sequential mass spectrometry (MSn) to define previously unreported structural isomers in complex mixtures without prior chromatographic separation. The principles involved have been previously considered26 and complex biological applications recently reported.15 The overall focus has been to better define MSn as a universal sequencing strategy consistent with the goals of automation and HTP analysis. We use MSn to identify isomeric mixtures at two different compositions in ovalbumin. We then demonstrate the ability to determine different isomer distributions in two ostensibly similar samples of human IgG. This is a glycoprotein, of particular importance to the pharmaceutical industry, where glycosylation changes may have a significant effect on activity.
Methods
Sample Preparation
Chicken egg ovalbumin, grade V, and human serum IgG (I4506) samples were obtained from Sigma (St. Louis, MO). Purified, humanized anti-interleukin 5 IgG antibody was obtained from Schering-Plough. Glycoproteins were dried over P2O5 prior to glycan release. N-Linked glycans were released from glycoproteins by hydrazinolysis.34 Briefly, anhydrous hydrazine was added to dried glycoprotein samples, heated to 100 °C for 6 h, and then evaporated under a nitrogen stream. The bulk sample was re-N-acetylated in saturated sodium bicarbonate with acetic anhydride, desalted on Dowex 50W cation-exchange resin, and purified by cellulose column chromatography18 (slurry packed with medium fibrous cellulose in 1-butanol/ethanol/water, 4:1:1). Glycan samples were taken up in ∼100 μL of methanol/water, diluted with 1 mL of 1-butanol/ethanol/water, and applied to the columns. Elution was carried out with ethanol/water (1:1). All glycans were reduced with sodium borohydride (10 mg/mL in 0.01 M NaOH) overnight and desalted with a column of Dowex 50W cation-exchange resin. Reduced glycans were permethylated with iodomethane in dimethyl sulfoxide with powdered sodium hydroxide.19,20 Samples were dissolved in methanol/water for mass spectrometry experiments.
Mass Spectrometry
Mass spectra were obtained from an LTQ (Thermo Fisher Scientific, Waltham, MA) equipped with a nanospray ion source. Samples were infused at flow rates ranging between 0.30 and 0.60 μL/min, and spectra were collected using Xcalibur 1.4 and 2.0 software (Thermo Fisher Scientific). In addition, some samples were infused using a Triversa Nanomate (Advion). In selected cases, spectra were collected automatically as described. Ten scan events were programmed with the first event, Scan event 1, being a profile analysis. Subsequent ion scans were automatically selected as the most abundant or from a preprogrammed neutral loss list. In situations where more than one product mass satisfied the neutral loss list, the more intense product was selected as the precursor for a subsequent scan. Signal averaging was accomplished by increasing the number of microscans for each scan and was generally between 5 and 50. This improved spectral quality was necessary at the higher orders of MSn due to diminishing signal, particularly beyond MS5 or MS6. The minimum signal threshold for precursors was lowered to 10 counts for all levels of stages. Collision parameters were left at default values with normalized collision energy set to 35% or to a value leaving a minimal precursor ion peak. Activation Q was set at 0.25 and activation time for 30 ms. All ions were sodiated.
Data Analysis
For structures not previously described, initial topology and isomer assignments were made manually. Structures, whether new or previously described, and their pathways were entered into GlySpy, a set of tools for data handling, complete with the glycan topology assignment algorithm, OSCAR.28 Ion m/z fragmentation pathways used for OSCAR were selected manually by the analyst. OSCAR was then used to determine which of the isomeric structures were consistent with the fragmentation pathways. Using a restricted structure list enabled OSCAR to determine which putative structures were consistent with fragmentation pathways without producing a complete list of candidate structures.
Results and Discussion
A comprehensive characterization of carbohydrate samples is a challenging endeavor. Although comprising but a small number of different monomers (hexose, N-acetylhexosamine, deoxyhexose, etc.), the variable positions of linkage, coupled with branching, and the stereochemistry of monomers and linkage anomericity, quickly inflates to a huge number for even a small set of residues. With the added complication of branching, a neutral MS loss may originate from multiple antennae, and as is common, analytes in low abundance can be obscured by more prominent ions. In this report, we specifically focus on strategies to characterize structural (constitutional) isomers by taking advantage of ion trap operation that can select fragments and complete their characterization in an (ideally) isomer-free field. Applying this strategy, we have found multiple previously unreported isomers in a wide cross section of samples, and some of these were not detected until multiple stages of fragmentation. We demonstrate this analytical approach using a sample previously identified to contain structural isomers followed by two complicated mixtures containing unusual isomeric structures. In these examples, we will use many of the concepts and tools previously described.7,8,15,26–28 All structures were derived de novo with input data from a single instrument.
In the ovalbumin sample, several structural isomers have been reported with the composition Man3GlcNAc521 and observed as the methylated, reduced ion m/z 1923 (MS1, Figure 1). Sequential fragmentation of this precursor, m/z 1923.1, 1663.8, 1370.6, 1111.5, and 852.4, provided the subsequent spectra, MS2– MS6. Summaries of the glycan topologies automatically detected for this composition, and the supporting pathways, are presented in Table 1. The most intense ions in the spectra (MS2–4) result from a facile loss of nonreducing terminal HexNAcs or the reducing-end GlcNAcol. In the MS5 spectrum, a fragment ion m/z 893.5 was consistent with loss of a terminal hexose (i.e., fully methylated at all nonanomeric positions). This could not come from structure B (Table 1). After a mannosyl core residue was exposed, MS6, a distinct pattern of fragments could be discerned for each isomer. A simple key to this understanding is that, in contrast to terminal residues, all internal residues would have one or more open hydroxyls (defined as “scars”) at nonanomeric positions. As examples, a number of specific ions were observed in the MS6 spectrum of ion m/z 852.4: (i) m/z 634.3 and 662.4, were neutral losses of 218 and 190 amu, corresponding to a terminal hexose and a two-branch (two open hydroxyls) hexose, respectively, both consistent with structure A (Table 1); (ii) m/z 695.4, neutral loss of 157 amu, which would be consistent with a 3,5A-type cleavage of the core internal GlcNAc and possibly a product of both structures; (iii) m/z 625.4 and 607.4, likely C- and B-type fragments, respectively, compositions that indicate hexoses only; (iv) m/z 648.3, neutral loss 204 amu and consistent with loss of an internal hexose that could not come from structure A (Table 1); (v) m/z 444 (and an absence of a m/z 458) indicates that all isomers at the precursor composition must have a bisecting HexNAc. A Hex-HexNAc B-type ion with three open hydroxyls (scars) at nonanomeric positions provides a composition mass equal to the ion m/z 444. A Hex-HexNAc B-type ion with two open hydroxyls at nonanomeric positions exhibits an ion, m/z 458. Typically, analysis by MSn of methylated N-linked glycans will expose the Man-β (1–4) GlcNAc core residues if the most intense ion at each stage is selected for CID. MS7 spectra, obtained from CID of ions m/z 634.3, 648.3, and 662.3, all had a base peak of m/z 444 (data not shown). These fragments would have lost a branched hexose, an internal hexose, and a terminal hexose, respectively. This further corroborates the two isomeric structures at this mass.
Figure 1.

MSn pathways for the ion m/z 1923 from reduced, permethylated ovalbumin glycans. Spectra were collected automatically following a preprogrammed neutral loss list. Each scan is the average of 20 microscans. The inset notations define the pathway used to generate each spectrum.
Table 1. MSn Pathways and Glycan Topology Assignments from the Ion m/z 1923.1 (Man3GlcNAc5)a.
| Putative structures | |||
|---|---|---|---|
 |
 |
||
| MSn pathways | Consistent topologies | ||
1923.1  1663.8 (loss of 1663.8 (loss of  ) 1370.6 (loss of ) 1370.6 (loss of  ) 1111.5 (loss of ) 852.4 (loss of ) 662.4 (loss of ) 1111.5 (loss of ) 852.4 (loss of ) 662.4 (loss of  ) 444.2 (loss of ) 444.2 (loss of  ) ) |
A | ||
| 1923.1 1663.8 (loss of ) 1370.6 (loss of ) 1111.5 (loss of ) 852.4 (loss of ) 634.3 (loss of ) 444.3 (loss of ) |
A | ||
1923.1 1663.8 (loss of ) 1370.6 (loss of ) 1111.5(loss of ) 852.4 (loss of ) 648.3 (loss of  ) 444.2 (loss of ) ) 444.2 (loss of ) |
B | ||
| Symbol | Fragment identity | Neutral loss (singly-charged precursor) | Sodiated mass [M+Na]+ |
| Terminal Hexose, B type | 218 | 241 | |
| Internal Hexose, B/Y type | 204 | 227 | |
| Branched Hexose, B/Y/Y type | 190 | 213 | |
| Internal Hex-HexNAc disaccharide, B/Y type | 449 | 472 | |
| Terminal Hex-HexNAc disaccharide, B type | 463 | 486 | |
| Terminal HexNAc, B type | 259 | 282 | |
| Internal HexNAc, B/Y type | 245 | 268 | |
| Fucose-substituted reducing end GlcNAc, Y-type | 467 | 490 | |
| Terminal Hex-Hex-HexNAc, B type | 667 | 690 | |
| Reducing-end GlcNAc, Y-type | 293 | not usually seen | |
| Core Man-β1,4-GlcNAc, B/Y/Y type | not applicable | 458 | |
| Core Man-β1,4-GlcNAc, B/Y/Y/Y type | not applicable | 444 | |
The table also contains a key to the various fragment symbols used here and in all other tables.
From this example, a simple strategy was apparent for ascertaining isomeric structures; for ions in an MSn pathway that are inconsistent with a proposed structure, isolate that ion for fragmentation, and carefully note satellite ions differing by 14 amu, the mass of a methyl group. Thus, the fragments m/z 634.3, 648.3, and 662.4 could not be products of a single structure. Significantly, it should be noted that MS2 or even MS3 analysis of these structures would not reveal the presence of all isomers. An alternative more direct pathway could have been taken based on the earlier detection of the m/z 852.4 fragment (MS3, Figure 1). But here, data collection was automatic and rapid and certainly quicker than a human analyst, though not yet as clever.
Contrasting data collection both manually and automatically provides an opportunity to challenge GlySpy's core algorithm, OSCAR, and our professional expertise. The ion pathways entered in the tables were inputs for OSCAR from which correlations between pathways and structures could be observed. The accompanying Chart 1 shows a compatibility report for these data. In this example, OSCAR determined that this MSn pathway was compatible with structure 1 (structure A in the table) and not structure 2 (structure B in the table). The charts and tables were prepared for all pathways and structures as a means to represent and condense the OSCAR output.
Chart 1. Output from the OSCAR Algorithm for MSn Data Obtained in Figure 1 and Table 1a.

a Using a restricted structure list, OSCAR determined which of the two structures was consistent with the MSn pathway shown on the second line. Structure 1 corresponds to A and structure 2 to B in Table 1. This report shows that the pathway has a single interpretation that is consistent with structure 1, but no interpretation consistent with structure 2. Structural compatibility reports of this type were obtained for all MSn pathways listed in this paper, the full analysis completed in under 8.5 s on a 2.66-GHz Pentium 4 laptop with 1 GB of memory.
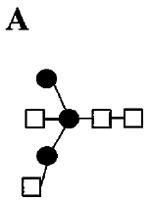
In another example from this ovalbumin sample, the isomeric structures of the ion m/z 1678 (composition, Man3GlcNAc4) were examined. Figure 2 shows the MSn spectral set for this ion prepared and profiled in the usual manner. The individual pathways and glycan topologies determined from these data are presented in Table 2. Comparable to the above study of m/z 1923.1, the first two spectra, MS2 and MS,3 failed to reveal the presence of multiple isomeric structures. In the MS2 spectrum, all major fragments are consistent with glycosidic cleavages of the expected structure C. At the MS3 level we also see the 3,5A cleavage of the core GlcNAc in addition to glycosidic cleavages. Fragmentation of the central Man3GlcNAc core, m/z 866.4, and the associated scars would be necessary to demonstrate the presence of multiple isomeric structures. As with Figure 1, multiple and more direct pathways to this core ion would have been possible under manual control. The first six spectra were collected automatically, so the most intense ions were selected as precursors. Two additional MS6 spectra (bottom, Figure 2) were obtained manually. In the MS5 spectrum, CID of the ion m/z 866.4, we see fragments that could only come from one or two of the isomeric structures, but not all. For example, structure C of Table 2 could not produce the fragment at m/z 648.3 (loss of terminal hexose), but structures A and B could. Using similar reasoning, structures A and B could not produce the fragment m/z 458.2 (Man-GlcNAc, B/Y/Y), but structure C could. However, the information at this level of MSn would not necessarily indicate the presence of isomers unless one knew of their presence in advance. Importantly, the data in this spectrum were not sufficient to assign the correct topologies, and only in the MS6 spectra were there fragments indicative of isomers, e.g., m/z 458.2 and 444.3. Both of these fragments are typical of the Man-β (1–4)-GlcNAc B/Y ions described above, with two (B/Y/Y) and three (B/Y/Y/Y) open hydroxyls at nonanomeric positions, respectively. These fragments could not arise from the same structure. Their presence also indicates that this isomeric mixture contains structures with and without bisecting substituents on the core mannose.
Figure 2.

MSn spectra of the ion m/z 1678 from reduced, permethylated ovalbumin glycans. The first six spectra were collected automatically using a preprogrammed neutral loss list with 20 microscans/scan. The last two spectra were collected manually with 5 microscans/scan for the indicated number of scans. The inset notations define the pathway used to generate each spectrum.
Table 2. MSn Pathways and Glycan Topologies from the Ion m/z 1678, (Man3GlcNAc4).
| Putative Structures | |||
|---|---|---|---|
 |
 |
 |
 |
| MSn pathways | Consistent topologies | ||
| 1678.0 1384.6 (loss of ) 1125.5 (loss of ) 866.4 (loss of ) 662.3 (loss of ) 444.3 (loss of ) |
A,B | ||
| 1678.0 1384.6 (loss of ) 1125.5 (loss of ) 866.4 (loss of ) 648.3 (loss of ) 444.3 (loss of ) |
A,B | ||
| 1678.0 1384.6 (loss of ) 1125.5 (loss of ) 866.4 (loss of ) 662.3 (loss of ) 458.2 (loss of ) |
C | ||
| 1678.0 1384.6 (loss of ) 1125.5 (loss of ) 866.4 (loss of ) 676.4 (loss of ) 519.3 (3,5A/Y) |
D | ||
| 1678.0 1384.6 (loss of ) 1125.5 (loss of ) 866.4 (loss of ) 676.4 (loss of ) 458.2 (loss of ) |
D | ||
| 1678.0 1384.6 (loss of ) 1125.5 (loss of ) 866.4 (loss of ) 676.4 (loss of ) 329.2 (3,5A core mannose) |
D | ||
| 1678.0 1384.6 (loss of ) 1125.5 (loss of ) 866.4 (loss of ) 676.4 (loss of ) 301.2 (0,4A core mannose) |
D | ||
| 1678.0 1384.6 (loss of ) 1125.5 (loss of ) 866.4 (loss of ) 676.4 (loss of ) 259.3 (, C1) |
D | ||
| 1678.0 1384.6 (loss of ) 1125.5 (loss of ) 866.4 (loss of ) 676.4 (loss of ) 241.2 (, B1) |
D | ||
| 1678.0 1384.6 (loss of ) 1125.5 (loss of ) 866.4 (loss of ) 676.4 (loss of ) 449.2 (C/Y) |
D | ||
| 1678.0 1384.6 (loss of ) 1125.5 (loss of ) 866.4 (loss of ) 676.4 (loss of 431.2 (B/Y) |
D | ||
| 1678.0 1384.6 (loss of ) 1125.5 (loss of ) 866.4 (loss of ) 648.3 (loss of ) 458.2 (loss of ) |
D | ||
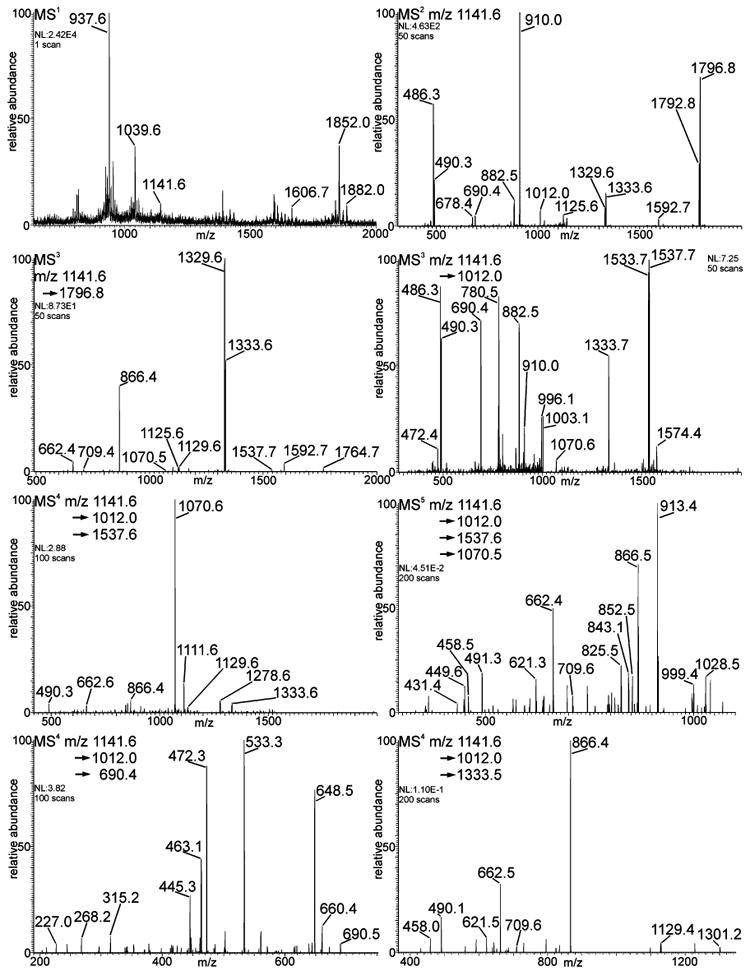
These first two examples delineate the MSn approach to determine structural isomers. Precursor–product relationships are necessary to interpret these data, as it is vital to know the actual losses from each cycle. Some concern should be shown for the possibility of multiple or cross-ring cleavages that may overlap with a sequence fragment. A way to substantiate a sequence would be to pursue the same end structures using an alternative pathway. The subsequent human IgG sample has been analyzed by numerous laboratories and is commercially available. Using this MSn approach, we show the expected N-linked glycans but, in addition, a series of N-linked structural isomers not previously described. The released N-linked human IgG glycans were reduced, permethylated, and analyzed by MSn. The spectra are shown in Figure 3. The MS1 profile of the glycans was characteristic and the ion at m/z 1141, the putative G2 structure, was selected for MSn. This ion was doubly charged and suggested a composition equal to Hex5HexNAc4deoxyhexose1. The reported structure is indicated as structure A of Table 3. The most abundant neutral loss from this structure (MS2, Figure 3) would be the nonreducing terminal disaccharide, Hex-HexNAc, and this was observed as the doubly charged base ion, m/z 910.1. This spectrum also exhibits two additional familiar neutral losses (terminal Hex-HexNAc, 463 amu, and a fucose-substituted reducing-end GlcNAc, 467 amu). Additional stages of disassembly were consistent with the other isomeric structures shown in Table 3. Exact linkages have not been determined; however, the topology is consistent and verifiably different from the expected structure. Structure A was not proven exhaustively, since it is well-known to be present and the most abundant structure at this mass. However, inconsistent with the proposed structure was the ion m/z 1012.1 (MS2, Figure 3). This was also doubly charged showing a neutral loss of m/z 129.6 (loss of 259.2 amu) and equal in composition to a terminal HexNAc residue. This mass loss is inconsistent with structure A (Table 3), and to evaluate this product, the ion was selected for further MSn analysis (MS3, Figure 3). While a clue to the presence of an isomeric structure was indicated in the MS2 spectrum (m/z 1012.1), higher order spectra were required to confirm its structure. An important feature of MSn was apparent in this last event and should be noted. Since the expected G2 structure does not contain a terminal HexNAc residue, and would not produce a fragment at m/z 1012.1, isolation of this fragment shifts it away from structure A and to a domain of its own for study. This frequently circumvents a common problem of being obscured from more abundant ions.
Figure 3.

MSn pathways for the ion m/z 1141.6, Hex5HexNAc4deoxyhexose1 (doubly charged), from a commercial sample of human IgG. Samples were reduced and permethylated. Spectra were collected manually with 5 microscans/scan for the indicated number of scans. The insert notations define the pathway used to generate each spectrum.
Table 3. MSn Pathways and Topologies for the Ion m/z 1141.6, Hex5HexNAc4deoxyhexose1, from a Commercial Sample of Human IgG.
| Putative structures: | ||
|---|---|---|
 |
 |
 |
| MSn pathways | Consistent topologies | |
1141.6 910.0 (loss of  ) 1333.6 or 678.3 (loss of ) ) 1333.6 or 678.3 (loss of ) |
A,B,C | |
1141.6 910.0 (loss of ) 1329.6 (loss of  ) ) |
A,B,C | |
| 1141.6 910.0 (loss of ) 866.4 (loss of and ) |
A,B,C | |
| 1141.6 910.0 (loss of ) 490.3 (, Y) |
A,B,C | |
| 1141.6 910.0 (loss of ) 486.3 (, B2) |
A,B | |
| 1141.6 1792.8 (loss of ) |
A,B,C | |
| 1141.6 490.3 (, Y) |
A,B,C | |
| 1141.6 486.3 (, B2) |
A,B,C | |
| 1141.6 1012.0 (loss of ) 1537.6 (loss of ) 1333.6 (loss of ) |
B,C | |
| 1141.6 1012.0 (loss of ) 1537.7 (loss of ) 1070.5 (loss of ) 913.4 (3,5A/Y/Y) |
B,C | |
| 1141.6 1012.0 (loss of ) 1537.7 (loss of ) 1070.5 (loss of ) 866.5 (loss of ) |
B,C | |
1141.6 1012.0 (loss of ) 1537.7 (loss of ) 1070.5 (loss of ) 843.1 (loss of  , C/Y/Y) , C/Y/Y) |
B,C | |
| 1141.6 1012.0 (loss of ) 1537.7 (loss of ) 1070.5 (loss of ) 825.5 (loss of , B/Y/Y) |
B,C | |
| 1141.6 1012.0 (loss of ) 1537.7 (loss of ) 1070.5 (loss of ) 709.6 (loss of , 3,5A/Y/Y) |
B,C | |
1141.6 1012.0 (loss of ) 1537.7 (loss of ) 1070.5 (loss of ) 662.4 (loss of  , B/Y/Y) , B/Y/Y) |
B,C | |
| 1141.6 1012.0 (loss of ) 1537.7 (loss of ) 1070.5 (loss of .) 621.3 (loss of and , B/Y/Y) |
B,C | |
| 1141.6 1012.0 (loss of ) 1537.7 (loss of ) 1070.5 (loss of ) 491.3 (Hex-Hex-Hex(cross-ring),0,4A/Y) |
B,C | |
| 1141.6 1012.0 (loss of ) 1537.7 (loss of ) 1070.5 (loss of ) 449.6 (, C/Y) |
B,C | |
| 1141.6 1012.0 (loss of ) 1537.7 (loss of ) 1070.5 (loss of ) 431.4 (, B/Y) |
B,C | |
| 1141.6 1012.0 (loss of ) 1537.6 (loss of ) 866.4 (loss of and ) |
B,C | |
| 1141.6 1012.0 (loss of ) 1537.6 (loss of ) 490.3 (, Y) |
B,C | |
| 1141.6 1012.0 (loss of ) 1533.7 (loss of ) |
B,C | |
| 1141.6 1012.0 (loss of ) 486.3 (, B2) |
B,C | |
| 1141.6 1012.0 (loss of ) 490.3 (, Y) |
B,C | |
1141.6 1012.0 (loss of ) 1537.7 (loss of ) 1070.5 (loss of ) 458.5 ( , B/Y/Y) , B/Y/Y) |
B only | |
| 1141.6 1012.0 (loss of ) 1537.6 (loss of ) 1070.5 (loss of ) 852.5 (loss of ) |
C only | |
| 1141.6 1012.0 (loss of ) 1537.6 (loss of ) 852.5 (loss of and ) 648.4 (loss of ) 491.3 (3,5A/Y/Y/Y) |
C only | |
1141.6 1012.0 (loss of ) 1537.6 (loss of ) 852.5 (loss of and ) 648.4 (loss of ) 444.3 ( , B/Y/Y/Y) , B/Y/Y/Y) |
C only | |
| 1141.6 1012.0 (loss of ) 1537.6 (loss of ) 852.5 (loss of and ) 648.4 (loss of ) 421.3 (loss of , C/Y/Y) |
C only | |
| 1141.6 1012.0 (loss of ) 1537.6 (loss of ) 852.5 (loss of and ) 648.4 (loss of ) 403.2 (loss of , B/Y/Y) |
C only | |
| 1141.6 1012.0 (loss of ) 1537.6 (loss of ) 852.5 (loss of and ) 648.4 (loss of ) 268.0 (, B/Y) |
C only | |
| 1141.6 1012.0 (loss of ) 1537.6 (loss of ) 852.5 (loss of and ) 444.4 (, B/Y/Y/Y) |
C only | |
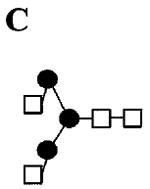
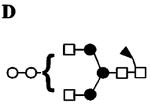
An additional sample, humanized IgG, was prepared in-house, and the N-linked glycans were analyzed in a comparable manner. Mass profiles indicated an ion fitting the composition of the G2 structure (MS1, Figure 4), and MSn of this ion (MS2, m/z 1141) provided fragments consistent with that speculation (structure A of Table 4). As noted previously, this humanized IgG sample also exhibited an ion fragment m/z 1012, consistent with loss of a terminal HexNAc (MS2, Figure 4). This aberrant ion was isolated for MS3 analysis (MS3, Figure 4, right) and this spectrum was shown to be comparable to the commercial preparation (C, Table 4) except for two additional ions at m/z 690.4 and 1333.7. The ion at m/z 690 was consistent with a B3 ion composition that includes two hexoses and an N-acetylhexosamine. The ion at m/z 1333 was consistent with its Y-type complement, which has lost the B3 fragment (D, Table 4). Distinguishing these topologies required knowledge of precursor–product relationships, a fundamental feature of MSn analysis. Although observed at the MS2 level, these isomers could not be correctly characterized. The m/z 690 ion could have a number of topologies, (HexNAc-Hex-Hex; Hex-HexNAc-Hex; Hex-Hex-HexNAc), without even considering linkage differences. An identical ion has been observed in the MS/MS spectrum from a different recombinant IgG glycan, and this was further characterized by specific glycosidase digestion.16 To determine the structure of this fragment, collision analysis was run on the m/z 690 ion (MS4, Figure 4, bottom left) and the fragments were found to be consistent with a Hex-Hex-HexNAc linear structure. The MS4 spectrum of its putative complement, m/z 1333, is also shown, (MS4, Figure 4, bottom right). These fragments in the MS3 spectrum (MS3, Figure 4, right) are consistent with a fourth structural isomer (D, Table 4). In addition, the m/z 1537.6 ion was selected for MSn analysis, and that MS4 spectrum is shown (MS4, Figure 4). From this spectrum, the m/z 1070.5 ion was selected for fragmentation and the MS5 spectrum is shown (MS5, Figure 4). These spectra indicate that an isomeric structure seen in the commercial IgG sample was also present in the humanized IgG sample. We see the loss of a fucose-substituted reducing-end N-acetylglucosamine and the loss of a terminal Hex-HexNAc disaccharide. The m/z 1070 ion is consistent with a structure containing four hexoses and one N-acetylhexosamine. While the signal-to-noise ratio is lower than in the other spectra, we could still reliably distinguish peaks of interest. From the spectrum of this ion, we saw fragments that were consistent with the proposed structure, in particular a putative 0,4A cleavage of the core mannose with two hexoses attached, at m/z 491.3. All other fragments were consistent with structure B of Table 4.
Figure 4.
MSn pathways for the ion m/z 1141.6, Hex5HexNAc4deoxyhexose1 (doubly charged), from a humanized IgG sample. Samples were reduced and permethylated. Spectra were collected manually with 5 microscans/scan for the indicated number of scans. The inset notations define the pathway used to generate each spectrum.
Table 4. MSn Pathways Topologies for the Ion m/z 1141.6 (Hex5HexNAc4deoxyhexose1) from a Humanized IgG Sample.
| Putative Structures | |||
|---|---|---|---|
 |
 |
 |
 |
| MSn pathways | Consistent topologies | ||
| 1141.6 1796.8 (loss of ) 1333.6 (loss of ) |
A,B,C | ||
| 1141.6 1796.8 (loss of ) 1329.6 (loss of ) |
A,B,C,D | ||
| 1141.6 1796.8 (loss of ) 866.4 (loss of and ) |
A,B,C,D | ||
| 1141.6 1796.8 (loss of ) 709.4 (Hex-Hex-Hex-HexNAc(cross-ring),3,5A/Y/Y) |
A,B,C | ||
| 1141.6 1796.8 (loss of ) 662.4 (loss of , , and ) |
A,B,C,D | ||
| 1141.6 1792.8 (loss of ) |
A,B,C,D | ||
| 1141.6 490.3 (, Y) |
A,B,C,D | ||
| 1141.6 486.3 (, B2) |
A,B,C,D | ||
| 1141.6 1012.0 (loss of ) 1537.6 (loss of ) 1333.6 (loss of ) |
B,C | ||
| 1141.6 1012.0 (loss of ) 1537.6 (loss of ) 852.6 (loss of and ) |
B,C | ||
| 1141.6 1012.0 (loss of ) 1537.7 (loss of ) 1070.5 (loss of ) 913.4 (3,5A/Y/Y) |
B,C | ||
| 1141.6 1012.0 (loss of ) 1537.7 (loss of ) 1070.5 (loss of ) 866.5 (loss of ) |
B,C | ||
| 1141.6 1012.0 (loss of ) 1537.7 (loss of ) 1070.5 (loss of ) 852.3 (loss of ) |
C only | ||
| 1141.6 1012.0 (loss of ) 1537.7 (loss of ) 1070.5 (loss of ) 843.1 (loss of , C/Y/Y) |
B,C | ||
| 1141.6 1012.0 (loss of ) 1537.7 (loss of ) 1070.5 (loss of ) 825.5 (loss of . B/Y/Y) |
B,C | ||
| 1141.6 1012.0 (loss of ) 1537.7 (loss of ) 1070.5 (loss of ) 709.6 (loss of , 3,5A/Y/Y) |
B,C | ||
| 1141.6 1012.0 (loss of ) 1537.7 (loss of ) 1070.5 (loss of ) 662.4 (loss of , B/Y/Y) |
B,C | ||
| 1141.6 1012.0 (loss of ) 1537.7 (loss of ) 1070.5 (loss of ) 621.3 (loss of and , B/Y/Y) |
B,C | ||
| 1141.6 1012.0 (loss of ) 1537.7 (loss of ) 1070.5 (loss of ) 491.3 (Hex-Hex-Hex(cross-ring),0,4A/Y) |
B,C | ||
| 1141.6 1012.0 (loss of ) 1537.7 (loss of ) 1070.5 (loss of ) 458.5 (, B/Y/Y) |
B only | ||
| 1141.6 1012.0 (loss of ) 1537.7 (loss of ) 1070.5 (loss of ) 449.6 (, C/Y) |
B,C | ||
| 1141.6 1012.0 (loss of ) 1537.7 (loss of ) 1070.5 (loss of ) 431.4 (, B/Y) |
B,C | ||
| 1141.6 1012.0 (loss of ) 1537.6 (loss of ) 866.4 (loss of and ) |
B,C | ||
| 1141.6 1012.0 (loss of ) 1537.6 (loss of ) 490.3 (, Y) |
B,C | ||
| 1141.6 1012.0 (loss of ) 1533.7 (loss of ) |
B,C,D | ||
| 1141.6 1012.0 (loss of ) 486.3 (, B2) |
B,C | ||
| 1141.6 1012.0 (loss of ) 490.3 (, Y) |
B,C,D | ||
1141.6 1012.0 (loss of ) 1333.5 (loss of  , or equiv.) 1129.4 (loss of ) , or equiv.) 1129.4 (loss of ) |
B,C,D | ||
| 1141.6 1012.0 (loss of ) 1333.5 (loss of , or equiv.) 866.4 (loss of ) |
B,C,D | ||
| 1141.6 1012.0 (loss of ) 1333.5 (loss of , or equiv.) 709.6 (Hex-Hex-Hex-HexNAc(cross-ring),3,5A/Y/Y) |
B,C,D | ||
| 1141.6 1012.0 (loss of ) 1333.5 (loss of , or equiv.) 662.5 (loss of and ) |
B,C,D | ||
1141.6 1012.0 (loss of ) 1333.5 (loss of , or equiv.) 621.5 ( , B/Y/Y) , B/Y/Y) |
B,C,D | ||
| 1141.6 1012.0 (loss of ) 1333.5 (loss of , or equiv.) 490.1 (, Y) |
B,C,D | ||
| 1141.6 1012.0 (loss of ) 1333.5 (loss of , or equiv.) 458.0 (, B/Y/Y) |
B,D | ||
| 1141.6 1012.0 (loss of ) 690.4 (, B3) 533.3 (Hex-Hex-HexNAc(cross-ring), 3,5A3) |
D only | ||
1141.6 1012.0 (loss of ) 690.4 (, B3) 472.3 ( , B/Y) , B/Y) |
B,C,D | ||
1141.6 1012.0 (loss of ) 690.4 (, B3) 463.1 ( , C2) , C2) |
D only | ||
| 1141.6 1012.0 (loss of ) 690.4 (, B3) 445.3 (, B2) |
D only | ||
It should be pointed out that the collision spectrum of the ion m/z 1333 obtained from commercial and humanized IgG samples were identical (Figure 5). This spectral identity of fragment ions from different MSn pathways, or different precursors, has been continuously observed and has provided the basis for our fragment library, FragLib.27 In this regard, however, it is important that every ion in the spectrum be a rational result of a single fragment, and this can be validated by checking every ion contributing to that spectrum. A unique ion fragment, however, does not confirm a structural isomer. As an example, the detection of the ion m/z 1333 in the MS/MS spectrum could not distinguish between these structures (Table 3), because the structural piece contributing isomerism was the neutral loss component. Thus, not only is the structure of the fragment important but also the pathway used to obtain that fragment. Structure A would yield a m/z 1333 fragment after successive losses of two terminal Hex-HexNAc disaccharides, while structure D would yield the same fragment after successive losses of a terminal HexNAc and a terminal Hex-Hex-HexNAc trisaccharide. The complementary ion fragment (m/z 1333) may have multiple structures, and in fact, the commercial human IgG sample and the humanized sample both had small but detectable peaks at m/z 690 in each respective MS/MS spectrum. Further analysis of this ion from each sample (MS3, Figure 6A and B) clearly shows their nonidentity and strongly suggests them to be mixtures, along with the two putative structures. In the commercial IgG sample (Figure 6A), one can see the major B3 ion structure (Hex-HexNAc-Hex) as indicated by the prominent peak at m/z 486, and in the corresponding IgG sample (Figure 6B) the dominant ions, m/z 533, 463, and 445, indicating the Hex-Hex-HexNAc sequence. But, in addition, trace amounts of the trisaccharide cojoiner were detected in each spectrum. Isolating the m/z 690 ion from the humanized IgG sample shows a much smaller relative contribution from the Hex-HexNAc-Hex structure, indicated by the comparably much less intense m/z 486 ion. Isolating the m/z 690 from the MS3 spectrum of the m/z 1012 ion almost completely removes the contribution of structure A, leading to a much less ambiguous MS4 spectrum, as indicated by the negligible peak at m/z 486.
Figure 5.

Comparison of collision spectra of m/z 1333 from (A) humanized IgG sample and (B) commercial IgG sample from different MSn pathways. The inset notations define the pathway used to generate each spectrum. The structure and fragmentations are shown in (C).
Figure 6.

Comparison of (A) MS3 from a commercial sample of IgG and (B) MS3 from a humanized IgG sample. The inset notations define the pathway used to generate each spectrum. Fragments with Hex-HexNAc-Hex and Hex-Hex-HexNAc are indicated in (C) and (D), respectively.
Determination of the Hex-Hex moiety linkage from the Hex-Hex-HexNAc antenna (D, Figure 6) was pursued to corroborate this effort with earlier reported enzymatic studies16 (Gal-α(1–3)-Gal). Due to limitations in sensitivity, obtaining an MS5 spectrum of the m/z 445 ion (B2) from the MS4 spectrum of the m/z 690 precursor, as shown in Figure 4, was not possible. It was possible, however, to obtain a CID spectrum of the m/z 445 ion from the MS3 spectrum of m/z 690 shown in Figure 6, and this is presented in Figure 7. The fragment at m/z 315 can be found in both 3- and 4-linked Hex-Hex B2 disaccharide fragments. The fragment at m/z 329 can be found in 4-linkages. The fragments at m/z 343, 371, and 383 are typically found in 3-linkages.26 The presence of all of these fragments suggests that both 3- and 4-linkages are present for these oligosaccharides.
Figure 7.

MS4 spectrum of m/z 445 from humanized IgG sample. The inset notations define the pathway used to generate each spectrum.
Importantly, in all of the examples shown, the presence of isomeric structures could not be determined from MS/MS spectra alone. In several cases, determination of these isomeric structures required MS3 or deeper levels of MSn. A successful approach to assess the presence of structural isomers appears to be a simple check of the spectra for aberrant or inconsistent fragments to a perceived structure. With methylated samples, detection of satellite ions 14 amu apart is also suggestive of isomers. The ion trap mass analyzer allows us to isolate such fragments and detail these isomeric structures.
The diminishing signal with increasing MSn depth defines the limits of this analysis. Since we primarily infuse samples of constant composition rather than coupling the mass spectrometer to a liquid chromatograph, we are able to signal average for longer times relative to the chromatographic time scale. This generally offsets some of the signal intensity limitations. Of course, the weaker the signal, the longer the signal must be averaged. The limits of detection are difficult to define because of sample variability, ion selected, and amount of data required. It is generally possible to obtain deep (MS6) spectra on the most intense fragments with less than 1 mg of starting protein, depending on the particular protein and the instrument used. Acquiring more spectra on more oligosaccharides will require correspondingly more sample. Fragmenting a low-abundance precursor will require a longer analysis time than fragmenting a high-abundance precursor, and so on. Of course, one can always consume less material and obtain correspondingly less data. Obviously, analysis time and peak selection depend on the type of information desired.
The two IgG examples illustrate a further advantage of MSn for glycan structural analysis. These were ostensibly similar samples, and the expectation would be a similarity in glycan structures. We have shown this not to be the case, and it is conceivable that, under particular biological conditions, such as certain disease states, or certainly when genes are transfected into other organisms, that glycosylation could be perturbed in unexpected ways. In these situations, merely determining masses and compositions may not be sufficient to characterize an isomer sample. We have demonstrated with these examples that MS/MS spectra would be inadequate to distinguish these particular isomeric structures using low-energy CID. One of the strengths of sequential mass spectrometry of isomeric mixtures is the ability to select ions that may be unique to a particular isomer,2,14 which effects a gas-phase separation of the oligosaccharide fragments. This allows acquisition of MSn spectra free from other isomer fragments that may be present in the sample. At the MS/MS level, all isomers present will produce fragments in the same spectrum. This will, of course, yield a more complex spectrum, which is more difficult to decipher.
Automated data acquisition was employed in the examples shown in Figures 1 and 2. This enabled us to collect data in ∼1.5 min for each glycan. Currently, precursor ion selection is based on neutral loss or intensity. The drawback for this method of selecting ions is that it will only select fragments from the most abundant structure present, which may not be the most informative. These disadvantages are likely to hold for any precursor selection based on preprogrammed parameters. The advantage is that these spectra are obtained much more quickly than if the analyst had to manually select the peaks. It is still a challenge to obtain the necessary spectra in a reasonable amount of time. This complexity, vis-à-vis the need to obtain a set of MSn spectra rather than a single MS/MS spectrum, demands some degree of expertise and requires that the analyst decide which spectra to obtain. This may, in part, explain the infrequent use of MSn in glycomic analysis. An ongoing project in our laboratory is to develop intelligent peak picking, which will allow a computer program to interact with the data acquisition software to select fragments that are likely to be most informative. These innovations will make acquisition of sequential mass spectra faster and easier. In addition, this would enable automated, round-the-clock automation of mass spectrometric analysis.
We have used the algorithm OSCAR to analyze MSn data, and in this study, a human analyst annotated the spectra and OSCAR was used to corroborate the analyst's conclusion. We envision that computational interpretation of mass spectrometric data will replace, rather than merely augment, human interpretation. Development of bioinformatics tools is an ongoing project in our laboratory, and in that regard, we are developing tools that will automate detection of these isomeric structures. These tools, ideally, will be able to discern the presence of isomeric structures in less time than a human analyst. This will also enable nonexperts to employ this technique for glycan structural analysis, as well as allowing experts to redirect their efforts. The ultimate goal is to automate the entire process of glycan structural analysis, from mass spectral data acquisition to data analysis and structure/topology information output. This will include intelligent peak peaking and automatic isomer detection as discussed here, as well as real-time OSCAR analysis and mass spectral library matching with FragLib.
Structural isomers are seldom reported and a single structure is a frequent conclusion. In contrast, we would suggest this may represent an unlikely scenario, depending on how the sample was purified. The more likely case is a distribution of related products that would include glycomers and structural and stereoisomers. A structure may be proposed from mass profiles (providing ion compositions) and tandem MS analysis, but the data are frequently insufficient to assign a comprehensive structure. Biosynthetic rules complement such data, and the resulting single-structure proposals may be correct. But the speculative nature of such entrées, and the absence of a direct physical measurement, should be kept in mind. Glycomers have been readily accepted and anticipated biological metabolites, and because of their mass difference, they are obvious. Structural and stereoisomers are frequently transparent to the mass spectrometer and difficult to provide convincing data to support their presence. This was the case with the IgG glycans described in this report where, at the MS2 level, the most abundant peaks were consistent with the reported G2 structure. There are, however, several ions that were not consistent with this structure, and using MSn, we were able to select these ions and assign their topology. By combining this MSn information with computational techniques, we are able to assign the overall glycan structure.26–28 Interestingly, it is also possible to select ions that could only come from one structure, thus achieving a gas-phase separation of isomers or, more correctly, fragments of oligosaccharides that are unique to one isomeric glycan. Knowledge of the precursor–product relationships at each level of MSn is also of vital importance. We further note that increasing the depth of analysis beyond tandem MS is necessary to uncover complexities not noticeable at only MS2 or possibly MS3 levels.
This technique will likely be limited to methods involving direct infusion by electrospray sources to allow time for data to be gathered from a precursor glycan. LC–MS methods would probably not work well for many MSn stages because of time constraints across a chromatographic peak. In addition, performing a chromatographic separation does not guarantee that all isomeric structures will be resolved. While separation of isomeric structures by chromatographic methods may or may not be successful, we envision situations where chromatographic separation may be useful. Since sequential mass spectrometry by direct infusion will result in loss of ions that are generated but not analyzed, fractionation prior to direct infusion may allow precious samples to be conserved by allowing direct infusion of only some sample glycans at a time, while other fractions await analysis. For samples such as pharmaceutical preparations, sample amounts are generally not limited and conservation is not necessary. Determining glycosylation site is another frequently studied problem. Permethylation of oligosaccharides is essential to obtain structural details, so releasing oligosaccharides from protein is necessary.26 Techniques that introduce a heavier isotope into the peptide during enzymatic oligosaccharide release will give some information about glycosylation site location.35
The time and effort required obtaining MSn spectra can be minimized by using automated data acquisition, and our ongoing efforts will continue to develop such tools for instrument control, data acquisition, and spectral understanding. In the long run, we hope that our tools will not only detect the presence of structural isomers but define their details as well.
References
- 1.McLafferty FW. Interpretation of Mass Spectra. 2nd. W. A. Benjamin; Reading, MA: 1973. p. 81. [Google Scholar]
- 2.Bjorndal H, Hellerquist HG, Lindberg B, Svensson S. Angew Chem, Int Ed Engl. 1970;9:610–619. [Google Scholar]
- 3.Smith G, Leary JA. J Am Chem Soc. 1996;118:3293–3294. [Google Scholar]
- 4.Smith G, Pedersen SF, Leary JA. J Org Chem. 1997;62:2152–2154. doi: 10.1021/jo9622789. [DOI] [PubMed] [Google Scholar]
- 5.Gaucher SP, Leary JA. Anal Chem. 1998;70:3009–3014. doi: 10.1021/ac980023k. [DOI] [PubMed] [Google Scholar]
- 6.Clowers BH, Dwivedi P, Steiner WE, Hill HH, Jr, Bendiak B. J Am Soc Mass Spectrom. 2005;16:660–669. doi: 10.1016/j.jasms.2005.01.010. [DOI] [PubMed] [Google Scholar]
- 7.Weiskopf AS, Vouros P, Harvey DJ. Anal Chem. 1998;70:4441–4447. doi: 10.1021/ac980289r. [DOI] [PubMed] [Google Scholar]
- 8.Sheeley DM, Reinhold VN. Anal Chem. 1998;70:3053–3059. doi: 10.1021/ac9713058. [DOI] [PubMed] [Google Scholar]
- 9.Zaia J. Mass Spectrom Rev. 2004;23:161–227. doi: 10.1002/mas.10073. [DOI] [PubMed] [Google Scholar]
- 10.Karlsson NG, Schulz BL, Packer NH. J Am Soc Mass Spectrom. 2004;15:659–672. doi: 10.1016/j.jasms.2004.01.002. [DOI] [PubMed] [Google Scholar]
- 11.Karlsson NG, Wilson NL, Wirth HJ, Dawes P, Joshi H, Packer NH. Rapid Commun Mass Spectrom. 2004;18:2282–2292. doi: 10.1002/rcm.1626. [DOI] [PubMed] [Google Scholar]
- 12.Schulz BL, Packer NH, Karlsson NG. Anal Chem. 2002;74:6088–6097. doi: 10.1021/ac025890a. [DOI] [PubMed] [Google Scholar]
- 13.Reinhold VN, Reinhold BB, Costello CE. Anal Chem. 1995;67:1772–1784. doi: 10.1021/ac00107a005. [DOI] [PubMed] [Google Scholar]
- 14.Weiskopf AS, Vouros P, Harvey DJ. Rapid Commun Mass Spectrom. 1997;11:1493–1504. doi: 10.1002/(SICI)1097-0231(199709)11:14<1493::AID-RCM40>3.0.CO;2-1. [DOI] [PubMed] [Google Scholar]
- 15.Hanneman AJ, Rosa JC, Ashline D, Reinhold VN. Glycobiology. 2006;16:874–890. doi: 10.1093/glycob/cwl011. [DOI] [PubMed] [Google Scholar]
- 16.Sheeley DM, Merrill BM, Taylor LC. Anal Biochem. 1997;247:102–110. doi: 10.1006/abio.1997.2036. [DOI] [PubMed] [Google Scholar]
- 17.Patel T, Bruce J, Merry A, Bigge C, Wormald M, Jaques A, Parekh R. Biochemistry. 1993;32:679–693. doi: 10.1021/bi00053a037. [DOI] [PubMed] [Google Scholar]
- 18.Shimizu Y, Nakata M, Kuroda Y, Tsutsumi F, Kojima N, Mizuochi T. Carbohydr Res. 2001;332:381–388. doi: 10.1016/s0008-6215(01)00113-6. [DOI] [PubMed] [Google Scholar]
- 19.Ciucanu I, Kerek F. Carbohydr Res. 1984;131:209–217. [Google Scholar]
- 20.Ciucanu I, Costello CE. J Am Chem Soc. 2003;125:16213–16219. doi: 10.1021/ja035660t. [DOI] [PubMed] [Google Scholar]
- 21.Harvey DJ, Wing DR, Kuster B, Wilson IB. J Am Soc Mass Spectrom. 2000;11:564–571. doi: 10.1016/S1044-0305(00)00122-7. [DOI] [PubMed] [Google Scholar]
- 22.Gleeson PA, Schachter H. J Biol Chem. 1983;258:6162–6173. [PubMed] [Google Scholar]
- 23.Butler M, Quelhas D, Critchley AJ, Carchon H, Hebestreit HF, Hibbert RG, Vilarinho L, Teles E, Matthijs G, Schollen E, Argibay P, Harvey DJ, Dwek RA, Jaeken J, Rudd PM. Glycobiology. 2003;13:601–622. doi: 10.1093/glycob/cwg079. [DOI] [PubMed] [Google Scholar]
- 24.Viseux N, de Hoffmann E, Domon B. Anal Chem. 1998;70:4951–4959. doi: 10.1021/ac980443+. [DOI] [PubMed] [Google Scholar]
- 25.Kameyama A, Kikuchi N, Nakaya S, Ito H, Sato T, Shikanai T, Takahashi Y, Takahashi K, Narimatsu H. Anal Chem. 2005;77:4719–4725. doi: 10.1021/ac048350h. [DOI] [PubMed] [Google Scholar]
- 26.Ashline D, Singh S, Hanneman A, Reinhold VN. Anal Chem. 2005;77:6250–6262. doi: 10.1021/ac050724z. [DOI] [PMC free article] [PubMed] [Google Scholar]
- 27.Zhang H, Singh S, Reinhold VN. Anal Chem. 2005;77:6263–6270. doi: 10.1021/ac050725r. [DOI] [PMC free article] [PubMed] [Google Scholar]
- 28.Lapadula AJ, Hatcher PJ, Hanneman AJ, Ashline DJ, Zhang H, Reinhold VN. Anal Chem. 2005;77:6271–6279. doi: 10.1021/ac050726j. [DOI] [PMC free article] [PubMed] [Google Scholar]
- 29.Bagratashvili VN, Letokov VS, Makarov AA, Ryabov EA. Multiple Photon Infrared Laser Photophysics and Photochemistry. Harwood; Chur, Switzerland: 1985. [Google Scholar]
- 30.Polfer NC, Valle JJ, Moore DT, Oomens J, Eyler JR, Bendiak B. Anal Chem. 2006;78:670–679. doi: 10.1021/ac0519458. [DOI] [PubMed] [Google Scholar]
- 31.von Helden G, van Heijnsbergen D, Meijer G. J Phys Chem A. 2003;107:1671–1688. [Google Scholar]
- 32.Lancaster KS, An HJ, Li B, Lebrilla CB. Anal Chem. 2006;78:4990–4997. doi: 10.1021/ac0600656. [DOI] [PubMed] [Google Scholar]
- 33.An HJ, Miyamoto S, Lancaster KS, Kirmiz C, Li B, Lam KS, Leiserowitz GS, Lebrilla CB. J Proteome Res. 2006;5:1526. doi: 10.1021/pr060010k. [DOI] [PubMed] [Google Scholar]
- 34.Patel T, Bruce J, Merry A, Bigge C, Wormald M, Jaques A, Parekh R. Biochemistry. 1993;32:679–693. doi: 10.1021/bi00053a037. [DOI] [PubMed] [Google Scholar]
- 35.Kuster B, Mann M. Anal Chem. 1999;71:1431–1440. doi: 10.1021/ac981012u. [DOI] [PubMed] [Google Scholar]