Abstract
A novel, ultra low-cost surface enhanced Raman spectroscopy (SERS) substrate has been developed by modifying the surface chemistry of cellulose paper and patterning nanoparticle arrays, all with a consumer inkjet printer. Micro/nanofabrication of SERS substrates for on-chip chemical and biomolecular analysis has been under intense investigation. However, the high cost of producing these substrates and the limited shelf life severely limit their use, especially for routine laboratory analysis and for point-of-sample analysis in the field. Paper-based microfluidic biosensing systems have shown great potential as low-cost disposable analysis tools. In this work, this concept is extended to SERS-based detection. Using an inexpensive consumer inkjet printer, cellulose paper substrates are modified to be hydrophobic in the sensing regions. Synthesized silver nanoparticles are printed onto this hydrophobic paper substrate with microscale precision to form sensing arrays. The hydrophobic surface prevents the aqueous sample from spreading throughout the paper and thus concentrates the analyte within the sensing region. A SERS fingerprint signal for Rhodamine 6G dye was observed for samples with as low as 10 femtomoles of analyte in a total sample volume of 1 μL. This extraordinarily simple technique can be used to construct SERS microarrays immediately before sample analysis, enabling ultra low-cost chemical and biomolecular detection in the lab as well as in the field at the point of sample collection.
Surface enhanced Raman spectroscopy (SERS) is a powerful technique for chemical and biomolecular identification. Due to the optical and chemical enhancement of noble metal nanostructures, single molecule identification has been demonstrated with SERS.1,2 Throughout the past few years, a number of research efforts have aimed to translate the capabilities of SERS to a practical microsystem that can be utilized for routine analysis of samples in the lab or in the field.3–13 In general, these SERS microsystems require microfabrication, and in some cases require nanofabrication to produce a surface with a metal nanostructure. As a result, chemical and biomolecular detection using SERS can be costly on a per-sample basis. Furthermore, SERS-active substrates produced through nanofabrication techniques have a short shelf life and must be used quickly. SERS activity of silver nanostructures has been shown to decrease drastically as a result of oxidation within a week.14,15 For these reasons, SERS is not practical for routine laboratory analysis of chemicals and biomolecules and is not an option for many field-based applications. Thus, a new paradigm to enable simple and low-cost fabrication of disposable SERS microdevices is needed.
Paper-based microfluidics and sensing represents a new and outstanding approach to extremely low cost devices for molecular analysis.16–25 Hydrophilic channels surrounded by hydrophobic barriers can be fabricated in paper using photolithography16–18,22 or by inkjet printing, which is of particular interest because of the ease of fabrication.21,26 In combination with paper-based microfluidics, electrochemical biosensors have been fabricated by bringing the fluidic channel into contact with electrodes,19,22 while various colorimetric assays incorporating paper-based microfluidics have also been reported.20,21,23–25 In one report, it is suggested that the materials to produce paper-based biosensors cost only a few cents per device.17
In this Letter, we extend the newly emerging field of paper-based molecular analysis microdevices to include SERS. To our knowledge, we are reporting on the first highly sensitive SERS substrate to be fabricated on paper by inkjet printing, at a total material cost of two cents per array (1 × 10 spots). A few reports of SERS using silver coated paper were presented decades ago.27,28 However, in the work presented in this Letter, silver nanoparticles are embedded into paper with any desired pattern at microscale precision using an inexpensive ($60) consumer inkjet printer. In addition, the inkjet printer is used to create a hydrophobic surface in the sensing region, which prevents the sample from spreading and thus concentrates the analyte molecules in the small sensing area. SERS measurements are acquired after a sample droplet is placed onto the SERS-active printed region. Using this silver nanoparticle substrate, we show the ability to identify the fingerprint signal of Rhodamine 6G (R6G), even when only 10 femtomoles of analyte are applied to the paper-based SERS substrate. In addition, we show the reproducibility of the signal across multiple printed spots of the sensing region and at different locations within each printed spot.
EXPERIMENTAL SECTION
Materials
Fisherbrand chromatography paper, 0.19 mm in thickness, was used for the substrate; hexadecenyl succinic anhydride (ASA) from Thermo-Fisher Scientific (Pittsburgh, PA) was used to create a hydrophobic surface on the paper. Silver nitrate, sodium citrate, glycerol, and hexanol were obtained from Sigma-Aldrich (St. Louis, MO). Rhodamine 590 chloride, also known as Rhodamine 6G (R6G), was purchased from Exciton (Dayton, OH). All chemicals were used as received. Safety precautions were taken in the handling of all chemicals according to their respective MSDS. Refillable ink cartridges were purchased from Alpha D Development Inc. (Lakeland, FL) and used without modification.
Nanoparticle Synthesis
Silver nanoparticles were synthesized using the classic method of Lee and Meisel.29 Briefly, 90 mg of silver nitrate was added to 500 mL of ultrapure water (18.2 MΩ), which was then brought to a boil in a flask under vigorous stirring. Sodium citrate (100 mg) was added, and the solution was left to boil for an additional 10 min. After the solution turned greenish brown, which indicated the formation of silver colloid, it was then removed from heat.
Printing
An Epson Workforce 30 inkjet printer was chosen to generate the SERS-active substrates because the printing actuation is MEMS based.30 Epson's Micro Piezo technology uses piezo elements to propel ink onto the substrate, in contrast to the thermal method, which uses heat to create air bubbles, causing the ink to be ejected. Piezo elements are much more amenable to the different kinds of solvents used for printing. Prior to the printing of silver nanoparticles onto paper, the substrate was made hydrophobic using ASA, a common paper sizing agent. Hydro-phobization was achieved by inkjet printing a 10% ASA solution in hexanol onto the entire surface of the paper, followed by curing at 175 °C on a laboratory hot plate for 5 min.
To form the silver ink, nanoparticle colloids (described above) were centrifuged at 10 000g to concentrate the nanoparticles; 98% of the supernatant was removed, and glycerol in a volume ratio of 2:5 (glycerol/colloid solution) was added to the remaining solution to adjust the viscosity and surface tension of the ink for optimal printing. To prevent clogging of the print head, the nanoparticle ink was filtered using a 0.2 μm Millipore PTFE membrane filter to remove any large particles from the ink solution.
The ink was then injected into refillable printing cartridges. An open source vector graphics editor, Inkscape, was used to define the shapes to print using colors that correspond to unique cartridges. Silver nanoparticles were printed in circles of 1 mm diameter. To increase the nanoparticle concentration in the paper, the printing of sensors was repeated five times.
SERS Measurements
Measurements were acquired within 3 h of printing the substrates. SERS was performed using a Horiba Jobin-Yvon LabRAM HR-VIS Raman microscope using 632.8 nm HeNe laser excitation with less than 15 mW output. A 10× objective was used for focusing the excitation light onto the substrate and for collecting the scattered photons. The paper containing an array of printed SERS active regions was taped onto a glass slide, which was then placed on the microscope stage. Using a micropipet, a 1 μL droplet of sample analyte was placed onto the printed circle of silver nanoparticles. SERS measurements were acquired after the droplet dried. Concentrations of 1 nM, 10 nM, 100 nM, and 1 μM R6G in water were tested on three spots each. Measurements were acquired at three different locations within each printed circle, giving a total of nine SERS measurements for each R6G concentration. For 1 nM and 10 nM concentrations, a 5 s CCD exposure was used; for 100 nM R6G, a 2 s exposure was used, and for 1 μM, a 2 s exposure and an optical density 1 (OD1) filter on the laser were used. To determine the SERS enhancement factor of the inkjet-printed substrates, a 1 μL droplet of 2 mM R6G was spotted onto paper coated with ASA. The resulting signal was compared with the SERS measurements recorded with printed silver spots; for each recorded signal, the area within two prominent R6G Raman bands was integrated, and the resulting value was compared between the SERS-active and non-SERS active substrates.
RESULTS AND DISCUSSION
When an organic material is used as a SERS substrate, one must be concerned that the scattered light from the substrate could overwhelm the signal from the analyte. In fact, we measured the scattered light from 21 different types of paper in order to select the material with the least background signal. These materials included printer paper, 100% cotton fiber paper, coffee filter paper, a napkin, and many others. The Raman microscope was used to measure the scattered light detected within the spectrum of interest for SERS detection (500–2000 cm−1). The signal from many of the papers saturated the CCD of the spectrometer after only a few seconds of integration time, making them absolutely impossible to use for paper-based SERS. This is likely due to the chemical treatments that many paper products undergo.20 The papers with the lowest background were filter paper and chromatography paper, which contain essentially nothing other than cellulose. In the work presented in this Letter, we use chromatography paper for all of the SERS measurements.
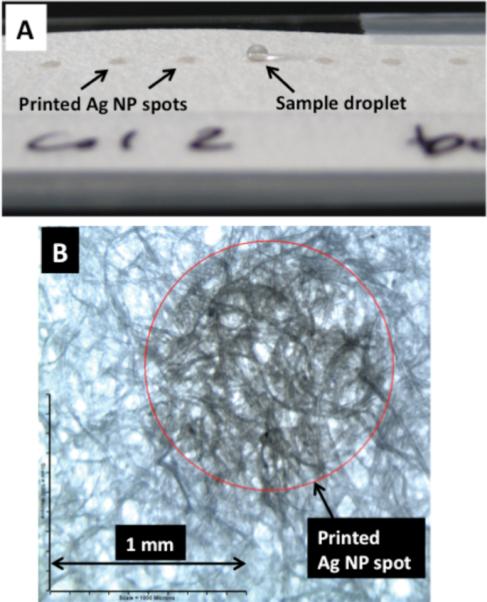
Figure 1A shows a photo of silver nanoparticles printed onto the paper. The circles of printed nanoparticles were designed to be 1 mm in diameter. During printing, the silver nanoparticles appear brown on the paper initially and progressively become darker in color with each consecutive printing. Upon drying, the spots appear grayish due to the formation of silver clusters. For all of the SERS measurements in this work, five printing cycles of nanoparticles were used. For the purposes of this Letter, the number of print cycles was not optimized. It was observed that multiple print cycles resulted in increased SERS activity as compared to a single print cycle. In future work, the synthesis of the silver nanoparticle ink will be optimized to minimize the need for multiple print cycles.
Figure 1.

(A) Photo of an array of inkjet-printed silver nanoparticle (Ag NP) spots on chromatography paper. A 1 μL aqueous droplet was placed on one Ag NP spot. Micrograph of one printed Ag NP spot on paper in bright-field mode.
The precision with which we can print the nanoparticles is demonstrated in Figure 1B, which is a magnified image of one of the nanoparticle substrates in Figure 1A. Even after five printing cycles, the transition between the silver nanoparticle embedded region and the region without silver is clearly distinguishable. It appears that even with repeated feeds, we can print with a precision better than tens of micrometers. With better ink formulation, repeated printing could be avoided. We expect that the precision as good as 10 μm and lower can be achieved, making it possible to print SERS microarrays with submillimeter sensor sizes.
Printing high-precision small-area SERS-active substrates on paper is not useful if the sample delivery is not well controlled. We observed that a 1 μL droplet of water applied to plain chromatography paper immediately spreads by approximately 5 mm in diameter, which dilutes the sample across this large area. For SERS, this is problematic, as the laser excitation is delivered only to a submillimeter area of the sensor. To control the aqueous sample delivery, we inkjet printed ASA, a common paper sizing agent, onto the sensing region of the paper before printing the nanoparticles. As seen in Figure 1A, when a 1 μL droplet of water is applied to the SERS-active spot, the water beads up on top of the biosensor, slowly drying in place. This delivers all of the target analyte molecules onto the small-area SERS-active substrate. The simplicity of this inkjet printing hydrophobization technique means that the paper can be treated immediately before use as a sensing substrate.
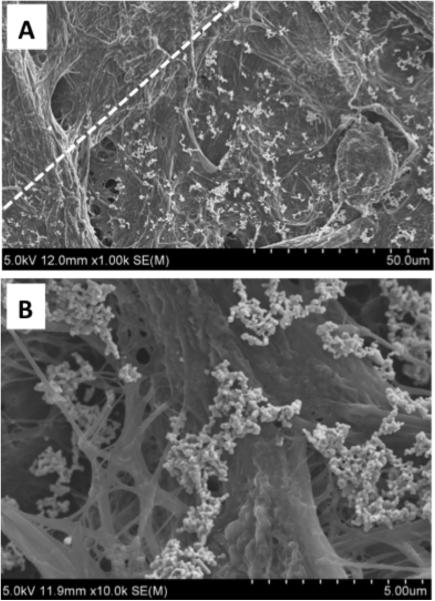
Figure 2 shows a scanning electron micrograph of silver nanoparticle clusters from one of the inkjet-printed spots on paper. The high surface density of silver nanoclusters shown in Figure 2A illustrates the promise of this printing technique for generating substrates with high SERS activity. The image also reveals the precision of the inkjet-printing technique. The dashed line shows the discrete border of the printed SERS-active spot. The density of silver nanoclusters below and to the right of the dashed line is similar throughout the entire spot, while it is essentially zero to the upper left of the dashed line. Figure 2B shows a few selected silver nanoclusters dried onto the paper fibers. These clusters, which assemble as the silver colloid solution dries, are advantageous for many SERS applications, as they cause the localized surface plasmon resonance to extend into the red and infrared and also generate higher SERS enhancements due to hot spots.
Figure 2.
(A) Scanning electron micrograph of a printed Ag NP spot. The dashed line shows the boundary of the spot. (B) Ag nanoclusters within the printed spot.
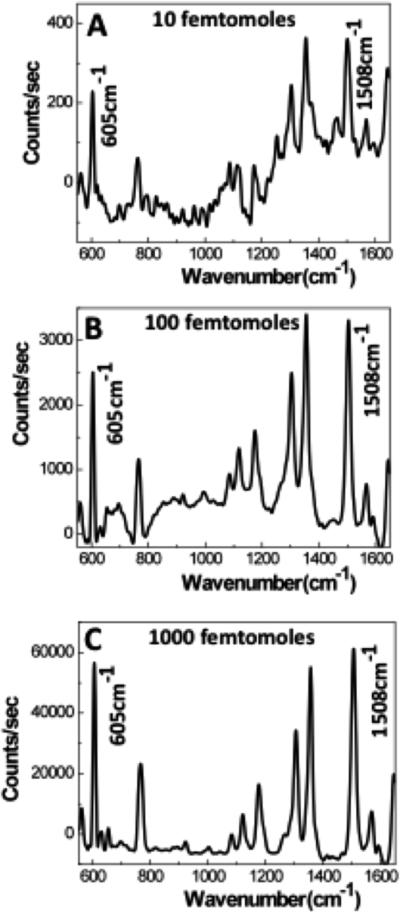
Typical SERS signals recorded for 10, 100, and 1000 nM R6G concentrations are shown in Figure 3. As only 1 μL sample volume is consumed for each measurement, the total number of R6G molecules applied to the sensors is 10, 100, and 1000 femtomoles, respectively. Different CCD exposure times and laser power values were used to record the SERS signals across the concentration range shown in Figure 3; the signals are normalized to 1 s of CCD exposure and to zero optical density filtering of the laser source. Even for the signal acquired from 10 femtomoles of analyte, the characteristic R6G Raman bands at 605, 1310, 1365, and 1508 cm−1 have high signal-to-noise ratio and are easily distinguishable. As a result of the extended exposure time (5 s) for this concentration, optical scattering due to the paper is also visible; however, it does not interfere with the ability to identify the R6G Raman signal. The high signal-to-noise ratio for these R6G Raman bands indicates that we can detect a lower concentration of analyte; however, for 1 femtomole, the detection of R6G was not repeatable.
Figure 3.

Typical Raman spectra of R6G acquired from three spots on the printed array. (A) 10 femtomoles, (B) 100 femtomoles, and (C) 1000 femtomoles of R6G in the droplet sample. A 5-point FFT smoothing is used on the data.
The SERS enhancement factor for the inkjet-printed substrate was determined by comparing signals acquired on paper with and without printed silver nanoparticles. For a 1 μL droplet of 2 mM R6G on paper, the acquired SERS signal (N = 3) for the 1508 cm−1 was approximately equal to the signal acquired for 10 nM R6G on the printed silver nanoparticles. This implies an enhancement factor of 2 × 10⁵. Considering that the silver nanoclusters cover only approximately 5% of the surface (Figure 2), the average enhancement factor of individual nanoclusters is nearly 107, which is a typical enhancement factor for nanoclusters under red excitation. In future work, we will optimize the nanoparticle geometry and clustering for peak resonance at the Raman excitation wavelength. Combining this with increased nanocluster density, we believe that the SERS enhancement for the inkjet-printed substrates can approach 107, which is in the range of many micro/nanofabricated SERS substrates.31
Variation in measured signal intensity across various locations has always been a concern for SERS, especially when the substrate has randomized features. To determine if signal inconsistencies pose problems for our inkjet-printed SERS substrates, we recorded SERS signals from three randomly selected locations within each printed SERS-active spot, separated by a distance greater than 100 μm, and we recorded signals from three printed spots for each concentration of R6G (i.e., nine data sets for each sample concentration). To analyze the collected signals, we calculated the area in the 605 and 1508 cm−1 R6G Raman bands and then summed the areas for each acquired signal (after normalization). Table 1 shows the mean and standard deviation of the sums within each SERS-active spot in the array. The results indicate that the variation within each spot is small, but variation from spot to spot for the same concentration is relatively large. We suspect that this resulted from a combination of factors: namely, the random clustering of the silver nanoparticles, variations in printing process, and inconsistency in applying the 1 μL sample droplet onto each spot.
Table 1.
Mean and Standard Deviation of Sum of the Integrals of the 605 and 1508 cm−1 R6G Raman Bands within Each SERS-Active Spot in the Array
| concentration of R6G (nM) | spot no. | mean no. of counts/s | standard deviation |
|---|---|---|---|
| 10 | 1 | 1.07 × 10⁴ | 2.07 × 10³ |
| 2 | 8.28 × 10³ | 6.36 × 10² | |
| 3 | 4.04 × 10³ | 5.28 × 10² | |
| 100 | 4 | 7.47 × 10⁴ | 9.92 × 10³ |
| 5 | 3.15 × 10⁴ | 1.54 × 10⁴ | |
| 6 | 9.44 × 10⁴ | 1.90 × 10⁴ | |
| 1000 | 7 | 2.98 × 10⁶ | 1.30 × 10⁶ |
| 8 | 3.31 × 10⁶ | 9.62 × 10⁵ | |
| 9 | 2.38 × 10⁶ | 2.11 × 10⁶ |
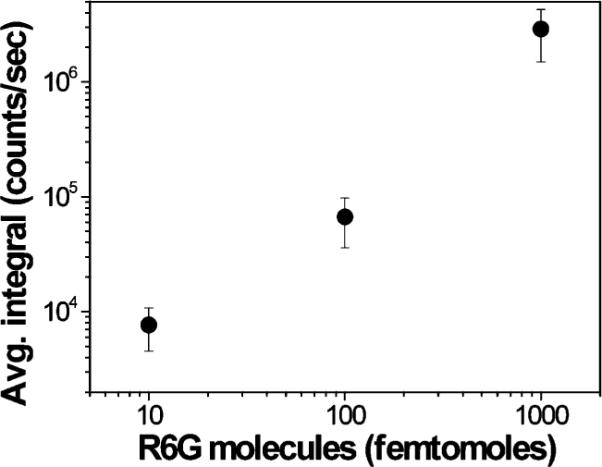
However, when analyzing the signal for each concentration across the respective three spots, a predictable trend in the data emerges. In Figure 4, we have plotted the mean and standard deviation across all of the nine signals acquired for each concentration (three signals acquired at three locations in each of three spots). These results illustrate that overall the measurements are repeatable and predictable across the concentration range using an inkjet printed array of SERS-active sensors.
Figure 4.

Average signal magnitude and standard deviation for each R6G dilution. For each concentration, three signals are acquired from each of three spots. The data points represent the averaged sum of the integrals of the 605 and 1508 cm−1 R6G Raman bands.
CONCLUSIONS
We have demonstrated an ultra low-cost paper-based SERS substrate using inkjet printing as the fabrication method. A high signal-to-noise ratio was achieved, even with only 10 femtomoles of analyte molecules in the entire sample volume and with a relatively low power red laser as the excitation source. In addition to the excellent performance, the substrate does not require any complicated or lengthy micro- or nanofabrication. The SERS substrate can be created in nearly any environment at the moment the user is ready to perform a measurement. Most importantly, this eliminates the problem of the limited shelf life of SERS substrates because the inkjet printed substrates do not need to be acquired in bulk and stored; instead, they can be fabricated with unprecedented simplicity and speed at the time and point of use. The extremely low cost and simplicity of fabrication make the paper-based SERS substrates ideal for a number of applications, including routine lab use, as well as use in the field at the point of sample acquisition. Future improvements will include integration with paper-based microfluidics and the use of a simple fiber optic probe to excite the substrate and collect the scattered light when performing measurements. We believe that this technique has the potential to dramatically increase the applicability of SERS-based chemical and biomolecular detection and, as a result, enable much-needed low-cost and rapid sample analysis.
ACKNOWLEDGMENT
The authors acknowledge the University of Maryland Nano-Bio Systems Laboratory for use of the JY LabRAM Raman microscope. The authors also acknowledge the support of the Maryland NanoCenter and its NispLab for the use of the Hitachi SU-70 Analytical UHR FEG-SEM. The NispLab is supported in part by the NSF as a MRSEC Shared Experimental Facility. Funding for this work was provided by the National Institute for Biomedical Imaging and Bioengineering (5K25EB006011-5) and by the Maryland Department of Business and Economic Development's (DBED) Nanobiotechnology Initiative. The authors thank Dr. I-Jane Chen and Eric Hoppmann for useful discussions.
References
- (1).Kneipp K, Wang Y, Kneipp H, Perelman LT, Itzkan I, Dasari RR, Feld MS. Phys. Rev. Lett. 1997;78:1667–1670. [Google Scholar]
- (2).Nie S, Emory SR. Science. 1997;275:1102–1106. doi: 10.1126/science.275.5303.1102. [DOI] [PubMed] [Google Scholar]
- (3).Liu GL, Lee LP. Appl. Phys. Lett. 2005;87:074101. [Google Scholar]
- (4).Measor P, Seballos L, Yin D, Zhang JZ, Lunt EJ, Hawkins AR, Schmidt H. Appl. Phys. Lett. 2007;90:211107. [Google Scholar]
- (5).Strehle KR, Cialla D, Rosch P, Henkel T, Kohler M, Popp J. Anal. Chem. 2007;79:1542–1547. doi: 10.1021/ac0615246. [DOI] [PubMed] [Google Scholar]
- (6).White IM, Gohring J, Fan X. Optics Express. 2007;15:17433–17442. doi: 10.1364/oe.15.017433. [DOI] [PMC free article] [PubMed] [Google Scholar]
- (7).Quang LX, Lim C, Seong GH, Choo J, Dob KJ, Yoo S-K. Lab Chip. 2008;8:2214–2219. doi: 10.1039/b808835g. [DOI] [PubMed] [Google Scholar]
- (8).Choi D, Kang T, Cho H, Choi Y, Lee LP. Lab Chip. 2009;9:239–243. doi: 10.1039/b812067f. [DOI] [PubMed] [Google Scholar]
- (9).Gamby J, Rudolf A, Abid M, Girault HH, Deslouisa C, Tribollet B. Lab Chip. 2009;9:1806–1808. doi: 10.1039/b820802f. [DOI] [PubMed] [Google Scholar]
- (10).Huh YS, Chung AJ, Cordovez B, Erickson D. Lab Chip. 2009;9:433–439. doi: 10.1039/b809702j. [DOI] [PMC free article] [PubMed] [Google Scholar]
- (11).Wang G, Lim C, Chen L, Chon H, Choo J, Hong J, Demello AJ. Anal. Bioanal. Chem. 2009;394:1827–1832. doi: 10.1007/s00216-009-2832-7. [DOI] [PubMed] [Google Scholar]
- (12).Wang M, Benford M, Jing N, Cote G, Kameoka J. Microfluid. Nanofluid. 2009;6:411–417. [Google Scholar]
- (13).Lim C, Hong J, Chung BG, Demello AJ, Choo J. Analyst. 2010;135:837–844. doi: 10.1039/b919584j. [DOI] [PubMed] [Google Scholar]
- (14).Erol M, Han Y, Stanley SK, Stafford CM, Du H, Sukhishvili S. J. Am. Chem. Soc. 2009;131:7480–7481. doi: 10.1021/ja807458x. [DOI] [PubMed] [Google Scholar]
- (15).Qi H, Alexson D, Glembocki O, Prokes SM. Nanotechnology. 2010;21:215706. doi: 10.1088/0957-4484/21/21/215706. [DOI] [PubMed] [Google Scholar]
- (16).Martinez AW, Phillips ST, Carrilho E, Thomas SW, III, Sindi H, Whitesides GM. Anal. Chem. 2008;80:3699–3707. doi: 10.1021/ac800112r. [DOI] [PMC free article] [PubMed] [Google Scholar]
- (17).Martinez AW, Phillips ST, Whitesides GM. Proc. Natl. Acad. Sci. 2008;105:19606–19611. doi: 10.1073/pnas.0810903105. [DOI] [PMC free article] [PubMed] [Google Scholar]
- (18).Martinez AW, Phillips ST, Wiley BJ, Gupta M, Whitesides GM. Lab Chip. 2008;8:2146–2150. doi: 10.1039/b811135a. [DOI] [PMC free article] [PubMed] [Google Scholar]
- (19).Dungchai W, Chailapakul O, Henry CS. Anal. Chem. 2009;81:5821–5826. doi: 10.1021/ac9007573. [DOI] [PubMed] [Google Scholar]
- (20).Pelton R. Trends Anal. Chem. 2009;28:925–942. doi: 10.1016/j.trac.2009.05.005. [DOI] [PMC free article] [PubMed] [Google Scholar]
- (21).Li X, Tian J, Garnier G, Shen W. Colloids Surf., B. 2010;76:564–570. doi: 10.1016/j.colsurfb.2009.12.023. [DOI] [PubMed] [Google Scholar]
- (22).Nie Z, Nijhuis CA, Gong J, Chen X, Kumachev A, Martinez AW, Narovlyansky M, Whitesides GM. Lab Chip. 2010;10:477–483. doi: 10.1039/b917150a. [DOI] [PMC free article] [PubMed] [Google Scholar]
- (23).Abe K, Suzuki K, Citterio D. Anal. Chem. 2008;80:6928–6934. doi: 10.1021/ac800604v. [DOI] [PubMed] [Google Scholar]
- (24).Zhao WA, Ali MM, Aguirre SD, Brook MA, Li YF. Anal. Chem. 2008;80:8431–8437. doi: 10.1021/ac801008q. [DOI] [PubMed] [Google Scholar]
- (25).Hossain SMZ, Luckham RE, Smith AM, Lebert JM, Davies LM, Pelton R, Filipe CDM, Brennan JD. Anal. Chem. 2009;81:5474–5483. doi: 10.1021/ac900660p. [DOI] [PubMed] [Google Scholar]
- (26).Khan MS, Fon D, Li X, Tian J, Forsythe J, Garniera G, Shen W. Colloids Surf., B. 2010;75:441–447. doi: 10.1016/j.colsurfb.2009.09.032. [DOI] [PubMed] [Google Scholar]
- (27).Laserna JJ, Campiglia AD, Winefordner JD. Anal. Chem. 1989;61:1697–1701. doi: 10.1021/ac00190a022. [DOI] [PubMed] [Google Scholar]
- (28).Cabalin LM, Laserna JJ. Anal. Chim. Acta. 1995;310:337–345. [Google Scholar]
- (29).Lee PC, Meisel D. J. Phys. Chem. 1982;86:3391–3395. [Google Scholar]
- (30). http://global.epson.com/technology/micropiezo/about.htm.
- (31).Lin X-M, Cui Y, Xu Y-H, Ren B, Tian Z-Q. Anal. Bioanal. Chem. 2009;394:1729–1745. doi: 10.1007/s00216-009-2761-5. [DOI] [PubMed] [Google Scholar]


